Castaways Beach Airbnb Market Analysis 2025: Short Term Rental Data & Vacation Rental Statistics in Queensland, Australia
Is Airbnb profitable in Castaways Beach in 2025? Explore comprehensive Airbnb analytics for Castaways Beach, Queensland, Australia to uncover income potential. This 2025 STR market report for Castaways Beach, based on AirROI data from April 2024 to March 2025, reveals key trends in the niche market of 17 active listings.
Whether you're considering an Airbnb investment in Castaways Beach, optimizing your existing vacation rental, or exploring rental arbitrage opportunities, understanding the Castaways Beach Airbnb data is crucial. Leveraging the low regulation environment is key to maximizing your short term rental income potential. Let's dive into the specifics.
Key Castaways Beach Airbnb Performance Metrics Overview
Monthly Airbnb Revenue Variations & Income Potential in Castaways Beach (2025)
Understanding the monthly revenue variations for Airbnb listings in Castaways Beach is key to maximizing your short term rental income potential. Seasonality significantly impacts earnings. Our analysis, based on data from the past 12 months, shows that the peak revenue month for STRs in Castaways Beach is typically January, while May often presents the lowest earnings, highlighting opportunities for strategic pricing adjustments during shoulder and low seasons. Explore the typical Airbnb income in Castaways Beach across different performance tiers:
- Best-in-class properties (Top 10%) achieve $16,404+ monthly, often utilizing dynamic pricing and superior guest experiences.
- Strong performing properties (Top 25%) earn $8,179 or more, indicating effective management and desirable locations/amenities.
- Typical properties (Median) generate around $4,386 per month, representing the average market performance.
- Entry-level properties (Bottom 25%) see earnings around $2,534, often with potential for optimization.
Average Monthly Airbnb Earnings Trend in Castaways Beach
Castaways Beach Airbnb Occupancy Rate Trends (2025)
Maximize your bookings by understanding the Castaways Beach STR occupancy trends. Seasonal demand shifts significantly influence how often properties are booked. Typically, Marchsees the highest demand (peak season occupancy), while May experiences the lowest (low season). Effective strategies, like adjusting minimum stays or offering promotions, can boost occupancy during slower periods. Here's how different property tiers perform in Castaways Beach:
- Best-in-class properties (Top 10%) achieve 85%+ occupancy, indicating high desirability and potentially optimized availability.
- Strong performing properties (Top 25%) maintain 77% or higher occupancy, suggesting good market fit and guest satisfaction.
- Typical properties (Median) have an occupancy rate around 51%.
- Entry-level properties (Bottom 25%) average 28% occupancy, potentially facing higher vacancy.
Average Monthly Occupancy Rate Trend in Castaways Beach
Average Daily Rate (ADR) Airbnb Trends in Castaways Beach (2025)
Effective short term rental pricing strategy in Castaways Beach involves understanding monthly ADR fluctuations. The Average Daily Rate (ADR) for Airbnb in Castaways Beach typically peaks in December and dips lowest during March. Leveraging Airbnb dynamic pricing tools or strategies based on this seasonality can significantly boost revenue. Here's a look at the typical nightly rates achieved:
- Best-in-class properties (Top 10%) command rates of $1,088+ per night, often due to premium features or locations.
- Strong performing properties (Top 25%) achieve nightly rates of $736 or more.
- Typical properties (Median) charge around $444 per night.
- Entry-level properties (Bottom 25%) earn around $234 per night.
Average Daily Rate (ADR) Trend by Month in Castaways Beach
Get Live Castaways Beach Market Intelligence 👇

Explore Real-time Analytics
Airbnb Seasonality Analysis & Trends in Castaways Beach (2025)
Peak Season (January, December, September)
- Revenue averages $9,557 per month
- Occupancy rates average 58.7%
- Daily rates average $597
Shoulder Season
- Revenue averages $6,704 per month
- Occupancy maintains around 50.6%
- Daily rates hold near $531
Low Season (May, June, August)
- Revenue drops to average $4,672 per month
- Occupancy decreases to average 46.5%
- Daily rates adjust to average $530
Seasonality Insights for Castaways Beach
- The Airbnb seasonality in Castaways Beach shows highly seasonal trends requiring careful strategy. While the sections above show seasonal averages, it's also insightful to look at the extremes:
- During the high season, the absolute peak month showcases Castaways Beach's highest earning potential, with monthly revenues capable of climbing to $10,093, occupancy reaching a high of 62.4%, and ADRs peaking at $625.
- Conversely, the slowest single month of the year, typically falling within the low season, marks the market's lowest point. In this month, revenue might dip to $3,573, occupancy could drop to 39.5%, and ADRs may adjust down to $464.
- Understanding both the seasonal averages and these monthly peaks and troughs in revenue, occupancy, and ADR is crucial for maximizing your Airbnb profit potential in Castaways Beach.
Seasonal Strategies for Maximizing Profit
- Peak Season: Maximize revenue through premium pricing and potentially longer minimum stays. Ensure high availability.
- Low Season: Offer competitive pricing, special promotions (e.g., extended stay discounts), and flexible cancellation policies. Target off-season travelers like remote workers or budget-conscious guests.
- Shoulder Seasons: Implement dynamic pricing that balances peak and low rates. Target weekend travelers or specific events. Offer slightly more flexible terms than peak season.
- Regularly analyze your own performance against these Castaways Beach seasonality benchmarks and adjust your pricing and availability strategy accordingly.
Best Areas for Airbnb Investment in Castaways Beach (2025)
Exploring the top neighborhoods for short-term rentals in Castaways Beach? This section highlights key areas, outlining why they are attractive for hosts and guests, along with notable local attractions. Consider these locations based on your target guest profile and investment strategy.
| Neighborhood / Area | Why Host Here? (Target Guests & Appeal) | Key Attractions & Landmarks |
|---|---|---|
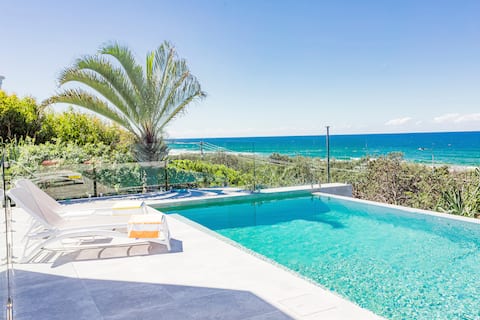
| Castaways Beach | A serene beachside retreat known for its natural beauty, perfect for families and couples seeking a relaxing vacation. The quiet atmosphere and proximity to Noosa make it a desirable location for tourists. | Noosa National Park, Noosa Main Beach, Hastings Street, Eumundi Markets, Laguna Bay, Noosa Spit |
| Noosa Heads | Famous for its stunning beaches and upscale lifestyle, Noosa Heads offers a mix of luxury accommodations, shopping, and dining. It's a hotspot for both leisure and adventure travelers. | Noosa Main Beach, Noosa National Park, Hastings Street, Noosa Everglades, Great Sandy National Park, Laguna Lookout |
| Coolum Beach | A laid-back coastal town with beautiful beaches, favored by families and surfers. It has a friendly atmosphere and various recreational activities, making it a great spot for vacation rentals. | Coolum Beach, Mount Coolum National Park, Coolum Surfing School, Coolum Boardwalk, Peregian Beach |
| Sunshine Beach | A more tranquil alternative to Noosa, Sunshine Beach offers a relaxed vibe with excellent surf beaches and a family-friendly atmosphere. Ideal for those looking to escape the hustle. | Sunshine Beach, Sunshine Village, Noosa National Park, Whale Watching, Beachfront cafes |
| Peregian Beach | Known for its stunning beachfront and relaxed vibe, Peregian Beach attracts holidaymakers looking for a less crowded beach experience, with great local dining options. | Peregian Beach, Peregian Village, Peregian Park, Noosa National Park, Sunshine Coast Football Club |
| Eumundi | Famous for the Eumundi Markets, this charming town offers a unique cultural and artistic vibe. It's a great base for those visiting the hinterland and looking for a local experience. | Eumundi Markets, Eumundi-Range National Park, Noosa Botanic Gardens, Boutique shops, Local art galleries |
| Tewantin | A gateway to Noosa National Park and the Noosa River, Tewantin combines natural beauty with a friendly community atmosphere, making it appealing for family-friendly stays. | Noosa River, Tewantin National Park, Tewantin Markets, Historic Tewantin, Ferry to Noosa |
| Marcus Beach | A quiet residential beach area known for its relaxed atmosphere and proximity to Noosa. Ideal for those looking for a peaceful stay while still being close to attractions. | Marcus Beach, Nearby nature reserves, Surfing spots, Local cafes, Noosa National Park |
Understanding Airbnb License Requirements & STR Laws in Castaways Beach (2025)
While Castaways Beach, Queensland, Australia currently shows low STR regulations, specific Airbnb license requirements might still exist or change. Always verify the latest short term rental regulations and Airbnb license requirements directly with local government authorities for Castaways Beach to ensure full compliance before hosting.
(Source: AirROI data, 2025, finding no licensed listings among those analyzed)
Top Performing Airbnb Properties in Castaways Beach (2025)
Benchmark your potential! Explore examples of top-performing Airbnb properties in Castaways Beachbased on Trailing Twelve Month (TTM) revenue. Analyze their characteristics, revenue, occupancy rate, and ADR to understand what drives success in this market.
Castaways Beach Escape (6 bedroom) - Ocean Views
Entire Place • 6 bedrooms
Beach front with 180 degree expansive sea views
Entire Place • 4 bedrooms
Beach Cabana @ Crusoe - Heated Pool, 1min to beach
Entire Place • 4 bedrooms
Castaways Beach house Noosa.Beachfront,pool,tennis
Entire Place • 3 bedrooms

Seaside Luxury with beach access by Stay Noosa
Entire Place • 4 bedrooms

The Seahaven ~ Family Home with Pool, Pet Friendly
Entire Place • 3 bedrooms
Note: Performance varies based on location, size, amenities, seasonality, and management quality. Data reflects the past 12 months.
Top Performing Airbnb Hosts in Castaways Beach (2025)
Learn from the best! This table showcases top-performing Airbnb hosts in Castaways Beach based on the number of properties managed and estimated total revenue over the past year. Analyze their scale and performance metrics.
| Host Name | Properties | Grossing Revenue | Stay Reviews | Avg Rating |
|---|---|---|---|---|
| Holiday Homes@Noosa | 3 | $389,609 | 94 | 4.87/5.0 |
| Jodie | 1 | $215,405 | 62 | 4.81/5.0 |
| Greg | 1 | $78,519 | 37 | 4.97/5.0 |
| Stay Noosa | 1 | $76,560 | 80 | 4.73/5.0 |
| Hubert & Denise | 1 | $75,817 | 223 | 4.87/5.0 |
| Host #35512071 | 1 | $64,520 | 0 | 0.00/5.0 |
| Aspire Property Management | 2 | $53,759 | 20 | 2.31/5.0 |
| Kim & Laura | 1 | $39,852 | 365 | 4.99/5.0 |
| Sheena | 1 | $38,387 | 659 | 4.95/5.0 |
| Kylie | 1 | $31,282 | 361 | 4.77/5.0 |
Analyzing the strategies of top hosts, such as their property selection, pricing, and guest communication, can offer valuable lessons for optimizing your own Airbnb operations in Castaways Beach.
Dive Deeper: Advanced Castaways Beach STR Market Data (2025)
Ready to unlock more insights? AirROI provides access to advanced metrics and comprehensive Airbnb data for Castaways Beach. Explore detailed analytics beyond this report to refine your investment strategy, optimize pricing, and maximize your vacation rental profits.
Explore Advanced MetricsCastaways Beach Short-Term Rental Market Composition (2025): Property & Room Types
Room Type Distribution
Property Type Distribution
Market Composition Insights for Castaways Beach
- The Castaways Beach Airbnb market composition is heavily skewed towards Entire Home/Apt listings, which make up 100% of the 17 active rentals. This indicates strong guest preference for privacy and space.
- Looking at the property type distribution in Castaways Beach, House properties are the most common (76.5%), reflecting the local real estate landscape.
- Houses represent a significant 76.5% portion, catering likely to families or larger groups.
Castaways Beach Airbnb Room Capacity Analysis (2025): Bedroom Distribution
Distribution of Listings by Number of Bedrooms
Room Capacity Insights for Castaways Beach
- The dominant room capacity in Castaways Beach is 4 bedrooms listings, making up 35.3% of the market. This suggests a strong demand for properties suitable for families or small groups.
- Together, 4 bedrooms and 3 bedrooms properties represent 64.7% of the active Airbnb listings in Castaways Beach, indicating a high concentration in these sizes.
- A significant 76.5% of listings offer 3+ bedrooms, catering to larger groups and families seeking more space in Castaways Beach.
Castaways Beach Vacation Rental Guest Capacity Trends (2025)
Distribution of Listings by Guest Capacity
Guest Capacity Insights for Castaways Beach
- The most common guest capacity trend in Castaways Beach vacation rentals is listings accommodating 8+ guests (58.8%). This suggests the primary traveler segment is likely larger groups.
- Properties designed for 8+ guests and 2 guests dominate the Castaways Beach STR market, accounting for 76.4% of listings.
- 76.5% of properties accommodate 6+ guests, serving the market segment for larger families or group travel in Castaways Beach.
- On average, properties in Castaways Beach are equipped to host 6.5 guests.
Castaways Beach Airbnb Booking Patterns (2025): Available vs. Booked Days
Available Days Distribution
Booked Days Distribution
Booking Pattern Insights for Castaways Beach
- The most common availability pattern in Castaways Beach falls within the 271-366 days range, representing 35.3% of listings. This suggests many properties have significant open periods on their calendars.
- Approximately 64.7% of listings show high availability (181+ days open annually), indicating potential for increased bookings or specific owner usage patterns.
- For booked days, the 31-90 days range is most frequent in Castaways Beach (23.5%), reflecting common guest stay durations or potential owner blocking patterns.
- A notable 41.1% of properties secure long booking periods (181+ days booked per year), highlighting successful long-term rental strategies or significant owner usage.
Castaways Beach Airbnb Minimum Stay Requirements Analysis
Distribution of Listings by Minimum Night Requirement
1 Night
2 listings
11.8% of total
2 Nights
2 listings
11.8% of total
3 Nights
4 listings
23.5% of total
4-6 Nights
6 listings
35.3% of total
7-29 Nights
1 listings
5.9% of total
30+ Nights
2 listings
11.8% of total
Key Insights
- The most prevalent minimum stay requirement in Castaways Beach is 4-6 Nights, adopted by 35.3% of listings. This highlights the market's preference for longer commitments.
- A significant segment (11.8%) caters to monthly stays (30+ nights) in Castaways Beach, pointing to opportunities in the extended-stay market.
Recommendations
- Align with the market by considering a 4-6 Nights minimum stay, as 35.3% of Castaways Beach hosts use this setting.
- If feasible, allowing 1-night stays, especially midweek or during low season, could capture last-minute bookings, as only 11.8% currently do.
- Explore offering discounts for stays of 30+ nights to attract the 11.8% of the market seeking extended stays.
- Adjust minimum nights based on seasonality – potentially shorter during low season and longer during peak demand periods in Castaways Beach.
Castaways Beach Airbnb Cancellation Policy Trends Analysis (2025)
Super Strict 30 Days
3 listings
18.8% of total
Super Strict 60 Days
2 listings
12.5% of total
Flexible
1 listings
6.3% of total
Moderate
2 listings
12.5% of total
Firm
3 listings
18.8% of total
Strict
5 listings
31.3% of total
Cancellation Policy Insights for Castaways Beach
- The prevailing Airbnb cancellation policy trend in Castaways Beach is Strict, used by 31.3% of listings.
- A majority (50.1%) of hosts in Castaways Beach utilize Firm or Strict policies, indicating a market where hosts prioritize booking security.
Recommendations for Hosts
- Consider adopting a Strict policy to align with the 31.3% market standard in Castaways Beach.
- With 31.3% using Strict terms, this is a viable option in Castaways Beach, particularly for high-value properties or during peak demand periods.
- Regularly review your cancellation policy against competitors and market demand shifts in Castaways Beach.
Castaways Beach STR Booking Lead Time Analysis (2025)
Average Booking Lead Time by Month
Booking Lead Time Insights for Castaways Beach
- The overall average booking lead time for vacation rentals in Castaways Beach is 70 days.
- Guests book furthest in advance for stays during February (average 101 days), likely coinciding with peak travel demand or local events.
- The shortest booking windows occur for stays in August (average 38 days), indicating more last-minute travel plans during this time.
- Seasonally, Winter (93 days avg.) sees the longest lead times, while Summer (50 days avg.) has the shortest, reflecting typical travel planning cycles.
Recommendations for Hosts
- Use the overall average lead time (70 days) as a baseline for your pricing and availability strategy in Castaways Beach.
- For February stays, consider implementing length-of-stay discounts or slightly higher rates for bookings made less than 101 days out to capitalize on advance planning.
- Target marketing efforts for the Winter season well in advance (at least 93 days) to capture early planners.
- Monitor your own booking lead times against these Castaways Beach averages to identify opportunities for dynamic pricing adjustments.
Popular & Essential Airbnb Amenities in Castaways Beach (2025)
Amenity Prevalence
Amenity Insights for Castaways Beach
- Essential amenities in Castaways Beach that guests expect include: Essentials, Smoke alarm, Heating, Wifi, TV, Air conditioning. Lacking these (any) could significantly impact bookings.
- Popular amenities like Hot water, Iron, Dryer are common but not universal. Offering these can provide a competitive edge.
Recommendations for Hosts
- Ensure your listing includes all essential amenities for Castaways Beach: Essentials, Smoke alarm, Heating, Wifi, TV, Air conditioning.
- Consider adding popular differentiators like Hot water or Iron to increase appeal.
- Highlight unique or less common amenities you offer (e.g., hot tub, dedicated workspace, EV charger) in your listing description and photos.
- Regularly check competitor amenities in Castaways Beach to stay competitive.
Castaways Beach Airbnb Guest Demographics & Profile Analysis (2025)
Guest Profile Summary for Castaways Beach
- The typical guest profile for Airbnb in Castaways Beach consists of primarily domestic travelers (78%), often arriving from nearby Brisbane, typically belonging to the Post-2000s (Gen Z/Alpha) group (50%), primarily speaking English or French.
- Domestic travelers account for 78.1% of guests.
- Key international markets include Australia (78.1%) and United Kingdom (7.4%).
- Top languages spoken are English (68.9%) followed by French (9.5%).
- A significant demographic segment is the Post-2000s (Gen Z/Alpha) group, representing 50% of guests.
Recommendations for Hosts
- Target domestic marketing efforts towards travelers from Brisbane and Queensland.
- Tailor amenities and listing descriptions to appeal to the dominant Post-2000s (Gen Z/Alpha) demographic (e.g., highlight fast WiFi, smart home features, local guides).
- Highlight unique local experiences or amenities relevant to the primary guest profile.
- Consider seasonal promotions aligned with peak travel times for key origin markets.
Nearby Short-Term Rental Market Comparison
How does the Castaways Beach Airbnb market stack up against its neighbors? Compare key performance metrics like average monthly revenue, ADR, and occupancy rates in surrounding areas to understand the broader regional STR landscape.
| Market | Active Properties | Monthly Revenue | Daily Rate | Avg. Occupancy |
|---|---|---|---|---|
| Noosa Heads | 1,002 | $4,142 | $382.10 | 48% |
| Kingfisher Bay | 29 | $4,002 | $342.74 | 42% |
| Happy Valley | 10 | $3,770 | $222.76 | 57% |
| Sunrise Beach | 110 | $3,666 | $357.47 | 48% |
| Sunshine Beach | 289 | $3,550 | $402.94 | 42% |
| Marcus Beach | 22 | $3,309 | $439.85 | 45% |
| Scenic Rim Regional | 284 | $3,224 | $243.05 | 46% |
| Eurong | 24 | $3,111 | $222.15 | 54% |
| Sunshine Coast Regional | 3,453 | $2,894 | $243.73 | 48% |
| Somerset Regional | 54 | $2,748 | $217.48 | 43% |