Uralla Airbnb Market Analysis 2025: Short Term Rental Data & Vacation Rental Statistics in New South Wales, Australia
Is Airbnb profitable in Uralla in 2025? Explore comprehensive Airbnb analytics for Uralla, New South Wales, Australia to uncover income potential. This 2025 STR market report for Uralla, based on AirROI data from April 2024 to March 2025, reveals key trends in the niche market of 18 active listings.
Whether you're considering an Airbnb investment in Uralla, optimizing your existing vacation rental, or exploring rental arbitrage opportunities, understanding the Uralla Airbnb data is crucial. Navigating the high regulation landscape is key to maximizing your short term rental income potential. Let's dive into the specifics.
Key Uralla Airbnb Performance Metrics Overview
Monthly Airbnb Revenue Variations & Income Potential in Uralla (2025)
Understanding the monthly revenue variations for Airbnb listings in Uralla is key to maximizing your short term rental income potential. Seasonality significantly impacts earnings. Our analysis, based on data from the past 12 months, shows that the peak revenue month for STRs in Uralla is typically May, while February often presents the lowest earnings, highlighting opportunities for strategic pricing adjustments during shoulder and low seasons. Explore the typical Airbnb income in Uralla across different performance tiers:
- Best-in-class properties (Top 10%) achieve $3,220+ monthly, often utilizing dynamic pricing and superior guest experiences.
- Strong performing properties (Top 25%) earn $2,628 or more, indicating effective management and desirable locations/amenities.
- Typical properties (Median) generate around $1,925 per month, representing the average market performance.
- Entry-level properties (Bottom 25%) see earnings around $1,508, often with potential for optimization.
Average Monthly Airbnb Earnings Trend in Uralla
Uralla Airbnb Occupancy Rate Trends (2025)
Maximize your bookings by understanding the Uralla STR occupancy trends. Seasonal demand shifts significantly influence how often properties are booked. Typically, Aprilsees the highest demand (peak season occupancy), while February experiences the lowest (low season). Effective strategies, like adjusting minimum stays or offering promotions, can boost occupancy during slower periods. Here's how different property tiers perform in Uralla:
- Best-in-class properties (Top 10%) achieve 78%+ occupancy, indicating high desirability and potentially optimized availability.
- Strong performing properties (Top 25%) maintain 64% or higher occupancy, suggesting good market fit and guest satisfaction.
- Typical properties (Median) have an occupancy rate around 53%.
- Entry-level properties (Bottom 25%) average 41% occupancy, potentially facing higher vacancy.
Average Monthly Occupancy Rate Trend in Uralla
Average Daily Rate (ADR) Airbnb Trends in Uralla (2025)
Effective short term rental pricing strategy in Uralla involves understanding monthly ADR fluctuations. The Average Daily Rate (ADR) for Airbnb in Uralla typically peaks in December and dips lowest during September. Leveraging Airbnb dynamic pricing tools or strategies based on this seasonality can significantly boost revenue. Here's a look at the typical nightly rates achieved:
- Best-in-class properties (Top 10%) command rates of $149+ per night, often due to premium features or locations.
- Strong performing properties (Top 25%) achieve nightly rates of $135 or more.
- Typical properties (Median) charge around $120 per night.
- Entry-level properties (Bottom 25%) earn around $111 per night.
Average Daily Rate (ADR) Trend by Month in Uralla
Get Live Uralla Market Intelligence 👇

Explore Real-time Analytics
Airbnb Seasonality Analysis & Trends in Uralla (2025)
Peak Season (May, April, June)
- Revenue averages $2,806 per month
- Occupancy rates average 63.6%
- Daily rates average $120
Shoulder Season
- Revenue averages $2,033 per month
- Occupancy maintains around 54.5%
- Daily rates hold near $123
Low Season (January, February, March)
- Revenue drops to average $1,312 per month
- Occupancy decreases to average 36.8%
- Daily rates adjust to average $122
Seasonality Insights for Uralla
- The Airbnb seasonality in Uralla shows highly seasonal trends requiring careful strategy. While the sections above show seasonal averages, it's also insightful to look at the extremes:
- During the high season, the absolute peak month showcases Uralla's highest earning potential, with monthly revenues capable of climbing to $2,842, occupancy reaching a high of 65.9%, and ADRs peaking at $127.
- Conversely, the slowest single month of the year, typically falling within the low season, marks the market's lowest point. In this month, revenue might dip to $1,017, occupancy could drop to 32.4%, and ADRs may adjust down to $119.
- Understanding both the seasonal averages and these monthly peaks and troughs in revenue, occupancy, and ADR is crucial for maximizing your Airbnb profit potential in Uralla.
Seasonal Strategies for Maximizing Profit
- Peak Season: Maximize revenue through premium pricing and potentially longer minimum stays. Ensure high availability.
- Low Season: Offer competitive pricing, special promotions (e.g., extended stay discounts), and flexible cancellation policies. Target off-season travelers like remote workers or budget-conscious guests.
- Shoulder Seasons: Implement dynamic pricing that balances peak and low rates. Target weekend travelers or specific events. Offer slightly more flexible terms than peak season.
- Regularly analyze your own performance against these Uralla seasonality benchmarks and adjust your pricing and availability strategy accordingly.
Best Areas for Airbnb Investment in Uralla (2025)
Exploring the top neighborhoods for short-term rentals in Uralla? This section highlights key areas, outlining why they are attractive for hosts and guests, along with notable local attractions. Consider these locations based on your target guest profile and investment strategy.
| Neighborhood / Area | Why Host Here? (Target Guests & Appeal) | Key Attractions & Landmarks |
|---|---|---|
| Uralla Town Centre | The heart of Uralla, with a charming main street, local shops, and easy access to community events. It attracts visitors interested in exploring the history and culture of the region. | Uralla Historical Society, McCrossin's Mill Museum, Uralla Markets, The Uralla Golf Club |
| Mount SOption | A scenic area just outside Uralla, ideal for nature lovers and those seeking peaceful retreats. Offers stunning views and hiking trails, making it popular with outdoor enthusiasts. | Mount Yarrowyck Nature Reserve, Scenic Lookouts, Hiking Trails |
| Pots of Uralla | This new development area offers modern amenities with a rural charm. It appeals to families and those looking for a quieter lifestyle away from the city. | Local Parks, Community Spaces |
| Wollun | A rural locality near Uralla known for its beautiful landscapes and farming community. Ideal for guests looking for agritourism experiences and a taste of country life. | Scenic Drives, Agricultural Tours |
| Thunderbolts Way | A scenic route bordering Uralla, attracting road trippers and nature lovers. Its picturesque views and proximity to other towns make it a good stopover point. | Scenic Lookouts, Picnic Areas |
| Arding | A quiet rural area close to Uralla, perfect for those seeking solitude and escape from urban life. Great for hosting Airbnb retreats or off-grid experiences. | Country Drives, Wildlife Viewing |
| Saumarez Ponds | Known for its natural beauty and peaceful environment, this area offers accommodations that appeal to those looking for a tranquil getaway with views of the ponds and surrounding countryside. | Birdwatching, Nature Trails |
| Rocky River | An area rich in natural resources and history, great for fishing enthusiasts and adventurers looking for unique experiences away from the hustle and bustle. | Fishing Spots, Historical Sites |
Understanding Airbnb License Requirements & STR Laws in Uralla (2025)
Yes, Uralla, New South Wales, Australia enforces high STR regulations. Obtaining a license and ensuring compliance is almost certainly required according to current 2025 STR laws. Always verify the latest short term rental regulations and Airbnb license requirements directly with local government authorities for Uralla to ensure full compliance before hosting.
(Source: AirROI data, 2025, based on 89% licensed listings)
Top Performing Airbnb Properties in Uralla (2025)
Benchmark your potential! Explore examples of top-performing Airbnb properties in Urallabased on Trailing Twelve Month (TTM) revenue. Analyze their characteristics, revenue, occupancy rate, and ADR to understand what drives success in this market.
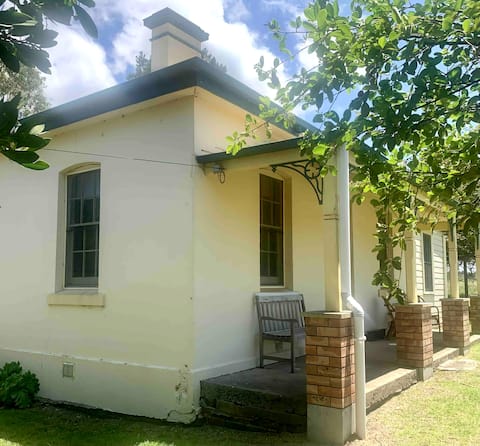
The Gatehouse Uralla
Entire Place • 3 bedrooms
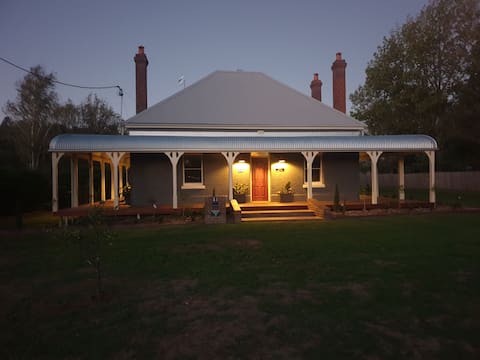
King's Cottage Uralla
Entire Place • 2 bedrooms
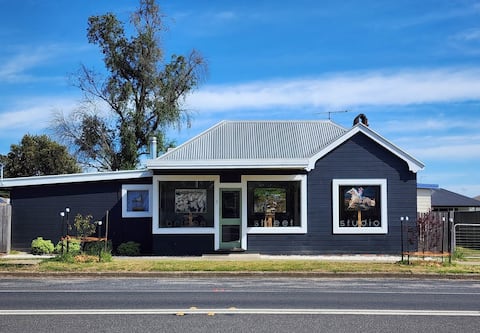
A night at the Art Studio!
Entire Place • 3 bedrooms
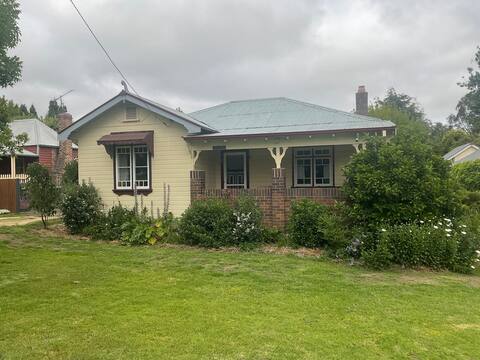
Hillview AirBnB
Entire Place • 3 bedrooms
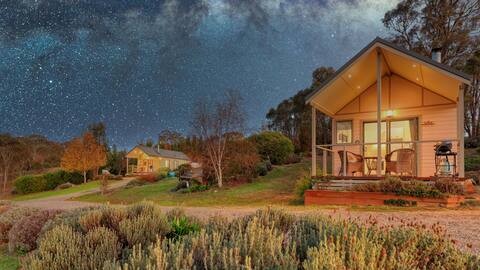
The Bower @ Kings Cottage
Entire Place • 1 bedroom
Grace Cottages
Entire Place • 1 bedroom
Note: Performance varies based on location, size, amenities, seasonality, and management quality. Data reflects the past 12 months.
Top Performing Airbnb Hosts in Uralla (2025)
Learn from the best! This table showcases top-performing Airbnb hosts in Uralla based on the number of properties managed and estimated total revenue over the past year. Analyze their scale and performance metrics.
| Host Name | Properties | Grossing Revenue | Stay Reviews | Avg Rating |
|---|---|---|---|---|
| Daniel | 4 | $64,936 | 31 | 5.00/5.0 |
| Robert | 2 | $63,560 | 335 | 5.00/5.0 |
| Tara | 1 | $36,423 | 87 | 4.95/5.0 |
| Natalie | 2 | $34,403 | 220 | 4.95/5.0 |
| Sophie | 1 | $30,052 | 141 | 4.87/5.0 |
| Helen | 1 | $28,923 | 40 | 5.00/5.0 |
| Gwen | 1 | $27,460 | 26 | 4.96/5.0 |
| Tara | 1 | $25,747 | 149 | 4.97/5.0 |
| Christine | 1 | $21,064 | 345 | 4.98/5.0 |
| Host #280292242 | 1 | $20,227 | 100 | 4.95/5.0 |
Analyzing the strategies of top hosts, such as their property selection, pricing, and guest communication, can offer valuable lessons for optimizing your own Airbnb operations in Uralla.
Dive Deeper: Advanced Uralla STR Market Data (2025)
Ready to unlock more insights? AirROI provides access to advanced metrics and comprehensive Airbnb data for Uralla. Explore detailed analytics beyond this report to refine your investment strategy, optimize pricing, and maximize your vacation rental profits.
Explore Advanced MetricsUralla Short-Term Rental Market Composition (2025): Property & Room Types
Room Type Distribution
Property Type Distribution
Market Composition Insights for Uralla
- The Uralla Airbnb market composition is heavily skewed towards Entire Home/Apt listings, which make up 94.4% of the 18 active rentals. This indicates strong guest preference for privacy and space.
- Looking at the property type distribution in Uralla, House properties are the most common (44.4%), reflecting the local real estate landscape.
- Houses represent a significant 44.4% portion, catering likely to families or larger groups.
- The presence of 16.7% Hotel/Boutique listings indicates integration with traditional hospitality.
Uralla Airbnb Room Capacity Analysis (2025): Bedroom Distribution
Distribution of Listings by Number of Bedrooms
Room Capacity Insights for Uralla
- The dominant room capacity in Uralla is 3 bedrooms listings, making up 44.4% of the market. This suggests a strong demand for properties suitable for families or small groups.
- Together, 3 bedrooms and 1 bedroom properties represent 72.2% of the active Airbnb listings in Uralla, indicating a high concentration in these sizes.
- A significant 44.4% of listings offer 3+ bedrooms, catering to larger groups and families seeking more space in Uralla.
Uralla Vacation Rental Guest Capacity Trends (2025)
Distribution of Listings by Guest Capacity
Guest Capacity Insights for Uralla
- The most common guest capacity trend in Uralla vacation rentals is listings accommodating 6 guests (44.4%). This suggests the primary traveler segment is likely larger groups.
- Properties designed for 6 guests and 2 guests dominate the Uralla STR market, accounting for 77.7% of listings.
- 44.4% of properties accommodate 6+ guests, serving the market segment for larger families or group travel in Uralla.
- On average, properties in Uralla are equipped to host 4.3 guests.
Uralla Airbnb Booking Patterns (2025): Available vs. Booked Days
Available Days Distribution
Booked Days Distribution
Booking Pattern Insights for Uralla
- The most common availability pattern in Uralla falls within the 181-270 days range, representing 55.6% of listings. This suggests many properties have significant open periods on their calendars.
- Approximately 55.6% of listings show high availability (181+ days open annually), indicating potential for increased bookings or specific owner usage patterns.
- For booked days, the 91-180 days range is most frequent in Uralla (55.6%), reflecting common guest stay durations or potential owner blocking patterns.
- A notable 44.5% of properties secure long booking periods (181+ days booked per year), highlighting successful long-term rental strategies or significant owner usage.
Uralla Airbnb Minimum Stay Requirements Analysis
Distribution of Listings by Minimum Night Requirement
1 Night
5 listings
31.3% of total
2 Nights
8 listings
50% of total
3 Nights
1 listings
6.3% of total
4-6 Nights
1 listings
6.3% of total
30+ Nights
1 listings
6.3% of total
Key Insights
- The most prevalent minimum stay requirement in Uralla is 2 Nights, adopted by 50% of listings. This highlights the market's preference for shorter, flexible bookings.
- A strong majority (81.3%) of the Uralla Airbnb data shows acceptance of very short stays (1-2 nights), indicating a dynamic, high-turnover market.
Recommendations
- Align with the market by considering a 2 Nights minimum stay, as 50% of Uralla hosts use this setting.
- Explore offering discounts for stays of 30+ nights to attract the 6.3% of the market seeking extended stays.
- Adjust minimum nights based on seasonality – potentially shorter during low season and longer during peak demand periods in Uralla.
Uralla Airbnb Cancellation Policy Trends Analysis (2025)
Flexible
3 listings
17.6% of total
Moderate
7 listings
41.2% of total
Firm
4 listings
23.5% of total
Strict
3 listings
17.6% of total
Cancellation Policy Insights for Uralla
- The prevailing Airbnb cancellation policy trend in Uralla is Moderate, used by 41.2% of listings.
- There's a relatively balanced mix between guest-friendly (58.8%) and stricter (41.1%) policies, offering choices for different guest needs.
Recommendations for Hosts
- Consider adopting a Moderate policy to align with the 41.2% market standard in Uralla.
- Regularly review your cancellation policy against competitors and market demand shifts in Uralla.
Uralla STR Booking Lead Time Analysis (2025)
Average Booking Lead Time by Month
Booking Lead Time Insights for Uralla
- The overall average booking lead time for vacation rentals in Uralla is 36 days.
- Guests book furthest in advance for stays during September (average 87 days), likely coinciding with peak travel demand or local events.
- The shortest booking windows occur for stays in March (average 29 days), indicating more last-minute travel plans during this time.
- Seasonally, Fall (59 days avg.) sees the longest lead times, while Spring (35 days avg.) has the shortest, reflecting typical travel planning cycles.
Recommendations for Hosts
- Use the overall average lead time (36 days) as a baseline for your pricing and availability strategy in Uralla.
- For September stays, consider implementing length-of-stay discounts or slightly higher rates for bookings made less than 87 days out to capitalize on advance planning.
- Target marketing efforts for the Fall season well in advance (at least 59 days) to capture early planners.
- Monitor your own booking lead times against these Uralla averages to identify opportunities for dynamic pricing adjustments.
Popular & Essential Airbnb Amenities in Uralla (2025)
Amenity Prevalence
Amenity Insights for Uralla
- Essential amenities in Uralla that guests expect include: Hot water, Heating, Essentials, Backyard, Smoke alarm, TV, Hangers, Dishes and silverware. Lacking these (any) could significantly impact bookings.
- Popular amenities like Patio or balcony, Private entrance are common but not universal. Offering these can provide a competitive edge.
Recommendations for Hosts
- Ensure your listing includes all essential amenities for Uralla: Hot water, Heating, Essentials, Backyard, Smoke alarm, TV, Hangers, Dishes and silverware.
- Consider adding popular differentiators like Patio or balcony or Private entrance to increase appeal.
- Highlight unique or less common amenities you offer (e.g., hot tub, dedicated workspace, EV charger) in your listing description and photos.
- Regularly check competitor amenities in Uralla to stay competitive.
Uralla Airbnb Guest Demographics & Profile Analysis (2025)
Guest Profile Summary for Uralla
- The typical guest profile for Airbnb in Uralla consists of primarily domestic travelers (95%), often arriving from nearby New South Wales, typically belonging to the Post-2000s (Gen Z/Alpha) group (50%), primarily speaking English or French.
- Domestic travelers account for 94.7% of guests.
- Key international markets include Australia (94.7%) and United Kingdom (2.7%).
- Top languages spoken are English (78.6%) followed by French (4.3%).
- A significant demographic segment is the Post-2000s (Gen Z/Alpha) group, representing 50% of guests.
Recommendations for Hosts
- Target domestic marketing efforts towards travelers from New South Wales and Sydney.
- Tailor amenities and listing descriptions to appeal to the dominant Post-2000s (Gen Z/Alpha) demographic (e.g., highlight fast WiFi, smart home features, local guides).
- Highlight unique local experiences or amenities relevant to the primary guest profile.
- Consider seasonal promotions aligned with peak travel times for key origin markets.
Nearby Short-Term Rental Market Comparison
How does the Uralla Airbnb market stack up against its neighbors? Compare key performance metrics like average monthly revenue, ADR, and occupancy rates in surrounding areas to understand the broader regional STR landscape.
| Market | Active Properties | Monthly Revenue | Daily Rate | Avg. Occupancy |
|---|---|---|---|---|
| Gleniffer | 35 | $2,650 | $341.78 | 35% |
| Tamworth | 136 | $2,554 | $198.77 | 48% |
| Bellingen Shire Council | 12 | $2,501 | $167.38 | 47% |
| Tenterfield | 42 | $2,382 | $194.65 | 40% |
| Gunnedah | 14 | $2,313 | $162.10 | 53% |
| Armidale | 83 | $2,217 | $134.83 | 57% |
| Port Macquarie | 388 | $2,189 | $193.47 | 45% |
| Glen Innes | 20 | $1,984 | $138.06 | 42% |
| Harrington | 29 | $1,959 | $217.32 | 36% |
| Bellingen | 100 | $1,956 | $160.37 | 44% |