Tenterfield Airbnb Market Analysis 2025: Short Term Rental Data & Vacation Rental Statistics in New South Wales, Australia
Is Airbnb profitable in Tenterfield in 2025? Explore comprehensive Airbnb analytics for Tenterfield, New South Wales, Australia to uncover income potential. This 2025 STR market report for Tenterfield, based on AirROI data from April 2024 to March 2025, reveals key trends in the niche market of 42 active listings.
Whether you're considering an Airbnb investment in Tenterfield, optimizing your existing vacation rental, or exploring rental arbitrage opportunities, understanding the Tenterfield Airbnb data is crucial. Navigating the high regulation landscape is key to maximizing your short term rental income potential. Let's dive into the specifics.
Key Tenterfield Airbnb Performance Metrics Overview
Monthly Airbnb Revenue Variations & Income Potential in Tenterfield (2025)
Understanding the monthly revenue variations for Airbnb listings in Tenterfield is key to maximizing your short term rental income potential. Seasonality significantly impacts earnings. Our analysis, based on data from the past 12 months, shows that the peak revenue month for STRs in Tenterfield is typically June, while March often presents the lowest earnings, highlighting opportunities for strategic pricing adjustments during shoulder and low seasons. Explore the typical Airbnb income in Tenterfield across different performance tiers:
- Best-in-class properties (Top 10%) achieve $4,639+ monthly, often utilizing dynamic pricing and superior guest experiences.
- Strong performing properties (Top 25%) earn $3,494 or more, indicating effective management and desirable locations/amenities.
- Typical properties (Median) generate around $2,116 per month, representing the average market performance.
- Entry-level properties (Bottom 25%) see earnings around $1,123, often with potential for optimization.
Average Monthly Airbnb Earnings Trend in Tenterfield
Tenterfield Airbnb Occupancy Rate Trends (2025)
Maximize your bookings by understanding the Tenterfield STR occupancy trends. Seasonal demand shifts significantly influence how often properties are booked. Typically, Julysees the highest demand (peak season occupancy), while March experiences the lowest (low season). Effective strategies, like adjusting minimum stays or offering promotions, can boost occupancy during slower periods. Here's how different property tiers perform in Tenterfield:
- Best-in-class properties (Top 10%) achieve 74%+ occupancy, indicating high desirability and potentially optimized availability.
- Strong performing properties (Top 25%) maintain 54% or higher occupancy, suggesting good market fit and guest satisfaction.
- Typical properties (Median) have an occupancy rate around 36%.
- Entry-level properties (Bottom 25%) average 19% occupancy, potentially facing higher vacancy.
Average Monthly Occupancy Rate Trend in Tenterfield
Average Daily Rate (ADR) Airbnb Trends in Tenterfield (2025)
Effective short term rental pricing strategy in Tenterfield involves understanding monthly ADR fluctuations. The Average Daily Rate (ADR) for Airbnb in Tenterfield typically peaks in November and dips lowest during April. Leveraging Airbnb dynamic pricing tools or strategies based on this seasonality can significantly boost revenue. Here's a look at the typical nightly rates achieved:
- Best-in-class properties (Top 10%) command rates of $284+ per night, often due to premium features or locations.
- Strong performing properties (Top 25%) achieve nightly rates of $227 or more.
- Typical properties (Median) charge around $178 per night.
- Entry-level properties (Bottom 25%) earn around $128 per night.
Average Daily Rate (ADR) Trend by Month in Tenterfield
Get Live Tenterfield Market Intelligence 👇

Explore Real-time Analytics
Airbnb Seasonality Analysis & Trends in Tenterfield (2025)
Peak Season (June, April, July)
- Revenue averages $3,439 per month
- Occupancy rates average 45.4%
- Daily rates average $190
Shoulder Season
- Revenue averages $2,438 per month
- Occupancy maintains around 38.4%
- Daily rates hold near $192
Low Season (February, March, November)
- Revenue drops to average $1,710 per month
- Occupancy decreases to average 32.9%
- Daily rates adjust to average $194
Seasonality Insights for Tenterfield
- The Airbnb seasonality in Tenterfield shows highly seasonal trends requiring careful strategy. While the sections above show seasonal averages, it's also insightful to look at the extremes:
- During the high season, the absolute peak month showcases Tenterfield's highest earning potential, with monthly revenues capable of climbing to $3,468, occupancy reaching a high of 53.0%, and ADRs peaking at $203.
- Conversely, the slowest single month of the year, typically falling within the low season, marks the market's lowest point. In this month, revenue might dip to $1,627, occupancy could drop to 31.0%, and ADRs may adjust down to $188.
- Understanding both the seasonal averages and these monthly peaks and troughs in revenue, occupancy, and ADR is crucial for maximizing your Airbnb profit potential in Tenterfield.
Seasonal Strategies for Maximizing Profit
- Peak Season: Maximize revenue through premium pricing and potentially longer minimum stays. Ensure high availability.
- Low Season: Offer competitive pricing, special promotions (e.g., extended stay discounts), and flexible cancellation policies. Target off-season travelers like remote workers or budget-conscious guests.
- Shoulder Seasons: Implement dynamic pricing that balances peak and low rates. Target weekend travelers or specific events. Offer slightly more flexible terms than peak season.
- Regularly analyze your own performance against these Tenterfield seasonality benchmarks and adjust your pricing and availability strategy accordingly.
Best Areas for Airbnb Investment in Tenterfield (2025)
Exploring the top neighborhoods for short-term rentals in Tenterfield? This section highlights key areas, outlining why they are attractive for hosts and guests, along with notable local attractions. Consider these locations based on your target guest profile and investment strategy.
| Neighborhood / Area | Why Host Here? (Target Guests & Appeal) | Key Attractions & Landmarks |
|---|---|---|
| Tenterfield Town Centre | The heart of Tenterfield, with easy access to shops, restaurants, and local attractions. A prime location for visitors looking to explore the historical aspects of the town, including its heritage buildings. | Tenterfield Railway Station, Stannum House, Tenterfield Star Hotel, Tenterfield Historic Courthouse, Sir Henry Parkes School of Arts |
| Bald Rock National Park | A stunning natural reserve that attracts nature lovers and outdoor adventurers. Ideal for guests seeking hiking, picnicking, and breathtaking views atop the massive granite rock. | Bald Rock, Walking trails, Scenic viewpoints, Camping grounds |
| Mount Mackenzie | A beautiful scenic spot perfect for camping and hiking enthusiasts, offering great views and a peaceful retreat. It appeals to eco-tourists and those wanting a nature-filled getaway. | Walking trails, Picnic areas, Scenic lookouts |
| Milly Hill Gallery | A unique location for those interested in local art and culture. This area offers an artsy vibe and hosts various cultural events and exhibitions, attracting art lovers. | Art exhibitions, Workshops, Local craft shops |
| The Tenterfield School of Arts | A historical venue for events and cultural activities, it attracts both tourists and locals for gatherings. Great for those interested in the region's arts scene. | Theatre performances, Art exhibitions, Community events |
| Tenterfield Golf Club | A relaxed and scenic spot where visitors can enjoy golf in a beautiful setting. Ideal for golf enthusiasts or those looking to unwind in nature. | Golf course, Clubhouse, Scenic views |
| Heritage Park | A new development area that combines modern amenities with historical features, appealing to families and tourists seeking comfortable accommodation close to attractions. | Playgrounds, Walking paths, Historical displays |
| Cedar Grove | Located just outside Tenterfield, this area is popular for its cozy rural charm and close proximity to nature reserves, making it perfect for those seeking tranquility. | Nature trails, Rural scenery, Quiet retreat locations |
Understanding Airbnb License Requirements & STR Laws in Tenterfield (2025)
Yes, Tenterfield, New South Wales, Australia enforces high STR regulations. Obtaining a license and ensuring compliance is almost certainly required according to current 2025 STR laws. Always verify the latest short term rental regulations and Airbnb license requirements directly with local government authorities for Tenterfield to ensure full compliance before hosting.
(Source: AirROI data, 2025, based on 93% licensed listings)
Top Performing Airbnb Properties in Tenterfield (2025)
Benchmark your potential! Explore examples of top-performing Airbnb properties in Tenterfieldbased on Trailing Twelve Month (TTM) revenue. Analyze their characteristics, revenue, occupancy rate, and ADR to understand what drives success in this market.

The Shouse, Views, Spa, Pool Table, Spacious
Entire Place • 4 bedrooms
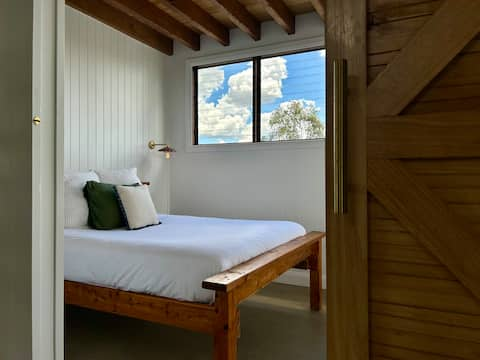
The Barn Farm Stay
Entire Place • 2 bedrooms
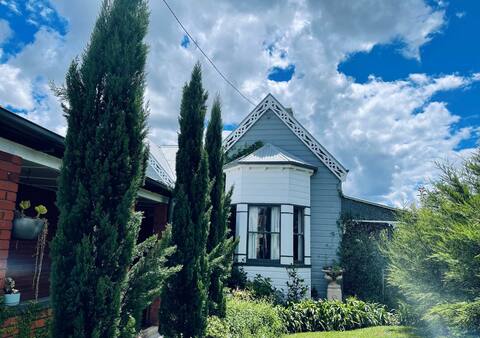
The Country House and Cottage | 14 Guests
Entire Place • 5 bedrooms
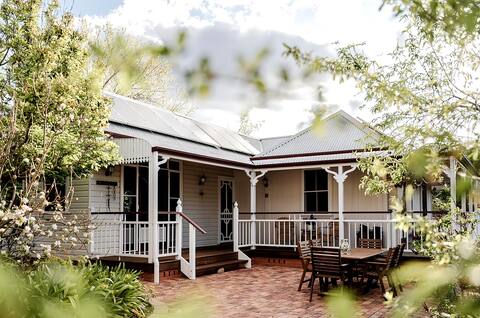
Sylvan Cottage, simple elegance, well located
Entire Place • 3 bedrooms
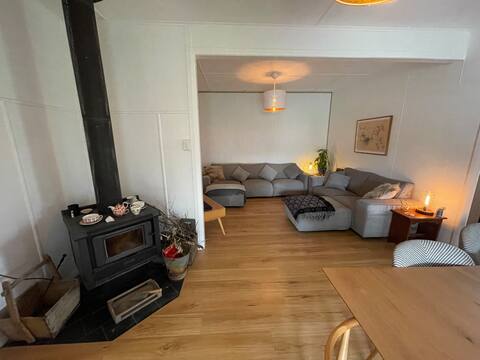
Blue Maple Tenterfield Modern Farm House
Entire Place • 3 bedrooms
Comerford Hall B & B Tenterfield
Entire Place • 1 bedroom
Note: Performance varies based on location, size, amenities, seasonality, and management quality. Data reflects the past 12 months.
Top Performing Airbnb Hosts in Tenterfield (2025)
Learn from the best! This table showcases top-performing Airbnb hosts in Tenterfield based on the number of properties managed and estimated total revenue over the past year. Analyze their scale and performance metrics.
| Host Name | Properties | Grossing Revenue | Stay Reviews | Avg Rating |
|---|---|---|---|---|
| Juju | 4 | $118,513 | 314 | 4.78/5.0 |
| Bek | 3 | $115,842 | 66 | 4.99/5.0 |
| Tenterfield Lodge | 5 | $97,629 | 277 | 4.67/5.0 |
| Coco & Daniel | 2 | $87,092 | 169 | 4.80/5.0 |
| Tim | 5 | $65,832 | 36 | 4.75/5.0 |
| Peter And Robyn | 1 | $57,938 | 27 | 4.96/5.0 |
| Paul | 1 | $57,259 | 84 | 5.00/5.0 |
| Anne & Chris | 1 | $55,019 | 239 | 4.95/5.0 |
| Cathryn | 1 | $47,356 | 36 | 4.92/5.0 |
| Karli | 2 | $45,590 | 29 | 4.84/5.0 |
Analyzing the strategies of top hosts, such as their property selection, pricing, and guest communication, can offer valuable lessons for optimizing your own Airbnb operations in Tenterfield.
Dive Deeper: Advanced Tenterfield STR Market Data (2025)
Ready to unlock more insights? AirROI provides access to advanced metrics and comprehensive Airbnb data for Tenterfield. Explore detailed analytics beyond this report to refine your investment strategy, optimize pricing, and maximize your vacation rental profits.
Explore Advanced MetricsTenterfield Short-Term Rental Market Composition (2025): Property & Room Types
Room Type Distribution
Property Type Distribution
Market Composition Insights for Tenterfield
- The Tenterfield Airbnb market composition is heavily skewed towards Entire Home/Apt listings, which make up 83.3% of the 42 active rentals. This indicates strong guest preference for privacy and space.
- Looking at the property type distribution in Tenterfield, House properties are the most common (52.4%), reflecting the local real estate landscape.
- Houses represent a significant 52.4% portion, catering likely to families or larger groups.
- The presence of 19% Hotel/Boutique listings indicates integration with traditional hospitality.
- Smaller segments like apartment/condo, unique stays (combined 7.2%) offer potential for unique stay experiences.
Tenterfield Airbnb Room Capacity Analysis (2025): Bedroom Distribution
Distribution of Listings by Number of Bedrooms
Room Capacity Insights for Tenterfield
- The dominant room capacity in Tenterfield is 1 bedroom listings, making up 42.9% of the market. This suggests a strong demand for properties suitable for couples or solo travelers.
- Together, 1 bedroom and 3 bedrooms properties represent 61.9% of the active Airbnb listings in Tenterfield, indicating a high concentration in these sizes.
- A significant 35.7% of listings offer 3+ bedrooms, catering to larger groups and families seeking more space in Tenterfield.
Tenterfield Vacation Rental Guest Capacity Trends (2025)
Distribution of Listings by Guest Capacity
Guest Capacity Insights for Tenterfield
- The most common guest capacity trend in Tenterfield vacation rentals is listings accommodating 2 guests (31%). This suggests the primary traveler segment is likely couples or solo travelers.
- Properties designed for 2 guests and 4 guests dominate the Tenterfield STR market, accounting for 50.0% of listings.
- 31.0% of properties accommodate 6+ guests, serving the market segment for larger families or group travel in Tenterfield.
- On average, properties in Tenterfield are equipped to host 4.4 guests.
Tenterfield Airbnb Booking Patterns (2025): Available vs. Booked Days
Available Days Distribution
Booked Days Distribution
Booking Pattern Insights for Tenterfield
- The most common availability pattern in Tenterfield falls within the 91-180 days range, representing 35.7% of listings. This suggests many properties have significant open periods on their calendars.
- Approximately 59.5% of listings show high availability (181+ days open annually), indicating potential for increased bookings or specific owner usage patterns.
- For booked days, the 181-270 days range is most frequent in Tenterfield (35.7%), reflecting common guest stay durations or potential owner blocking patterns.
- A notable 40.5% of properties secure long booking periods (181+ days booked per year), highlighting successful long-term rental strategies or significant owner usage.
Tenterfield Airbnb Minimum Stay Requirements Analysis
Distribution of Listings by Minimum Night Requirement
1 Night
11 listings
27.5% of total
2 Nights
15 listings
37.5% of total
4-6 Nights
1 listings
2.5% of total
7-29 Nights
1 listings
2.5% of total
30+ Nights
12 listings
30% of total
Key Insights
- The most prevalent minimum stay requirement in Tenterfield is 2 Nights, adopted by 37.5% of listings. This highlights the market's preference for shorter, flexible bookings.
- A strong majority (65.0%) of the Tenterfield Airbnb data shows acceptance of very short stays (1-2 nights), indicating a dynamic, high-turnover market.
- A significant segment (30%) caters to monthly stays (30+ nights) in Tenterfield, pointing to opportunities in the extended-stay market.
Recommendations
- Align with the market by considering a 2 Nights minimum stay, as 37.5% of Tenterfield hosts use this setting.
- If feasible, allowing 1-night stays, especially midweek or during low season, could capture last-minute bookings, as only 27.5% currently do.
- Explore offering discounts for stays of 30+ nights to attract the 30% of the market seeking extended stays.
- Adjust minimum nights based on seasonality – potentially shorter during low season and longer during peak demand periods in Tenterfield.
Tenterfield Airbnb Cancellation Policy Trends Analysis (2025)
Flexible
6 listings
14.3% of total
Moderate
12 listings
28.6% of total
Firm
10 listings
23.8% of total
Strict
14 listings
33.3% of total
Cancellation Policy Insights for Tenterfield
- The prevailing Airbnb cancellation policy trend in Tenterfield is Strict, used by 33.3% of listings.
- A majority (57.1%) of hosts in Tenterfield utilize Firm or Strict policies, indicating a market where hosts prioritize booking security.
Recommendations for Hosts
- Consider adopting a Strict policy to align with the 33.3% market standard in Tenterfield.
- With 33.3% using Strict terms, this is a viable option in Tenterfield, particularly for high-value properties or during peak demand periods.
- Regularly review your cancellation policy against competitors and market demand shifts in Tenterfield.
Tenterfield STR Booking Lead Time Analysis (2025)
Average Booking Lead Time by Month
Booking Lead Time Insights for Tenterfield
- The overall average booking lead time for vacation rentals in Tenterfield is 42 days.
- Guests book furthest in advance for stays during February (average 69 days), likely coinciding with peak travel demand or local events.
- The shortest booking windows occur for stays in January (average 24 days), indicating more last-minute travel plans during this time.
- Seasonally, Spring (51 days avg.) sees the longest lead times, while Winter (44 days avg.) has the shortest, reflecting typical travel planning cycles.
Recommendations for Hosts
- Use the overall average lead time (42 days) as a baseline for your pricing and availability strategy in Tenterfield.
- For February stays, consider implementing length-of-stay discounts or slightly higher rates for bookings made less than 69 days out to capitalize on advance planning.
- Target marketing efforts for the Spring season well in advance (at least 51 days) to capture early planners.
- Monitor your own booking lead times against these Tenterfield averages to identify opportunities for dynamic pricing adjustments.
Popular & Essential Airbnb Amenities in Tenterfield (2025)
Amenity Prevalence
Amenity Insights for Tenterfield
- Essential amenities in Tenterfield that guests expect include: Smoke alarm, TV, Free parking on premises. Lacking these (any) could significantly impact bookings.
- Popular amenities like Essentials, Wifi, Heating are common but not universal. Offering these can provide a competitive edge.
- Warning: Wifi is not universally provided but is considered essential globally. Ensure reliable Wifi is offered.
Recommendations for Hosts
- Ensure your listing includes all essential amenities for Tenterfield: Smoke alarm, TV, Free parking on premises.
- Prioritize adding missing essentials: TV, Free parking on premises.
- Consider adding popular differentiators like Essentials or Wifi to increase appeal.
- Highlight unique or less common amenities you offer (e.g., hot tub, dedicated workspace, EV charger) in your listing description and photos.
- Regularly check competitor amenities in Tenterfield to stay competitive.
Tenterfield Airbnb Guest Demographics & Profile Analysis (2025)
Guest Profile Summary for Tenterfield
- The typical guest profile for Airbnb in Tenterfield consists of primarily domestic travelers (95%), often arriving from nearby Brisbane, typically belonging to the Post-2000s (Gen Z/Alpha) group (50%), primarily speaking English or German.
- Domestic travelers account for 95.3% of guests.
- Key international markets include Australia (95.3%) and United Kingdom (2.1%).
- Top languages spoken are English (76.9%) followed by German (3.9%).
- A significant demographic segment is the Post-2000s (Gen Z/Alpha) group, representing 50% of guests.
Recommendations for Hosts
- Target domestic marketing efforts towards travelers from Brisbane and Queensland.
- Tailor amenities and listing descriptions to appeal to the dominant Post-2000s (Gen Z/Alpha) demographic (e.g., highlight fast WiFi, smart home features, local guides).
- Highlight unique local experiences or amenities relevant to the primary guest profile.
- Consider seasonal promotions aligned with peak travel times for key origin markets.
Nearby Short-Term Rental Market Comparison
How does the Tenterfield Airbnb market stack up against its neighbors? Compare key performance metrics like average monthly revenue, ADR, and occupancy rates in surrounding areas to understand the broader regional STR landscape.
| Market | Active Properties | Monthly Revenue | Daily Rate | Avg. Occupancy |
|---|---|---|---|---|
| Byron Bay | 952 | $4,207 | $425.18 | 43% |
| Byron Shire Council | 206 | $3,945 | $428.48 | 42% |
| Ewingsdale | 67 | $3,804 | $487.49 | 37% |
| Kingscliff | 336 | $3,683 | $376.49 | 41% |
| Casuarina Beach | 138 | $3,646 | $407.62 | 42% |
| Clunes | 18 | $3,531 | $285.32 | 41% |
| Uki | 14 | $3,492 | $275.12 | 40% |
| Gold Coast City | 5,526 | $3,362 | $265.25 | 51% |
| Bogangar | 117 | $3,299 | $350.07 | 42% |
| Suffolk Park | 188 | $3,161 | $375.75 | 46% |