Tamworth Regional Council Airbnb Market Analysis 2025: Short Term Rental Data & Vacation Rental Statistics in New South Wales, Australia
Is Airbnb profitable in Tamworth Regional Council in 2025? Explore comprehensive Airbnb analytics for Tamworth Regional Council, New South Wales, Australia to uncover income potential. This 2025 STR market report for Tamworth Regional Council, based on AirROI data from April 2024 to March 2025, reveals key trends in the niche market of 23 active listings.
Whether you're considering an Airbnb investment in Tamworth Regional Council, optimizing your existing vacation rental, or exploring rental arbitrage opportunities, understanding the Tamworth Regional Council Airbnb data is crucial. Navigating the high regulation landscape is key to maximizing your short term rental income potential. Let's dive into the specifics.
Key Tamworth Regional Council Airbnb Performance Metrics Overview
Monthly Airbnb Revenue Variations & Income Potential in Tamworth Regional Council (2025)
Understanding the monthly revenue variations for Airbnb listings in Tamworth Regional Council is key to maximizing your short term rental income potential. Seasonality significantly impacts earnings. Our analysis, based on data from the past 12 months, shows that the peak revenue month for STRs in Tamworth Regional Council is typically July, while September often presents the lowest earnings, highlighting opportunities for strategic pricing adjustments during shoulder and low seasons. Explore the typical Airbnb income in Tamworth Regional Council across different performance tiers:
- Best-in-class properties (Top 10%) achieve $4,134+ monthly, often utilizing dynamic pricing and superior guest experiences.
- Strong performing properties (Top 25%) earn $2,730 or more, indicating effective management and desirable locations/amenities.
- Typical properties (Median) generate around $1,891 per month, representing the average market performance.
- Entry-level properties (Bottom 25%) see earnings around $1,082, often with potential for optimization.
Average Monthly Airbnb Earnings Trend in Tamworth Regional Council
Tamworth Regional Council Airbnb Occupancy Rate Trends (2025)
Maximize your bookings by understanding the Tamworth Regional Council STR occupancy trends. Seasonal demand shifts significantly influence how often properties are booked. Typically, Julysees the highest demand (peak season occupancy), while September experiences the lowest (low season). Effective strategies, like adjusting minimum stays or offering promotions, can boost occupancy during slower periods. Here's how different property tiers perform in Tamworth Regional Council:
- Best-in-class properties (Top 10%) achieve 85%+ occupancy, indicating high desirability and potentially optimized availability.
- Strong performing properties (Top 25%) maintain 68% or higher occupancy, suggesting good market fit and guest satisfaction.
- Typical properties (Median) have an occupancy rate around 46%.
- Entry-level properties (Bottom 25%) average 25% occupancy, potentially facing higher vacancy.
Average Monthly Occupancy Rate Trend in Tamworth Regional Council
Average Daily Rate (ADR) Airbnb Trends in Tamworth Regional Council (2025)
Effective short term rental pricing strategy in Tamworth Regional Council involves understanding monthly ADR fluctuations. The Average Daily Rate (ADR) for Airbnb in Tamworth Regional Council typically peaks in January and dips lowest during April. Leveraging Airbnb dynamic pricing tools or strategies based on this seasonality can significantly boost revenue. Here's a look at the typical nightly rates achieved:
- Best-in-class properties (Top 10%) command rates of $197+ per night, often due to premium features or locations.
- Strong performing properties (Top 25%) achieve nightly rates of $178 or more.
- Typical properties (Median) charge around $136 per night.
- Entry-level properties (Bottom 25%) earn around $86 per night.
Average Daily Rate (ADR) Trend by Month in Tamworth Regional Council
Get Live Tamworth Regional Council Market Intelligence 👇

Explore Real-time Analytics
Airbnb Seasonality Analysis & Trends in Tamworth Regional Council (2025)
Peak Season (July, January, May)
- Revenue averages $2,475 per month
- Occupancy rates average 51.3%
- Daily rates average $135
Shoulder Season
- Revenue averages $2,166 per month
- Occupancy maintains around 48.3%
- Daily rates hold near $134
Low Season (February, September, November)
- Revenue drops to average $1,530 per month
- Occupancy decreases to average 42.9%
- Daily rates adjust to average $137
Seasonality Insights for Tamworth Regional Council
- The Airbnb seasonality in Tamworth Regional Council shows moderate seasonality with distinct peak and low periods. While the sections above show seasonal averages, it's also insightful to look at the extremes:
- During the high season, the absolute peak month showcases Tamworth Regional Council's highest earning potential, with monthly revenues capable of climbing to $2,532, occupancy reaching a high of 58.3%, and ADRs peaking at $145.
- Conversely, the slowest single month of the year, typically falling within the low season, marks the market's lowest point. In this month, revenue might dip to $1,414, occupancy could drop to 39.1%, and ADRs may adjust down to $128.
- Understanding both the seasonal averages and these monthly peaks and troughs in revenue, occupancy, and ADR is crucial for maximizing your Airbnb profit potential in Tamworth Regional Council.
Seasonal Strategies for Maximizing Profit
- Peak Season: Maximize revenue through premium pricing and potentially longer minimum stays. Ensure high availability.
- Low Season: Offer competitive pricing, special promotions (e.g., extended stay discounts), and flexible cancellation policies. Target off-season travelers like remote workers or budget-conscious guests.
- Shoulder Seasons: Implement dynamic pricing that balances peak and low rates. Target weekend travelers or specific events. Offer slightly more flexible terms than peak season.
- Regularly analyze your own performance against these Tamworth Regional Council seasonality benchmarks and adjust your pricing and availability strategy accordingly.
Best Areas for Airbnb Investment in Tamworth Regional Council (2025)
Exploring the top neighborhoods for short-term rentals in Tamworth Regional Council? This section highlights key areas, outlining why they are attractive for hosts and guests, along with notable local attractions. Consider these locations based on your target guest profile and investment strategy.
| Neighborhood / Area | Why Host Here? (Target Guests & Appeal) | Key Attractions & Landmarks |
|---|---|---|
| Tamworth City | The central hub of the region known for its music festivals and vibrant cultural scene. It attracts tourists year-round for events and local attractions. | Tamworth Country Music Festival, Big Golden Guitar, Tamworth Regional Gallery, Botanic Gardens Tamworth, New England Regional Art Museum |
| Kootingal | A small but charming village just outside of Tamworth, offering a quieter, rural experience while still being close to the city attractions. | Kootingal Village Park, Historic Kootingal, Nearby hiking trails, Local craft shops, Peaceful rural settings |
| Manilla | A picturesque town on the banks of the Namoi River, known for outdoor activities and natural beauty, appealing to nature lovers and adventure seekers. | Namoi River, Manilla Historical Museum, Local fishing spots, Nature walks, Scenic picnic areas |
| Nundle | A historic gold mining town that offers a glimpse into the past with stunning landscapes, well-preserved buildings, and a peaceful atmosphere. | Nundle Woollen Mill, Nundle Gold Mine, Historic buildings, Bushwalking trails, Local craft markets |
| Gunnedah | Another regional city with a strong agricultural background, offering unique experiences related to farming and local community events. | Gunnedah Wildlife Park, Kookaburra Park, Local agricultural shows, Gunnedah Heritage Centre, Outdoor recreation areas |
| Werris Creek | A small town rich in history and railway heritage, appealing to history buffs and those looking for a unique cultural short stay. | Werris Creek Railway Museum, Historic buildings, Local parks, Railway heritage walks, Community events |
| Barraba | This small rural town is known for its outdoor recreational activities and lovely scenery, perfect for those looking for a peaceful getaway. | Barraba Art Gallery, Local fishing spots, Hiking trails in nature, Barraba Heritage Walk, Small community events |
| Wallabadah | A rural village that offers a true Aussie countryside experience, ideal for those wanting to escape the urban hustle and enjoy nature. | Local farming, Nature reserves, Scenic countryside views, Community markets, Outdoor sports |
Understanding Airbnb License Requirements & STR Laws in Tamworth Regional Council (2025)
Yes, Tamworth Regional Council, New South Wales, Australia enforces high STR regulations. Obtaining a license and ensuring compliance is almost certainly required according to current 2025 STR laws. Always verify the latest short term rental regulations and Airbnb license requirements directly with local government authorities for Tamworth Regional Council to ensure full compliance before hosting.
(Source: AirROI data, 2025, based on 87% licensed listings)
Top Performing Airbnb Properties in Tamworth Regional Council (2025)
Benchmark your potential! Explore examples of top-performing Airbnb properties in Tamworth Regional Councilbased on Trailing Twelve Month (TTM) revenue. Analyze their characteristics, revenue, occupancy rate, and ADR to understand what drives success in this market.

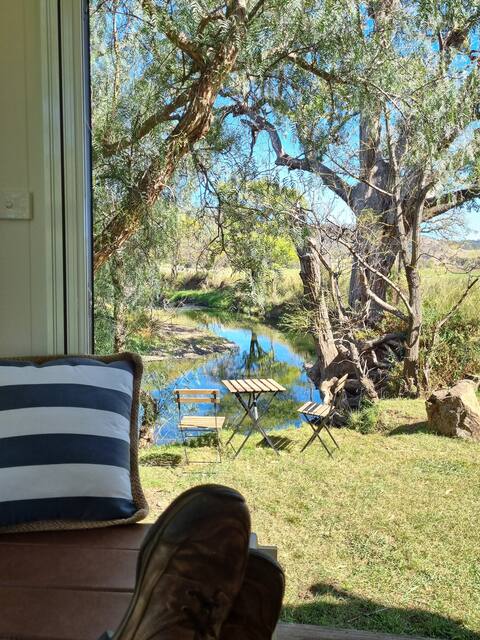
Pure Country Style
Entire Place • 3 bedrooms
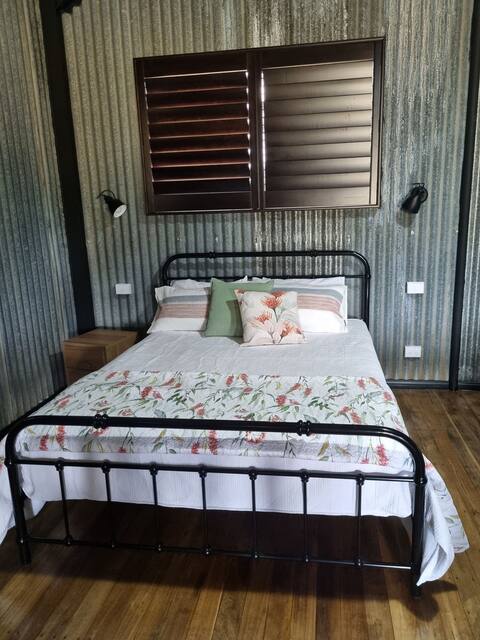
Dungowan Station 1834 "Blue Hole Bend Tiny Home"
Entire Place • 1 bedroom

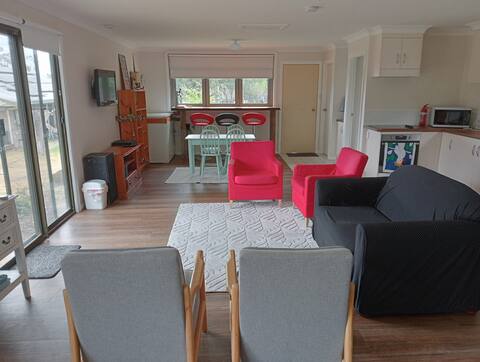
'AMAROO' Guesthouse Goonoo Goonoo Tamworth
Entire Place • 2 bedrooms
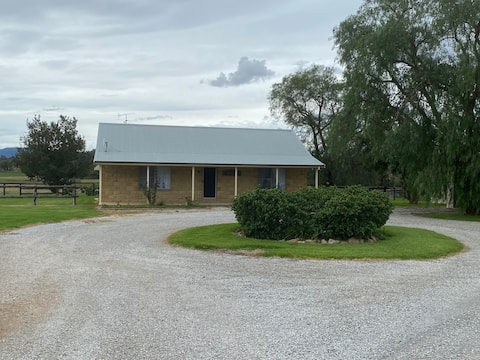
Converted Shearing Shed
Entire Place • 1 bedroom
Rural Retreat
Entire Place • 1 bedroom
Rural Paradise- minutes from town
Entire Place • 2 bedrooms
Note: Performance varies based on location, size, amenities, seasonality, and management quality. Data reflects the past 12 months.
Top Performing Airbnb Hosts in Tamworth Regional Council (2025)
Learn from the best! This table showcases top-performing Airbnb hosts in Tamworth Regional Council based on the number of properties managed and estimated total revenue over the past year. Analyze their scale and performance metrics.
| Host Name | Properties | Grossing Revenue | Stay Reviews | Avg Rating |
|---|---|---|---|---|
| Campbell | 6 | $110,528 | 191 | 4.86/5.0 |
| Marie | 1 | $41,469 | 6 | 5.00/5.0 |
| Sue | 1 | $35,817 | 124 | 5.00/5.0 |
| Phoebe | 1 | $30,258 | 4 | 5.00/5.0 |
| Mark | 1 | $29,559 | 14 | 4.86/5.0 |
| Angie | 1 | $29,461 | 167 | 4.96/5.0 |
| Emily | 1 | $25,510 | 84 | 4.94/5.0 |
| Karen | 2 | $24,243 | 149 | 5.00/5.0 |
| Susie | 3 | $21,510 | 221 | 4.61/5.0 |
| Joanne | 1 | $20,732 | 191 | 4.83/5.0 |
Analyzing the strategies of top hosts, such as their property selection, pricing, and guest communication, can offer valuable lessons for optimizing your own Airbnb operations in Tamworth Regional Council.
Dive Deeper: Advanced Tamworth Regional Council STR Market Data (2025)
Ready to unlock more insights? AirROI provides access to advanced metrics and comprehensive Airbnb data for Tamworth Regional Council. Explore detailed analytics beyond this report to refine your investment strategy, optimize pricing, and maximize your vacation rental profits.
Explore Advanced MetricsTamworth Regional Council Short-Term Rental Market Composition (2025): Property & Room Types
Room Type Distribution
Property Type Distribution
Market Composition Insights for Tamworth Regional Council
- The Tamworth Regional Council Airbnb market composition is heavily skewed towards Entire Home/Apt listings, which make up 82.6% of the 23 active rentals. This indicates strong guest preference for privacy and space.
- Looking at the property type distribution in Tamworth Regional Council, House properties are the most common (52.2%), reflecting the local real estate landscape.
- Houses represent a significant 52.2% portion, catering likely to families or larger groups.
- The presence of 17.4% Hotel/Boutique listings indicates integration with traditional hospitality.
Tamworth Regional Council Airbnb Room Capacity Analysis (2025): Bedroom Distribution
Distribution of Listings by Number of Bedrooms
Room Capacity Insights for Tamworth Regional Council
- The dominant room capacity in Tamworth Regional Council is 1 bedroom listings, making up 43.5% of the market. This suggests a strong demand for properties suitable for couples or solo travelers.
- Together, 1 bedroom and 2 bedrooms properties represent 69.6% of the active Airbnb listings in Tamworth Regional Council, indicating a high concentration in these sizes.
Tamworth Regional Council Vacation Rental Guest Capacity Trends (2025)
Distribution of Listings by Guest Capacity
Guest Capacity Insights for Tamworth Regional Council
- The most common guest capacity trend in Tamworth Regional Council vacation rentals is listings accommodating 2 guests (34.8%). This suggests the primary traveler segment is likely couples or solo travelers.
- Properties designed for 2 guests and 4 guests dominate the Tamworth Regional Council STR market, accounting for 56.5% of listings.
- 26.0% of properties accommodate 6+ guests, serving the market segment for larger families or group travel in Tamworth Regional Council.
- On average, properties in Tamworth Regional Council are equipped to host 3.2 guests.
Tamworth Regional Council Airbnb Booking Patterns (2025): Available vs. Booked Days
Available Days Distribution
Booked Days Distribution
Booking Pattern Insights for Tamworth Regional Council
- The most common availability pattern in Tamworth Regional Council falls within the 271-366 days range, representing 39.1% of listings. This suggests many properties have significant open periods on their calendars.
- Approximately 69.5% of listings show high availability (181+ days open annually), indicating potential for increased bookings or specific owner usage patterns.
- For booked days, the 91-180 days range is most frequent in Tamworth Regional Council (34.8%), reflecting common guest stay durations or potential owner blocking patterns.
- A notable 34.8% of properties secure long booking periods (181+ days booked per year), highlighting successful long-term rental strategies or significant owner usage.
Tamworth Regional Council Airbnb Minimum Stay Requirements Analysis
Distribution of Listings by Minimum Night Requirement
1 Night
11 listings
55% of total
2 Nights
5 listings
25% of total
30+ Nights
4 listings
20% of total
Key Insights
- The most prevalent minimum stay requirement in Tamworth Regional Council is 1 Night, adopted by 55% of listings. This highlights the market's preference for shorter, flexible bookings.
- A strong majority (80.0%) of the Tamworth Regional Council Airbnb data shows acceptance of very short stays (1-2 nights), indicating a dynamic, high-turnover market.
- A significant segment (20%) caters to monthly stays (30+ nights) in Tamworth Regional Council, pointing to opportunities in the extended-stay market.
Recommendations
- Align with the market by considering a 1 Night minimum stay, as 55% of Tamworth Regional Council hosts use this setting.
- Explore offering discounts for stays of 30+ nights to attract the 20% of the market seeking extended stays.
- Adjust minimum nights based on seasonality – potentially shorter during low season and longer during peak demand periods in Tamworth Regional Council.
Tamworth Regional Council Airbnb Cancellation Policy Trends Analysis (2025)
Flexible
10 listings
43.5% of total
Moderate
10 listings
43.5% of total
Firm
2 listings
8.7% of total
Strict
1 listings
4.3% of total
Cancellation Policy Insights for Tamworth Regional Council
- The prevailing Airbnb cancellation policy trend in Tamworth Regional Council is Flexible, used by 43.5% of listings.
- The market strongly favors guest-friendly terms, with 87.0% of listings offering Flexible or Moderate policies. This suggests guests in Tamworth Regional Council may expect booking flexibility.
- Strict cancellation policies are quite rare (4.3%), potentially making listings with this policy less competitive unless justified by high demand or property type.
Recommendations for Hosts
- Consider adopting a Flexible policy to align with the 43.5% market standard in Tamworth Regional Council.
- Using a Strict policy might deter some guests, as only 4.3% of listings use it. Evaluate if potential revenue protection outweighs possible lower booking rates.
- Regularly review your cancellation policy against competitors and market demand shifts in Tamworth Regional Council.
Tamworth Regional Council STR Booking Lead Time Analysis (2025)
Average Booking Lead Time by Month
Booking Lead Time Insights for Tamworth Regional Council
- The overall average booking lead time for vacation rentals in Tamworth Regional Council is 60 days.
- Guests book furthest in advance for stays during January (average 107 days), likely coinciding with peak travel demand or local events.
- The shortest booking windows occur for stays in March (average 17 days), indicating more last-minute travel plans during this time.
- Seasonally, Winter (75 days avg.) sees the longest lead times, while Spring (21 days avg.) has the shortest, reflecting typical travel planning cycles.
Recommendations for Hosts
- Use the overall average lead time (60 days) as a baseline for your pricing and availability strategy in Tamworth Regional Council.
- For January stays, consider implementing length-of-stay discounts or slightly higher rates for bookings made less than 107 days out to capitalize on advance planning.
- Target marketing efforts for the Winter season well in advance (at least 75 days) to capture early planners.
- Monitor your own booking lead times against these Tamworth Regional Council averages to identify opportunities for dynamic pricing adjustments.
Popular & Essential Airbnb Amenities in Tamworth Regional Council (2025)
Amenity Prevalence
Amenity Insights for Tamworth Regional Council
- Essential amenities in Tamworth Regional Council that guests expect include: Free parking on premises, Smoke alarm, Kitchen, Heating. Lacking these (any) could significantly impact bookings.
- Popular amenities like Dishes and silverware, Air conditioning, Iron are common but not universal. Offering these can provide a competitive edge.
Recommendations for Hosts
- Ensure your listing includes all essential amenities for Tamworth Regional Council: Free parking on premises, Smoke alarm, Kitchen, Heating.
- Prioritize adding missing essentials: Kitchen, Heating.
- Consider adding popular differentiators like Dishes and silverware or Air conditioning to increase appeal.
- Highlight unique or less common amenities you offer (e.g., hot tub, dedicated workspace, EV charger) in your listing description and photos.
- Regularly check competitor amenities in Tamworth Regional Council to stay competitive.
Tamworth Regional Council Airbnb Guest Demographics & Profile Analysis (2025)
Guest Profile Summary for Tamworth Regional Council
- The typical guest profile for Airbnb in Tamworth Regional Council consists of primarily domestic travelers (93%), often arriving from nearby Sydney, typically belonging to the Post-2000s (Gen Z/Alpha) group (50%), primarily speaking English or Chinese.
- Domestic travelers account for 93.2% of guests.
- Key international markets include Australia (93.2%) and United Kingdom (2%).
- Top languages spoken are English (73.6%) followed by Chinese (4.1%).
- A significant demographic segment is the Post-2000s (Gen Z/Alpha) group, representing 50% of guests.
Recommendations for Hosts
- Target domestic marketing efforts towards travelers from Sydney and New South Wales.
- Tailor amenities and listing descriptions to appeal to the dominant Post-2000s (Gen Z/Alpha) demographic (e.g., highlight fast WiFi, smart home features, local guides).
- Highlight unique local experiences or amenities relevant to the primary guest profile.
- Consider seasonal promotions aligned with peak travel times for key origin markets.
Nearby Short-Term Rental Market Comparison
How does the Tamworth Regional Council Airbnb market stack up against its neighbors? Compare key performance metrics like average monthly revenue, ADR, and occupancy rates in surrounding areas to understand the broader regional STR landscape.
| Market | Active Properties | Monthly Revenue | Daily Rate | Avg. Occupancy |
|---|---|---|---|---|
| Green Point | 16 | $4,869 | $360.27 | 48% |
| Singleton Council | 154 | $4,304 | $517.74 | 32% |
| Nulkaba | 37 | $4,242 | $524.17 | 30% |
| Broke | 58 | $4,084 | $448.99 | 32% |
| Branxton | 17 | $4,019 | $399.77 | 32% |
| Cessnock | 493 | $3,878 | $416.89 | 35% |
| Coomba Park | 31 | $3,858 | $395.11 | 39% |
| Millfield | 29 | $3,809 | $385.13 | 35% |
| Cessnock City Council | 127 | $3,776 | $436.62 | 35% |
| Seal Rocks | 18 | $3,663 | $405.93 | 35% |