St Georges Basin Airbnb Market Analysis 2025: Short Term Rental Data & Vacation Rental Statistics in New South Wales, Australia
Is Airbnb profitable in St Georges Basin in 2025? Explore comprehensive Airbnb analytics for St Georges Basin, New South Wales, Australia to uncover income potential. This 2025 STR market report for St Georges Basin, based on AirROI data from April 2024 to March 2025, reveals key trends in the niche market of 51 active listings.
Whether you're considering an Airbnb investment in St Georges Basin, optimizing your existing vacation rental, or exploring rental arbitrage opportunities, understanding the St Georges Basin Airbnb data is crucial. Navigating the high regulation landscape is key to maximizing your short term rental income potential. Let's dive into the specifics.
Key St Georges Basin Airbnb Performance Metrics Overview
Monthly Airbnb Revenue Variations & Income Potential in St Georges Basin (2025)
Understanding the monthly revenue variations for Airbnb listings in St Georges Basin is key to maximizing your short term rental income potential. Seasonality significantly impacts earnings. Our analysis, based on data from the past 12 months, shows that the peak revenue month for STRs in St Georges Basin is typically January, while August often presents the lowest earnings, highlighting opportunities for strategic pricing adjustments during shoulder and low seasons. Explore the typical Airbnb income in St Georges Basin across different performance tiers:
- Best-in-class properties (Top 10%) achieve $9,023+ monthly, often utilizing dynamic pricing and superior guest experiences.
- Strong performing properties (Top 25%) earn $4,599 or more, indicating effective management and desirable locations/amenities.
- Typical properties (Median) generate around $2,513 per month, representing the average market performance.
- Entry-level properties (Bottom 25%) see earnings around $1,312, often with potential for optimization.
Average Monthly Airbnb Earnings Trend in St Georges Basin
St Georges Basin Airbnb Occupancy Rate Trends (2025)
Maximize your bookings by understanding the St Georges Basin STR occupancy trends. Seasonal demand shifts significantly influence how often properties are booked. Typically, Januarysees the highest demand (peak season occupancy), while May experiences the lowest (low season). Effective strategies, like adjusting minimum stays or offering promotions, can boost occupancy during slower periods. Here's how different property tiers perform in St Georges Basin:
- Best-in-class properties (Top 10%) achieve 81%+ occupancy, indicating high desirability and potentially optimized availability.
- Strong performing properties (Top 25%) maintain 63% or higher occupancy, suggesting good market fit and guest satisfaction.
- Typical properties (Median) have an occupancy rate around 34%.
- Entry-level properties (Bottom 25%) average 18% occupancy, potentially facing higher vacancy.
Average Monthly Occupancy Rate Trend in St Georges Basin
Average Daily Rate (ADR) Airbnb Trends in St Georges Basin (2025)
Effective short term rental pricing strategy in St Georges Basin involves understanding monthly ADR fluctuations. The Average Daily Rate (ADR) for Airbnb in St Georges Basin typically peaks in January and dips lowest during August. Leveraging Airbnb dynamic pricing tools or strategies based on this seasonality can significantly boost revenue. Here's a look at the typical nightly rates achieved:
- Best-in-class properties (Top 10%) command rates of $623+ per night, often due to premium features or locations.
- Strong performing properties (Top 25%) achieve nightly rates of $401 or more.
- Typical properties (Median) charge around $264 per night.
- Entry-level properties (Bottom 25%) earn around $158 per night.
Average Daily Rate (ADR) Trend by Month in St Georges Basin
Get Live St Georges Basin Market Intelligence 👇

Explore Real-time Analytics
Airbnb Seasonality Analysis & Trends in St Georges Basin (2025)
Peak Season (January, December, November)
- Revenue averages $5,446 per month
- Occupancy rates average 50.9%
- Daily rates average $349
Shoulder Season
- Revenue averages $3,881 per month
- Occupancy maintains around 38.8%
- Daily rates hold near $307
Low Season (February, August, September)
- Revenue drops to average $2,999 per month
- Occupancy decreases to average 35.4%
- Daily rates adjust to average $311
Seasonality Insights for St Georges Basin
- The Airbnb seasonality in St Georges Basin shows highly seasonal trends requiring careful strategy. While the sections above show seasonal averages, it's also insightful to look at the extremes:
- During the high season, the absolute peak month showcases St Georges Basin's highest earning potential, with monthly revenues capable of climbing to $6,234, occupancy reaching a high of 56.6%, and ADRs peaking at $368.
- Conversely, the slowest single month of the year, typically falling within the low season, marks the market's lowest point. In this month, revenue might dip to $2,756, occupancy could drop to 32.5%, and ADRs may adjust down to $296.
- Understanding both the seasonal averages and these monthly peaks and troughs in revenue, occupancy, and ADR is crucial for maximizing your Airbnb profit potential in St Georges Basin.
Seasonal Strategies for Maximizing Profit
- Peak Season: Maximize revenue through premium pricing and potentially longer minimum stays. Ensure high availability.
- Low Season: Offer competitive pricing, special promotions (e.g., extended stay discounts), and flexible cancellation policies. Target off-season travelers like remote workers or budget-conscious guests.
- Shoulder Seasons: Implement dynamic pricing that balances peak and low rates. Target weekend travelers or specific events. Offer slightly more flexible terms than peak season.
- Regularly analyze your own performance against these St Georges Basin seasonality benchmarks and adjust your pricing and availability strategy accordingly.
Best Areas for Airbnb Investment in St Georges Basin (2025)
Exploring the top neighborhoods for short-term rentals in St Georges Basin? This section highlights key areas, outlining why they are attractive for hosts and guests, along with notable local attractions. Consider these locations based on your target guest profile and investment strategy.
| Neighborhood / Area | Why Host Here? (Target Guests & Appeal) | Key Attractions & Landmarks |
|---|---|---|
| Basin View | A serene area known for its stunning waterfront and natural beauty, making it an ideal spot for tourists looking for relaxation and nature activities. | Basin View Beach, St Georges Basin, Bherwerre Peninsula, National Parks, Fishing Spots |
| Saint Georges Basin | A picturesque suburb with access to water activities and tranquil surroundings, perfect for families and those seeking a peaceful getaway. | St Georges Basin Sailing Club, Water sports activities, Picnic areas, Scenic walking tracks |
| Island Point | A small, quiet location that offers direct access to beautiful bays and is perfect for those looking to escape the hustle and bustle of city life. | Island Point Boat Ramp, Waterfront views, Fishing locations, Nature reserves |
| Hyams Beach | Famous for having the whitest sand in the world, this beach attracts visitors seeking an idyllic beach holiday and luxury accommodation. | Hyams Beach, Booderee National Park, Smoky Cape, Weatherley Beach, Jervis Bay Maritime Museum |
| Vincentia | A vibrant coastal town that serves as a gateway to Jervis Bay, known for its stunning beaches and marine park, attracting beach lovers and adventure seekers. | Jervis Bay National Park, Blenheim Beach, Hyams Beach nearby, Vincentia Marketplace |
| Jervis Bay | Renowned for its beautiful beaches and marine life, this area is a hotspot for tourists and offers various outdoor activities throughout the year. | Jervis Bay Baywalk, Dolphin watching, Booderee National Park, Sea kayaking, Whale watching |
| Erowal Bay | A quiet coastal area that is perfect for families or those looking to spend time in nature with easy access to water activities and national parks. | Erowal Bay Boat Ramp, Bherwerre Wetlands, National parks, Scenic picnic spots |
| Sussex Inlet | Known for its waterways and fishing opportunities, this area is great for travelers looking for aquatic activities and relaxing escapes. | Sussex Inlet Canal, Fishing spots, Waterfront restaurants, National parks nearby |
Understanding Airbnb License Requirements & STR Laws in St Georges Basin (2025)
Yes, St Georges Basin, New South Wales, Australia enforces high STR regulations. Obtaining a license and ensuring compliance is almost certainly required according to current 2025 STR laws. Always verify the latest short term rental regulations and Airbnb license requirements directly with local government authorities for St Georges Basin to ensure full compliance before hosting.
(Source: AirROI data, 2025, based on 88% licensed listings)
Top Performing Airbnb Properties in St Georges Basin (2025)
Benchmark your potential! Explore examples of top-performing Airbnb properties in St Georges Basinbased on Trailing Twelve Month (TTM) revenue. Analyze their characteristics, revenue, occupancy rate, and ADR to understand what drives success in this market.
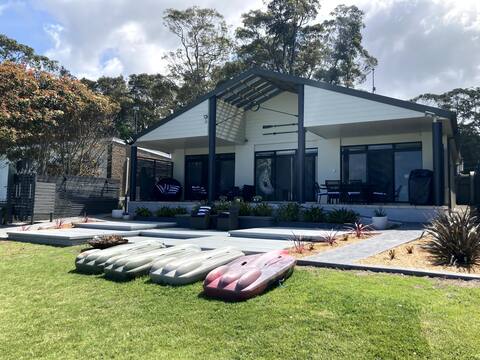
Beyond the Sea + absolute waterfront/heated pool
Entire Place • 7 bedrooms

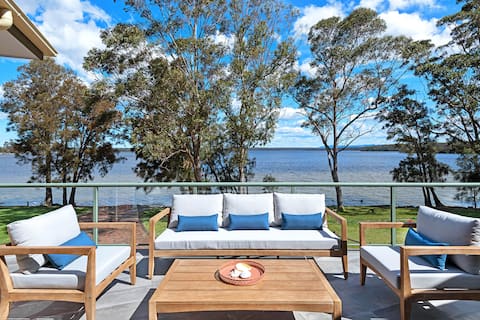
Beyond the Sea ( with heated pool )
Entire Place • 5 bedrooms
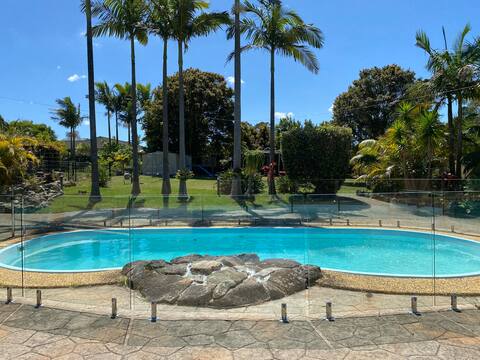
The Landing: Waterfront, boat ramp, luxury retreat
Entire Place • 6 bedrooms
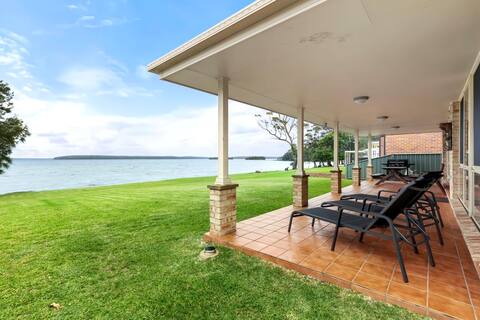
Family haven-close to Jervis Bay
Entire Place • 4 bedrooms

Montrose: Waterfront designer home, stunning views
Entire Place • 5 bedrooms
Island View by Experience Jervis Bay
Entire Place • 4 bedrooms
Note: Performance varies based on location, size, amenities, seasonality, and management quality. Data reflects the past 12 months.
Top Performing Airbnb Hosts in St Georges Basin (2025)
Learn from the best! This table showcases top-performing Airbnb hosts in St Georges Basin based on the number of properties managed and estimated total revenue over the past year. Analyze their scale and performance metrics.
| Host Name | Properties | Grossing Revenue | Stay Reviews | Avg Rating |
|---|---|---|---|---|
| Mark & Sandra | 6 | $665,724 | 1014 | 4.88/5.0 |
| Mel And Alana At The FAM | 3 | $208,186 | 101 | 4.94/5.0 |
| Experience Jervis Bay | 3 | $104,387 | 39 | 4.84/5.0 |
| Kelli | 1 | $86,529 | 13 | 4.92/5.0 |
| Peter | 1 | $61,481 | 98 | 4.99/5.0 |
| Book Jervis Bay | 4 | $47,623 | 8 | 1.88/5.0 |
| Jervis Bay Realty | 1 | $44,444 | 40 | 4.63/5.0 |
| Cory & Kris | 1 | $40,537 | 19 | 4.95/5.0 |
| Hannah | 1 | $39,781 | 67 | 4.85/5.0 |
| Shell | 1 | $38,611 | 150 | 4.91/5.0 |
Analyzing the strategies of top hosts, such as their property selection, pricing, and guest communication, can offer valuable lessons for optimizing your own Airbnb operations in St Georges Basin.
Dive Deeper: Advanced St Georges Basin STR Market Data (2025)
Ready to unlock more insights? AirROI provides access to advanced metrics and comprehensive Airbnb data for St Georges Basin. Explore detailed analytics beyond this report to refine your investment strategy, optimize pricing, and maximize your vacation rental profits.
Explore Advanced MetricsSt Georges Basin Short-Term Rental Market Composition (2025): Property & Room Types
Room Type Distribution
Property Type Distribution
Market Composition Insights for St Georges Basin
- The St Georges Basin Airbnb market composition is heavily skewed towards Entire Home/Apt listings, which make up 100% of the 51 active rentals. This indicates strong guest preference for privacy and space.
- Looking at the property type distribution in St Georges Basin, House properties are the most common (74.5%), reflecting the local real estate landscape.
- Houses represent a significant 74.5% portion, catering likely to families or larger groups.
- The presence of 11.8% Hotel/Boutique listings indicates integration with traditional hospitality.
- Smaller segments like apartment/condo (combined 2.0%) offer potential for unique stay experiences.
St Georges Basin Airbnb Room Capacity Analysis (2025): Bedroom Distribution
Distribution of Listings by Number of Bedrooms
Room Capacity Insights for St Georges Basin
- The dominant room capacity in St Georges Basin is 3 bedrooms listings, making up 25.5% of the market. This suggests a strong demand for properties suitable for families or small groups.
- Together, 3 bedrooms and 1 bedroom properties represent 47.1% of the active Airbnb listings in St Georges Basin, indicating a high concentration in these sizes.
- A significant 56.8% of listings offer 3+ bedrooms, catering to larger groups and families seeking more space in St Georges Basin.
St Georges Basin Vacation Rental Guest Capacity Trends (2025)
Distribution of Listings by Guest Capacity
Guest Capacity Insights for St Georges Basin
- The most common guest capacity trend in St Georges Basin vacation rentals is listings accommodating 8+ guests (35.3%). This suggests the primary traveler segment is likely larger groups.
- Properties designed for 8+ guests and 2 guests dominate the St Georges Basin STR market, accounting for 56.9% of listings.
- 58.8% of properties accommodate 6+ guests, serving the market segment for larger families or group travel in St Georges Basin.
- On average, properties in St Georges Basin are equipped to host 5.6 guests.
St Georges Basin Airbnb Booking Patterns (2025): Available vs. Booked Days
Available Days Distribution
Booked Days Distribution
Booking Pattern Insights for St Georges Basin
- The most common availability pattern in St Georges Basin falls within the 271-366 days range, representing 56.9% of listings. This suggests many properties have significant open periods on their calendars.
- Approximately 76.5% of listings show high availability (181+ days open annually), indicating potential for increased bookings or specific owner usage patterns.
- For booked days, the 31-90 days range is most frequent in St Georges Basin (41.2%), reflecting common guest stay durations or potential owner blocking patterns.
- A notable 23.5% of properties secure long booking periods (181+ days booked per year), highlighting successful long-term rental strategies or significant owner usage.
St Georges Basin Airbnb Minimum Stay Requirements Analysis
Distribution of Listings by Minimum Night Requirement
1 Night
8 listings
17% of total
2 Nights
19 listings
40.4% of total
3 Nights
1 listings
2.1% of total
4-6 Nights
1 listings
2.1% of total
30+ Nights
18 listings
38.3% of total
Key Insights
- The most prevalent minimum stay requirement in St Georges Basin is 2 Nights, adopted by 40.4% of listings. This highlights the market's preference for shorter, flexible bookings.
- A significant segment (38.3%) caters to monthly stays (30+ nights) in St Georges Basin, pointing to opportunities in the extended-stay market.
Recommendations
- Align with the market by considering a 2 Nights minimum stay, as 40.4% of St Georges Basin hosts use this setting.
- If feasible, allowing 1-night stays, especially midweek or during low season, could capture last-minute bookings, as only 17% currently do.
- A 2-night minimum appears standard (40.4%). Consider this for weekends or peak periods.
- Explore offering discounts for stays of 30+ nights to attract the 38.3% of the market seeking extended stays.
- Adjust minimum nights based on seasonality – potentially shorter during low season and longer during peak demand periods in St Georges Basin.
St Georges Basin Airbnb Cancellation Policy Trends Analysis (2025)
Super Strict 30 Days
2 listings
4.3% of total
Flexible
5 listings
10.9% of total
Moderate
18 listings
39.1% of total
Firm
14 listings
30.4% of total
Strict
7 listings
15.2% of total
Cancellation Policy Insights for St Georges Basin
- The prevailing Airbnb cancellation policy trend in St Georges Basin is Moderate, used by 39.1% of listings.
- There's a relatively balanced mix between guest-friendly (50.0%) and stricter (45.6%) policies, offering choices for different guest needs.
Recommendations for Hosts
- Consider adopting a Moderate policy to align with the 39.1% market standard in St Georges Basin.
- Regularly review your cancellation policy against competitors and market demand shifts in St Georges Basin.
St Georges Basin STR Booking Lead Time Analysis (2025)
Average Booking Lead Time by Month
Booking Lead Time Insights for St Georges Basin
- The overall average booking lead time for vacation rentals in St Georges Basin is 47 days.
- Guests book furthest in advance for stays during December (average 80 days), likely coinciding with peak travel demand or local events.
- The shortest booking windows occur for stays in August (average 28 days), indicating more last-minute travel plans during this time.
- Seasonally, Winter (66 days avg.) sees the longest lead times, while Summer (38 days avg.) has the shortest, reflecting typical travel planning cycles.
Recommendations for Hosts
- Use the overall average lead time (47 days) as a baseline for your pricing and availability strategy in St Georges Basin.
- For December stays, consider implementing length-of-stay discounts or slightly higher rates for bookings made less than 80 days out to capitalize on advance planning.
- Target marketing efforts for the Winter season well in advance (at least 66 days) to capture early planners.
- Monitor your own booking lead times against these St Georges Basin averages to identify opportunities for dynamic pricing adjustments.
Popular & Essential Airbnb Amenities in St Georges Basin (2025)
Amenity Prevalence
Amenity Insights for St Georges Basin
- Essential amenities in St Georges Basin that guests expect include: TV, Free parking on premises, Kitchen, Smoke alarm, Dishes and silverware. Lacking these (any) could significantly impact bookings.
- Popular amenities like Heating, Refrigerator, Microwave are common but not universal. Offering these can provide a competitive edge.
Recommendations for Hosts
- Ensure your listing includes all essential amenities for St Georges Basin: TV, Free parking on premises, Kitchen, Smoke alarm, Dishes and silverware.
- Prioritize adding missing essentials: Free parking on premises, Kitchen, Smoke alarm, Dishes and silverware.
- Consider adding popular differentiators like Heating or Refrigerator to increase appeal.
- Highlight unique or less common amenities you offer (e.g., hot tub, dedicated workspace, EV charger) in your listing description and photos.
- Regularly check competitor amenities in St Georges Basin to stay competitive.
St Georges Basin Airbnb Guest Demographics & Profile Analysis (2025)
Guest Profile Summary for St Georges Basin
- The typical guest profile for Airbnb in St Georges Basin consists of primarily domestic travelers (82%), often arriving from nearby Sydney, typically belonging to the Post-2000s (Gen Z/Alpha) group (50%), primarily speaking English or Chinese.
- Domestic travelers account for 81.5% of guests.
- Key international markets include Australia (81.5%) and United Kingdom (4.7%).
- Top languages spoken are English (59.5%) followed by Chinese (6.1%).
- A significant demographic segment is the Post-2000s (Gen Z/Alpha) group, representing 50% of guests.
Recommendations for Hosts
- Target domestic marketing efforts towards travelers from Sydney and New South Wales.
- Tailor amenities and listing descriptions to appeal to the dominant Post-2000s (Gen Z/Alpha) demographic (e.g., highlight fast WiFi, smart home features, local guides).
- Highlight unique local experiences or amenities relevant to the primary guest profile.
- Consider seasonal promotions aligned with peak travel times for key origin markets.
Nearby Short-Term Rental Market Comparison
How does the St Georges Basin Airbnb market stack up against its neighbors? Compare key performance metrics like average monthly revenue, ADR, and occupancy rates in surrounding areas to understand the broader regional STR landscape.
| Market | Active Properties | Monthly Revenue | Daily Rate | Avg. Occupancy |
|---|---|---|---|---|
| Penrose | 12 | $6,349 | $600.00 | 42% |
| Berry | 115 | $6,185 | $540.04 | 41% |
| Jaspers Brush | 13 | $5,600 | $510.06 | 37% |
| Burrawang | 11 | $5,005 | $523.75 | 43% |
| Berrima | 44 | $4,756 | $426.34 | 42% |
| Braidwood | 20 | $4,708 | $443.62 | 40% |
| Robertson | 44 | $4,655 | $375.71 | 40% |
| Bombo | 10 | $4,613 | $503.00 | 39% |
| Exeter | 30 | $4,595 | $519.08 | 38% |
| Gerringong | 121 | $4,483 | $486.76 | 37% |