South Golden Beach Airbnb Market Analysis 2025: Short Term Rental Data & Vacation Rental Statistics in New South Wales, Australia
Is Airbnb profitable in South Golden Beach in 2025? Explore comprehensive Airbnb analytics for South Golden Beach, New South Wales, Australia to uncover income potential. This 2025 STR market report for South Golden Beach, based on AirROI data from April 2024 to March 2025, reveals key trends in the niche market of 38 active listings.
Whether you're considering an Airbnb investment in South Golden Beach, optimizing your existing vacation rental, or exploring rental arbitrage opportunities, understanding the South Golden Beach Airbnb data is crucial. Navigating the high regulation landscape is key to maximizing your short term rental income potential. Let's dive into the specifics.
Key South Golden Beach Airbnb Performance Metrics Overview
Monthly Airbnb Revenue Variations & Income Potential in South Golden Beach (2025)
Understanding the monthly revenue variations for Airbnb listings in South Golden Beach is key to maximizing your short term rental income potential. Seasonality significantly impacts earnings. Our analysis, based on data from the past 12 months, shows that the peak revenue month for STRs in South Golden Beach is typically December, while March often presents the lowest earnings, highlighting opportunities for strategic pricing adjustments during shoulder and low seasons. Explore the typical Airbnb income in South Golden Beach across different performance tiers:
- Best-in-class properties (Top 10%) achieve $5,993+ monthly, often utilizing dynamic pricing and superior guest experiences.
- Strong performing properties (Top 25%) earn $3,807 or more, indicating effective management and desirable locations/amenities.
- Typical properties (Median) generate around $2,188 per month, representing the average market performance.
- Entry-level properties (Bottom 25%) see earnings around $1,202, often with potential for optimization.
Average Monthly Airbnb Earnings Trend in South Golden Beach
South Golden Beach Airbnb Occupancy Rate Trends (2025)
Maximize your bookings by understanding the South Golden Beach STR occupancy trends. Seasonal demand shifts significantly influence how often properties are booked. Typically, Decembersees the highest demand (peak season occupancy), while June experiences the lowest (low season). Effective strategies, like adjusting minimum stays or offering promotions, can boost occupancy during slower periods. Here's how different property tiers perform in South Golden Beach:
- Best-in-class properties (Top 10%) achieve 85%+ occupancy, indicating high desirability and potentially optimized availability.
- Strong performing properties (Top 25%) maintain 69% or higher occupancy, suggesting good market fit and guest satisfaction.
- Typical properties (Median) have an occupancy rate around 42%.
- Entry-level properties (Bottom 25%) average 20% occupancy, potentially facing higher vacancy.
Average Monthly Occupancy Rate Trend in South Golden Beach
Average Daily Rate (ADR) Airbnb Trends in South Golden Beach (2025)
Effective short term rental pricing strategy in South Golden Beach involves understanding monthly ADR fluctuations. The Average Daily Rate (ADR) for Airbnb in South Golden Beach typically peaks in April and dips lowest during March. Leveraging Airbnb dynamic pricing tools or strategies based on this seasonality can significantly boost revenue. Here's a look at the typical nightly rates achieved:
- Best-in-class properties (Top 10%) command rates of $514+ per night, often due to premium features or locations.
- Strong performing properties (Top 25%) achieve nightly rates of $365 or more.
- Typical properties (Median) charge around $212 per night.
- Entry-level properties (Bottom 25%) earn around $131 per night.
Average Daily Rate (ADR) Trend by Month in South Golden Beach
Get Live South Golden Beach Market Intelligence 👇

Explore Real-time Analytics
Airbnb Seasonality Analysis & Trends in South Golden Beach (2025)
Peak Season (December, January, November)
- Revenue averages $3,712 per month
- Occupancy rates average 53.0%
- Daily rates average $254
Shoulder Season
- Revenue averages $2,762 per month
- Occupancy maintains around 46.3%
- Daily rates hold near $290
Low Season (February, March, June)
- Revenue drops to average $2,041 per month
- Occupancy decreases to average 37.3%
- Daily rates adjust to average $250
Seasonality Insights for South Golden Beach
- The Airbnb seasonality in South Golden Beach shows highly seasonal trends requiring careful strategy. While the sections above show seasonal averages, it's also insightful to look at the extremes:
- During the high season, the absolute peak month showcases South Golden Beach's highest earning potential, with monthly revenues capable of climbing to $4,402, occupancy reaching a high of 55.8%, and ADRs peaking at $295.
- Conversely, the slowest single month of the year, typically falling within the low season, marks the market's lowest point. In this month, revenue might dip to $1,952, occupancy could drop to 24.2%, and ADRs may adjust down to $228.
- Understanding both the seasonal averages and these monthly peaks and troughs in revenue, occupancy, and ADR is crucial for maximizing your Airbnb profit potential in South Golden Beach.
Seasonal Strategies for Maximizing Profit
- Peak Season: Maximize revenue through premium pricing and potentially longer minimum stays. Ensure high availability.
- Low Season: Offer competitive pricing, special promotions (e.g., extended stay discounts), and flexible cancellation policies. Target off-season travelers like remote workers or budget-conscious guests.
- Shoulder Seasons: Implement dynamic pricing that balances peak and low rates. Target weekend travelers or specific events. Offer slightly more flexible terms than peak season.
- Regularly analyze your own performance against these South Golden Beach seasonality benchmarks and adjust your pricing and availability strategy accordingly.
Best Areas for Airbnb Investment in South Golden Beach (2025)
Exploring the top neighborhoods for short-term rentals in South Golden Beach? This section highlights key areas, outlining why they are attractive for hosts and guests, along with notable local attractions. Consider these locations based on your target guest profile and investment strategy.
| Neighborhood / Area | Why Host Here? (Target Guests & Appeal) | Key Attractions & Landmarks |
|---|---|---|
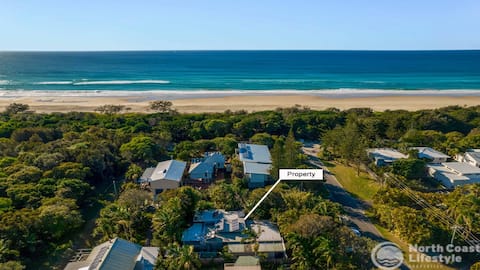
| South Golden Beach | A serene coastal town known for its pristine beach and relaxed atmosphere. A hidden gem for tourists seeking tranquility and natural beauty, perfect for a peaceful getaway. | South Golden Beach, Tallebudgera Creek, Mount Warning National Park, Byron Bay, Tallow Beach, Wategos Beach |
| Byron Bay | Famous for its stunning coastal scenery, laid-back vibe, and as a popular destination for surfers and wellness seekers. Excellent for attracting tourists interested in both relaxation and adventure. | Cape Byron Lighthouse, Byron Bay Main Beach, The Pass, Byron Bay Markets, Circus Arts Byron Bay, Arakwal National Park |
| Brunswick Heads | A charming riverside village with a relaxed atmosphere, known for its beautiful beaches and local markets. Ideal for weekend getaways, attracting families and couples alike. | Brunswick Heads Beach, The Brunswick River, Fishermans Lookout, Brunswick Heads Markets, Torakina Beach, Mullumbimby |
| Pottsville | A peaceful coastal town with beautiful beaches and a family-friendly vibe. Perfect for tourists looking for a quiet escape close to nature. | Pottsville Beach, Black Rocks Beach, Mooball National Park, Cudgera Creek, Pottsville Markets, Mullumbimby |
| Nimbin | Known for its artistic community and alternative lifestyle, Nimbin attracts those interested in culture and nature. A unique destination with a vibrant atmosphere. | Nimbin Markets, Nimbin Museum, Nimbin Rocks, Mullumbimby, DjaningTechnology Park, Nimbin Candle Shop |
| Kingscliff | Popular for its stunning beaches and coastal cafes. Ideal for beach-loving tourists and family vacations, with various dining options and activities. | Kingscliff Beach, Cudgen Creek, Kingscliff Markets, Cook Island, Tweed River, Salt Village |
| Tweed Heads | A vibrant town that offers a mix of relaxing beach life and urban convenience, making it appealing for tourists. Great for fishing, golfing, and enjoying waterfront dining. | Tweed River, Coolangatta Beach, Twin Towns Services Club, Tweed Heads Harbour, Minjungbal Aboriginal Cultural Centre, Duranbah Beach |
| Murwillumbah | A scenic town located in the stunning Tweed Valley, known for its rich history and lush surroundings. Great for tourists interested in nature and art trails in the region. | Tweed Regional Gallery, Mt. Warning, Murwillumbah Markets, Wollumbin National Park, Riverside Drive Park, Rainforest Walks |
Understanding Airbnb License Requirements & STR Laws in South Golden Beach (2025)
Yes, South Golden Beach, New South Wales, Australia enforces high STR regulations. Obtaining a license and ensuring compliance is almost certainly required according to current 2025 STR laws. Always verify the latest short term rental regulations and Airbnb license requirements directly with local government authorities for South Golden Beach to ensure full compliance before hosting.
(Source: AirROI data, 2025, based on 84% licensed listings)
Top Performing Airbnb Properties in South Golden Beach (2025)
Benchmark your potential! Explore examples of top-performing Airbnb properties in South Golden Beachbased on Trailing Twelve Month (TTM) revenue. Analyze their characteristics, revenue, occupancy rate, and ADR to understand what drives success in this market.

Peaceful Sanctuary with pool 70m to the beach
Entire Place • 4 bedrooms
Glorious- Private Oasis
Entire Place • 3 bedrooms

South Golden Beach Abode - Family Luxury and Beach
Entire Place • 5 bedrooms

Beachfront South Golden, close to Brunswick Heads
Entire Place • 2 bedrooms
Boutique Ocean & River Cottage
Entire Place • 2 bedrooms
South Golden Beach House
Entire Place • 2 bedrooms
Note: Performance varies based on location, size, amenities, seasonality, and management quality. Data reflects the past 12 months.
Top Performing Airbnb Hosts in South Golden Beach (2025)
Learn from the best! This table showcases top-performing Airbnb hosts in South Golden Beach based on the number of properties managed and estimated total revenue over the past year. Analyze their scale and performance metrics.
| Host Name | Properties | Grossing Revenue | Stay Reviews | Avg Rating |
|---|---|---|---|---|
| North Coast Lifestyle Properti | 4 | $128,376 | 37 | 4.67/5.0 |
| Andrea | 1 | $100,414 | 94 | 5.00/5.0 |
| Intrepid BnB | 1 | $67,246 | 50 | 4.90/5.0 |
| Jolene | 1 | $47,502 | 65 | 5.00/5.0 |
| Marjolein | 1 | $46,274 | 89 | 4.87/5.0 |
| Jono | 1 | $45,791 | 13 | 5.00/5.0 |
| Jenny | 1 | $45,779 | 60 | 4.73/5.0 |
| Jodie | 2 | $37,906 | 361 | 4.93/5.0 |
| Ralph | 1 | $34,551 | 123 | 4.83/5.0 |
| Trenton | 1 | $34,211 | 113 | 4.95/5.0 |
Analyzing the strategies of top hosts, such as their property selection, pricing, and guest communication, can offer valuable lessons for optimizing your own Airbnb operations in South Golden Beach.
Dive Deeper: Advanced South Golden Beach STR Market Data (2025)
Ready to unlock more insights? AirROI provides access to advanced metrics and comprehensive Airbnb data for South Golden Beach. Explore detailed analytics beyond this report to refine your investment strategy, optimize pricing, and maximize your vacation rental profits.
Explore Advanced MetricsSouth Golden Beach Short-Term Rental Market Composition (2025): Property & Room Types
Room Type Distribution
Property Type Distribution
Market Composition Insights for South Golden Beach
- The South Golden Beach Airbnb market composition is heavily skewed towards Entire Home/Apt listings, which make up 86.8% of the 38 active rentals. This indicates strong guest preference for privacy and space.
- Looking at the property type distribution in South Golden Beach, House properties are the most common (76.3%), reflecting the local real estate landscape.
- Houses represent a significant 76.3% portion, catering likely to families or larger groups.
- The presence of 7.9% Hotel/Boutique listings indicates integration with traditional hospitality.
South Golden Beach Airbnb Room Capacity Analysis (2025): Bedroom Distribution
Distribution of Listings by Number of Bedrooms
Room Capacity Insights for South Golden Beach
- The dominant room capacity in South Golden Beach is 1 bedroom listings, making up 26.3% of the market. This suggests a strong demand for properties suitable for couples or solo travelers.
- Together, 1 bedroom and 2 bedrooms properties represent 47.4% of the active Airbnb listings in South Golden Beach, indicating a high concentration in these sizes.
- A significant 39.5% of listings offer 3+ bedrooms, catering to larger groups and families seeking more space in South Golden Beach.
South Golden Beach Vacation Rental Guest Capacity Trends (2025)
Distribution of Listings by Guest Capacity
Guest Capacity Insights for South Golden Beach
- The most common guest capacity trend in South Golden Beach vacation rentals is listings accommodating 2 guests (26.3%). This suggests the primary traveler segment is likely couples or solo travelers.
- Properties designed for 2 guests and 4 guests dominate the South Golden Beach STR market, accounting for 47.4% of listings.
- 36.8% of properties accommodate 6+ guests, serving the market segment for larger families or group travel in South Golden Beach.
- On average, properties in South Golden Beach are equipped to host 4.3 guests.
South Golden Beach Airbnb Booking Patterns (2025): Available vs. Booked Days
Available Days Distribution
Booked Days Distribution
Booking Pattern Insights for South Golden Beach
- The most common availability pattern in South Golden Beach falls within the 271-366 days range, representing 44.7% of listings. This suggests many properties have significant open periods on their calendars.
- Approximately 65.8% of listings show high availability (181+ days open annually), indicating potential for increased bookings or specific owner usage patterns.
- For booked days, the 181-270 days range is most frequent in South Golden Beach (23.7%), reflecting common guest stay durations or potential owner blocking patterns.
- A notable 34.2% of properties secure long booking periods (181+ days booked per year), highlighting successful long-term rental strategies or significant owner usage.
South Golden Beach Airbnb Minimum Stay Requirements Analysis
Distribution of Listings by Minimum Night Requirement
1 Night
3 listings
8.3% of total
2 Nights
9 listings
25% of total
3 Nights
3 listings
8.3% of total
4-6 Nights
1 listings
2.8% of total
7-29 Nights
7 listings
19.4% of total
30+ Nights
13 listings
36.1% of total
Key Insights
- The most prevalent minimum stay requirement in South Golden Beach is 30+ Nights, adopted by 36.1% of listings. This highlights the market's preference for longer commitments.
- A significant segment (36.1%) caters to monthly stays (30+ nights) in South Golden Beach, pointing to opportunities in the extended-stay market.
Recommendations
- Align with the market by considering a 30+ Nights minimum stay, as 36.1% of South Golden Beach hosts use this setting.
- If feasible, allowing 1-night stays, especially midweek or during low season, could capture last-minute bookings, as only 8.3% currently do.
- Explore offering discounts for stays of 30+ nights to attract the 36.1% of the market seeking extended stays.
- Adjust minimum nights based on seasonality – potentially shorter during low season and longer during peak demand periods in South Golden Beach.
South Golden Beach Airbnb Cancellation Policy Trends Analysis (2025)
Super Strict 30 Days
4 listings
12.1% of total
Flexible
3 listings
9.1% of total
Moderate
8 listings
24.2% of total
Firm
7 listings
21.2% of total
Strict
11 listings
33.3% of total
Cancellation Policy Insights for South Golden Beach
- The prevailing Airbnb cancellation policy trend in South Golden Beach is Strict, used by 33.3% of listings.
- A majority (54.5%) of hosts in South Golden Beach utilize Firm or Strict policies, indicating a market where hosts prioritize booking security.
Recommendations for Hosts
- Consider adopting a Strict policy to align with the 33.3% market standard in South Golden Beach.
- With 33.3% using Strict terms, this is a viable option in South Golden Beach, particularly for high-value properties or during peak demand periods.
- Regularly review your cancellation policy against competitors and market demand shifts in South Golden Beach.
South Golden Beach STR Booking Lead Time Analysis (2025)
Average Booking Lead Time by Month
Booking Lead Time Insights for South Golden Beach
- The overall average booking lead time for vacation rentals in South Golden Beach is 54 days.
- Guests book furthest in advance for stays during April (average 90 days), likely coinciding with peak travel demand or local events.
- The shortest booking windows occur for stays in October (average 41 days), indicating more last-minute travel plans during this time.
- Seasonally, Spring (74 days avg.) sees the longest lead times, while Fall (45 days avg.) has the shortest, reflecting typical travel planning cycles.
Recommendations for Hosts
- Use the overall average lead time (54 days) as a baseline for your pricing and availability strategy in South Golden Beach.
- For April stays, consider implementing length-of-stay discounts or slightly higher rates for bookings made less than 90 days out to capitalize on advance planning.
- Target marketing efforts for the Spring season well in advance (at least 74 days) to capture early planners.
- Monitor your own booking lead times against these South Golden Beach averages to identify opportunities for dynamic pricing adjustments.
Popular & Essential Airbnb Amenities in South Golden Beach (2025)
Amenity Prevalence
Amenity Insights for South Golden Beach
- Essential amenities in South Golden Beach that guests expect include: Smoke alarm. Lacking these (this) could significantly impact bookings.
- Popular amenities like Wifi, Essentials, Hot water are common but not universal. Offering these can provide a competitive edge.
- Warning: Wifi is not universally provided but is considered essential globally. Ensure reliable Wifi is offered.
Recommendations for Hosts
- Ensure your listing includes all essential amenities for South Golden Beach: Smoke alarm.
- Prioritize adding missing essentials: Smoke alarm.
- Consider adding popular differentiators like Wifi or Essentials to increase appeal.
- Highlight unique or less common amenities you offer (e.g., hot tub, dedicated workspace, EV charger) in your listing description and photos.
- Regularly check competitor amenities in South Golden Beach to stay competitive.
South Golden Beach Airbnb Guest Demographics & Profile Analysis (2025)
Guest Profile Summary for South Golden Beach
- The typical guest profile for Airbnb in South Golden Beach consists of primarily domestic travelers (85%), often arriving from nearby Brisbane, typically belonging to the Post-2000s (Gen Z/Alpha) group (50%), primarily speaking English or French.
- Domestic travelers account for 85.3% of guests.
- Key international markets include Australia (85.3%) and United Kingdom (3.6%).
- Top languages spoken are English (63.2%) followed by French (8%).
- A significant demographic segment is the Post-2000s (Gen Z/Alpha) group, representing 50% of guests.
Recommendations for Hosts
- Target domestic marketing efforts towards travelers from Brisbane and Sydney.
- Tailor amenities and listing descriptions to appeal to the dominant Post-2000s (Gen Z/Alpha) demographic (e.g., highlight fast WiFi, smart home features, local guides).
- Highlight unique local experiences or amenities relevant to the primary guest profile.
- Consider seasonal promotions aligned with peak travel times for key origin markets.
Nearby Short-Term Rental Market Comparison
How does the South Golden Beach Airbnb market stack up against its neighbors? Compare key performance metrics like average monthly revenue, ADR, and occupancy rates in surrounding areas to understand the broader regional STR landscape.
| Market | Active Properties | Monthly Revenue | Daily Rate | Avg. Occupancy |
|---|---|---|---|---|
| Byron Bay | 952 | $4,207 | $425.18 | 43% |
| Byron Shire Council | 206 | $3,945 | $428.48 | 42% |
| Ewingsdale | 67 | $3,804 | $487.49 | 37% |
| Kingscliff | 336 | $3,683 | $376.49 | 41% |
| Casuarina Beach | 138 | $3,646 | $407.62 | 42% |
| Clunes | 18 | $3,531 | $285.32 | 41% |
| Uki | 14 | $3,492 | $275.12 | 40% |
| Gold Coast City | 5,526 | $3,362 | $265.25 | 51% |
| Bogangar | 117 | $3,299 | $350.07 | 42% |
| Scenic Rim Regional | 284 | $3,224 | $243.05 | 46% |