Shoalhaven City Council Airbnb Market Analysis 2025: Short Term Rental Data & Vacation Rental Statistics in New South Wales, Australia
Is Airbnb profitable in Shoalhaven City Council in 2025? Explore comprehensive Airbnb analytics for Shoalhaven City Council, New South Wales, Australia to uncover income potential. This 2025 STR market report for Shoalhaven City Council, based on AirROI data from April 2024 to March 2025, reveals key trends in the bustling market of 1,122 active listings.
Whether you're considering an Airbnb investment in Shoalhaven City Council, optimizing your existing vacation rental, or exploring rental arbitrage opportunities, understanding the Shoalhaven City Council Airbnb data is crucial. Navigating the high regulation landscape is key to maximizing your short term rental income potential. Let's dive into the specifics.
Key Shoalhaven City Council Airbnb Performance Metrics Overview
Monthly Airbnb Revenue Variations & Income Potential in Shoalhaven City Council (2025)
Understanding the monthly revenue variations for Airbnb listings in Shoalhaven City Council is key to maximizing your short term rental income potential. Seasonality significantly impacts earnings. Our analysis, based on data from the past 12 months, shows that the peak revenue month for STRs in Shoalhaven City Council is typically January, while August often presents the lowest earnings, highlighting opportunities for strategic pricing adjustments during shoulder and low seasons. Explore the typical Airbnb income in Shoalhaven City Council across different performance tiers:
- Best-in-class properties (Top 10%) achieve $9,898+ monthly, often utilizing dynamic pricing and superior guest experiences.
- Strong performing properties (Top 25%) earn $5,673 or more, indicating effective management and desirable locations/amenities.
- Typical properties (Median) generate around $2,959 per month, representing the average market performance.
- Entry-level properties (Bottom 25%) see earnings around $1,457, often with potential for optimization.
Average Monthly Airbnb Earnings Trend in Shoalhaven City Council
Shoalhaven City Council Airbnb Occupancy Rate Trends (2025)
Maximize your bookings by understanding the Shoalhaven City Council STR occupancy trends. Seasonal demand shifts significantly influence how often properties are booked. Typically, Januarysees the highest demand (peak season occupancy), while June experiences the lowest (low season). Effective strategies, like adjusting minimum stays or offering promotions, can boost occupancy during slower periods. Here's how different property tiers perform in Shoalhaven City Council:
- Best-in-class properties (Top 10%) achieve 74%+ occupancy, indicating high desirability and potentially optimized availability.
- Strong performing properties (Top 25%) maintain 52% or higher occupancy, suggesting good market fit and guest satisfaction.
- Typical properties (Median) have an occupancy rate around 31%.
- Entry-level properties (Bottom 25%) average 16% occupancy, potentially facing higher vacancy.
Average Monthly Occupancy Rate Trend in Shoalhaven City Council
Average Daily Rate (ADR) Airbnb Trends in Shoalhaven City Council (2025)
Effective short term rental pricing strategy in Shoalhaven City Council involves understanding monthly ADR fluctuations. The Average Daily Rate (ADR) for Airbnb in Shoalhaven City Council typically peaks in January and dips lowest during August. Leveraging Airbnb dynamic pricing tools or strategies based on this seasonality can significantly boost revenue. Here's a look at the typical nightly rates achieved:
- Best-in-class properties (Top 10%) command rates of $688+ per night, often due to premium features or locations.
- Strong performing properties (Top 25%) achieve nightly rates of $467 or more.
- Typical properties (Median) charge around $313 per night.
- Entry-level properties (Bottom 25%) earn around $201 per night.
Average Daily Rate (ADR) Trend by Month in Shoalhaven City Council
Get Live Shoalhaven City Council Market Intelligence 👇

Explore Real-time Analytics
Airbnb Seasonality Analysis & Trends in Shoalhaven City Council (2025)
Peak Season (January, December, April)
- Revenue averages $6,213 per month
- Occupancy rates average 45.1%
- Daily rates average $411
Shoulder Season
- Revenue averages $4,003 per month
- Occupancy maintains around 34.0%
- Daily rates hold near $364
Low Season (March, August, September)
- Revenue drops to average $3,332 per month
- Occupancy decreases to average 31.3%
- Daily rates adjust to average $357
Seasonality Insights for Shoalhaven City Council
- The Airbnb seasonality in Shoalhaven City Council shows highly seasonal trends requiring careful strategy. While the sections above show seasonal averages, it's also insightful to look at the extremes:
- During the high season, the absolute peak month showcases Shoalhaven City Council's highest earning potential, with monthly revenues capable of climbing to $7,264, occupancy reaching a high of 54.1%, and ADRs peaking at $442.
- Conversely, the slowest single month of the year, typically falling within the low season, marks the market's lowest point. In this month, revenue might dip to $3,053, occupancy could drop to 29.0%, and ADRs may adjust down to $338.
- Understanding both the seasonal averages and these monthly peaks and troughs in revenue, occupancy, and ADR is crucial for maximizing your Airbnb profit potential in Shoalhaven City Council.
Seasonal Strategies for Maximizing Profit
- Peak Season: Maximize revenue through premium pricing and potentially longer minimum stays. Ensure high availability.
- Low Season: Offer competitive pricing, special promotions (e.g., extended stay discounts), and flexible cancellation policies. Target off-season travelers like remote workers or budget-conscious guests.
- Shoulder Seasons: Implement dynamic pricing that balances peak and low rates. Target weekend travelers or specific events. Offer slightly more flexible terms than peak season.
- Regularly analyze your own performance against these Shoalhaven City Council seasonality benchmarks and adjust your pricing and availability strategy accordingly.
Best Areas for Airbnb Investment in Shoalhaven City Council (2025)
Exploring the top neighborhoods for short-term rentals in Shoalhaven City Council? This section highlights key areas, outlining why they are attractive for hosts and guests, along with notable local attractions. Consider these locations based on your target guest profile and investment strategy.
| Neighborhood / Area | Why Host Here? (Target Guests & Appeal) | Key Attractions & Landmarks |
|---|---|---|
| Ulladulla | A picturesque coastal town known for its stunning beaches, fishing spots, and vibrant local community. It attracts tourists looking for beach activities and nature experiences. | Ulladulla Harbour, Mollymook Beach, Booderee National Park, Historic Ulladulla Lighthouse, Racecourse Beach |
| Nowra | The thriving regional hub of the Shoalhaven region, offering a mix of urban conveniences and natural beauty. It is popular with families and offers easy access to both coastal attractions and hinterland parks. | Shoalhaven River, Nowra Botanic Gardens, Meroo National Park, Shoalhaven Zoo, Bendt Distillery |
| Jervis Bay | Famous for its white sand beaches and clear turquoise waters, Jervis Bay is a major draw for beach lovers and nature enthusiasts. It’s ideal for eco-tourism and relaxation. | Hyams Beach, Booderee National Park, Jervis Bay Marine Park, Seals at Bowen Island, Cape St George Lighthouse |
| Berry | A charming rural town known for its historic buildings, boutiques, and the adjacent wineries. Berry is a favorite for weekend getaways and is popular with couples. | Berry Historic Museum, Berry Markets, Seven Mile Beach, Mountain Ridge Winery, Berry Island |
| Huskisson | A vibrant coastal township on the shores of Jervis Bay. This area is popular for water-based activities such as dolphin watching and boating. | Huskisson Beach, Jervis Bay Marine Park, Dolphin Watch Cruises, White Sands Walk, Shoalhaven Heads |
| Milton | A quaint historical village known for its galleries, boutique shops, and beautiful natural surroundings. It's a great spot for art enthusiasts and those looking for a relaxed atmosphere. | Milton Theatre, Newton's View, Pigeonhouse Mountain, Milton Village, Local Art Galleries |
| Kiama | Famous for its blowhole and stunning coastal scenery, Kiama is a popular spot for tourists seeking seaside experiences and picturesque landscapes. | Kiama Blowhole, Little Blowhole, Kiama Coast Walk, Kiama Lighthouse, Surf Beach |
| Cambewarra | Sleeper spot in the Shoalhaven offering stunning views and peaceful rural living. It's perfect for nature lovers and those who want a retreat away from the busy tourist areas. | Cambewarra Mountain Lookout, Booderee National Park, Cambewarra Estate Winery, Riverside Gardens, Shoalhaven Zoo |
Understanding Airbnb License Requirements & STR Laws in Shoalhaven City Council (2025)
Yes, Shoalhaven City Council, New South Wales, Australia enforces high STR regulations. Obtaining a license and ensuring compliance is almost certainly required according to current 2025 STR laws. Always verify the latest short term rental regulations and Airbnb license requirements directly with local government authorities for Shoalhaven City Council to ensure full compliance before hosting.
(Source: AirROI data, 2025, based on 88% licensed listings)
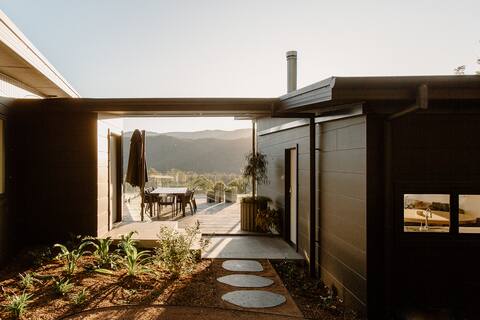
Top Performing Airbnb Properties in Shoalhaven City Council (2025)
Benchmark your potential! Explore examples of top-performing Airbnb properties in Shoalhaven City Councilbased on Trailing Twelve Month (TTM) revenue. Analyze their characteristics, revenue, occupancy rate, and ADR to understand what drives success in this market.

Sea La Vie - Fireplace with Swimming Pool & Spa
Entire Place • 4 bedrooms
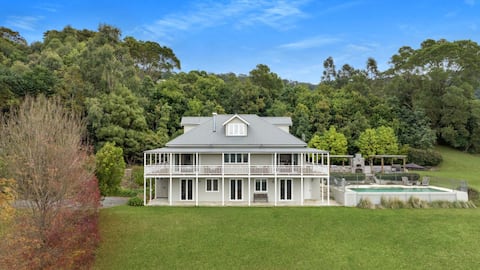
Eagles Rise - Classically Designed Country Home
Entire Place • 5 bedrooms
'Rea Rea Lodge' - Kangaroo Valley
Entire Place • 5 bedrooms

Whispering Pines, Berry & Surrounds
Entire Place • 6 bedrooms
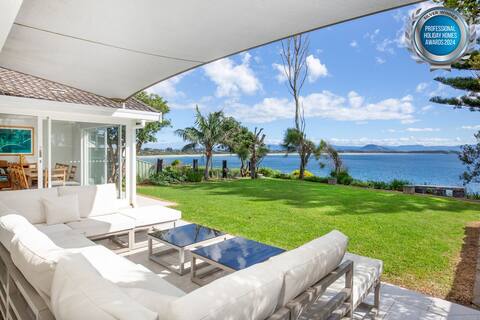
Karelda - Pet Friendly - Absolute Waterfront
Entire Place • 4 bedrooms
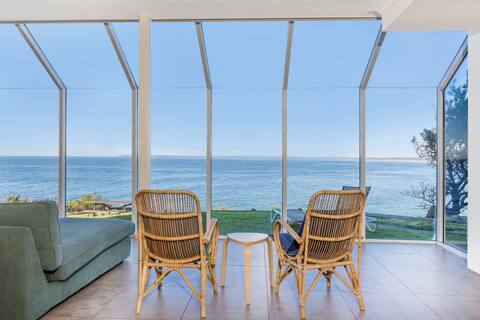
Neptune - Absolute Beachfront - Stunning Views
Entire Place • 5 bedrooms
Note: Performance varies based on location, size, amenities, seasonality, and management quality. Data reflects the past 12 months.
Top Performing Airbnb Hosts in Shoalhaven City Council (2025)
Learn from the best! This table showcases top-performing Airbnb hosts in Shoalhaven City Council based on the number of properties managed and estimated total revenue over the past year. Analyze their scale and performance metrics.
| Host Name | Properties | Grossing Revenue | Stay Reviews | Avg Rating |
|---|---|---|---|---|
| Professional Holiday Homes | 92 | $7,156,162 | 3581 | 4.68/5.0 |
| Where We Escape | 64 | $3,499,294 | 650 | 3.70/5.0 |
| McGrath | 79 | $2,243,381 | 1164 | 4.07/5.0 |
| Holiday Rental Specialists | 55 | $2,125,257 | 1075 | 4.18/5.0 |
| Berry Getaways | 15 | $1,451,488 | 242 | 4.18/5.0 |
| Platinum Escapes Holiday Manag | 48 | $1,391,639 | 432 | 3.98/5.0 |
| Kangaroo Valley Escapes | 18 | $1,210,323 | 358 | 3.97/5.0 |
| Rob & Bede | 6 | $923,684 | 59 | 4.96/5.0 |
| The Holidays Collection | 10 | $911,175 | 179 | 3.83/5.0 |
| Kangaroo Valley Getaways | 21 | $783,260 | 821 | 4.60/5.0 |
Analyzing the strategies of top hosts, such as their property selection, pricing, and guest communication, can offer valuable lessons for optimizing your own Airbnb operations in Shoalhaven City Council.
Dive Deeper: Advanced Shoalhaven City Council STR Market Data (2025)
Ready to unlock more insights? AirROI provides access to advanced metrics and comprehensive Airbnb data for Shoalhaven City Council. Explore detailed analytics beyond this report to refine your investment strategy, optimize pricing, and maximize your vacation rental profits.
Explore Advanced MetricsShoalhaven City Council Short-Term Rental Market Composition (2025): Property & Room Types
Room Type Distribution
Property Type Distribution
Market Composition Insights for Shoalhaven City Council
- The Shoalhaven City Council Airbnb market composition is heavily skewed towards Entire Home/Apt listings, which make up 98% of the 1,122 active rentals. This indicates strong guest preference for privacy and space.
- Looking at the property type distribution in Shoalhaven City Council, House properties are the most common (80.6%), reflecting the local real estate landscape.
- Houses represent a significant 80.6% portion, catering likely to families or larger groups.
- Smaller segments like hotel/boutique, others, unique stays (combined 6.6%) offer potential for unique stay experiences.
Shoalhaven City Council Airbnb Room Capacity Analysis (2025): Bedroom Distribution
Distribution of Listings by Number of Bedrooms
Room Capacity Insights for Shoalhaven City Council
- The dominant room capacity in Shoalhaven City Council is 3 bedrooms listings, making up 28.7% of the market. This suggests a strong demand for properties suitable for families or small groups.
- Together, 3 bedrooms and 4 bedrooms properties represent 53.3% of the active Airbnb listings in Shoalhaven City Council, indicating a high concentration in these sizes.
- A significant 66.2% of listings offer 3+ bedrooms, catering to larger groups and families seeking more space in Shoalhaven City Council.
Shoalhaven City Council Vacation Rental Guest Capacity Trends (2025)
Distribution of Listings by Guest Capacity
Guest Capacity Insights for Shoalhaven City Council
- The most common guest capacity trend in Shoalhaven City Council vacation rentals is listings accommodating 8+ guests (44.7%). This suggests the primary traveler segment is likely larger groups.
- Properties designed for 8+ guests and 6 guests dominate the Shoalhaven City Council STR market, accounting for 62.5% of listings.
- 68.0% of properties accommodate 6+ guests, serving the market segment for larger families or group travel in Shoalhaven City Council.
- On average, properties in Shoalhaven City Council are equipped to host 6.1 guests.
Shoalhaven City Council Airbnb Booking Patterns (2025): Available vs. Booked Days
Available Days Distribution
Booked Days Distribution
Booking Pattern Insights for Shoalhaven City Council
- The most common availability pattern in Shoalhaven City Council falls within the 271-366 days range, representing 51.1% of listings. This suggests many properties have significant open periods on their calendars.
- Approximately 83.5% of listings show high availability (181+ days open annually), indicating potential for increased bookings or specific owner usage patterns.
- For booked days, the 91-180 days range is most frequent in Shoalhaven City Council (32.6%), reflecting common guest stay durations or potential owner blocking patterns.
- A notable 17.9% of properties secure long booking periods (181+ days booked per year), highlighting successful long-term rental strategies or significant owner usage.
Shoalhaven City Council Airbnb Minimum Stay Requirements Analysis
Distribution of Listings by Minimum Night Requirement
1 Night
70 listings
6.5% of total
2 Nights
304 listings
28.4% of total
3 Nights
94 listings
8.8% of total
4-6 Nights
69 listings
6.4% of total
7-29 Nights
10 listings
0.9% of total
30+ Nights
523 listings
48.9% of total
Key Insights
- The most prevalent minimum stay requirement in Shoalhaven City Council is 30+ Nights, adopted by 48.9% of listings. This highlights the market's preference for longer commitments.
- A significant segment (48.9%) caters to monthly stays (30+ nights) in Shoalhaven City Council, pointing to opportunities in the extended-stay market.
Recommendations
- Align with the market by considering a 30+ Nights minimum stay, as 48.9% of Shoalhaven City Council hosts use this setting.
- If feasible, allowing 1-night stays, especially midweek or during low season, could capture last-minute bookings, as only 6.5% currently do.
- Explore offering discounts for stays of 30+ nights to attract the 48.9% of the market seeking extended stays.
- Adjust minimum nights based on seasonality – potentially shorter during low season and longer during peak demand periods in Shoalhaven City Council.
Shoalhaven City Council Airbnb Cancellation Policy Trends Analysis (2025)
Super Strict 30 Days
248 listings
24.6% of total
Super Strict 60 Days
47 listings
4.7% of total
Flexible
65 listings
6.4% of total
Moderate
142 listings
14.1% of total
Firm
264 listings
26.2% of total
Strict
242 listings
24% of total
Cancellation Policy Insights for Shoalhaven City Council
- The prevailing Airbnb cancellation policy trend in Shoalhaven City Council is Firm, used by 26.2% of listings.
- A majority (50.2%) of hosts in Shoalhaven City Council utilize Firm or Strict policies, indicating a market where hosts prioritize booking security.
Recommendations for Hosts
- Consider adopting a Firm policy to align with the 26.2% market standard in Shoalhaven City Council.
- Regularly review your cancellation policy against competitors and market demand shifts in Shoalhaven City Council.
Shoalhaven City Council STR Booking Lead Time Analysis (2025)
Average Booking Lead Time by Month
Booking Lead Time Insights for Shoalhaven City Council
- The overall average booking lead time for vacation rentals in Shoalhaven City Council is 59 days.
- Guests book furthest in advance for stays during December (average 93 days), likely coinciding with peak travel demand or local events.
- The shortest booking windows occur for stays in August (average 35 days), indicating more last-minute travel plans during this time.
- Seasonally, Winter (78 days avg.) sees the longest lead times, while Summer (40 days avg.) has the shortest, reflecting typical travel planning cycles.
Recommendations for Hosts
- Use the overall average lead time (59 days) as a baseline for your pricing and availability strategy in Shoalhaven City Council.
- For December stays, consider implementing length-of-stay discounts or slightly higher rates for bookings made less than 93 days out to capitalize on advance planning.
- Target marketing efforts for the Winter season well in advance (at least 78 days) to capture early planners.
- Monitor your own booking lead times against these Shoalhaven City Council averages to identify opportunities for dynamic pricing adjustments.
Popular & Essential Airbnb Amenities in Shoalhaven City Council (2025)
Amenity Prevalence
Amenity Insights for Shoalhaven City Council
- Essential amenities in Shoalhaven City Council that guests expect include: Smoke alarm. Lacking these (this) could significantly impact bookings.
- Popular amenities like TV, Kitchen, Free parking on premises are common but not universal. Offering these can provide a competitive edge.
- Warning: Wifi is not universally provided but is considered essential globally. Ensure reliable Wifi is offered.
Recommendations for Hosts
- Ensure your listing includes all essential amenities for Shoalhaven City Council: Smoke alarm.
- Prioritize adding missing essentials: Smoke alarm.
- Consider adding popular differentiators like TV or Kitchen to increase appeal.
- Highlight unique or less common amenities you offer (e.g., hot tub, dedicated workspace, EV charger) in your listing description and photos.
- Regularly check competitor amenities in Shoalhaven City Council to stay competitive.
Shoalhaven City Council Airbnb Guest Demographics & Profile Analysis (2025)
Guest Profile Summary for Shoalhaven City Council
- The typical guest profile for Airbnb in Shoalhaven City Council consists of primarily domestic travelers (93%), often arriving from nearby Sydney, typically belonging to the Post-2000s (Gen Z/Alpha) group (50%), primarily speaking English or Spanish.
- Domestic travelers account for 92.6% of guests.
- Key international markets include Australia (92.6%) and United Kingdom (1.8%).
- Top languages spoken are English (68.9%) followed by Spanish (5.4%).
- A significant demographic segment is the Post-2000s (Gen Z/Alpha) group, representing 50% of guests.
Recommendations for Hosts
- Target domestic marketing efforts towards travelers from Sydney and New South Wales.
- Tailor amenities and listing descriptions to appeal to the dominant Post-2000s (Gen Z/Alpha) demographic (e.g., highlight fast WiFi, smart home features, local guides).
- Highlight unique local experiences or amenities relevant to the primary guest profile.
- Consider seasonal promotions aligned with peak travel times for key origin markets.
Nearby Short-Term Rental Market Comparison
How does the Shoalhaven City Council Airbnb market stack up against its neighbors? Compare key performance metrics like average monthly revenue, ADR, and occupancy rates in surrounding areas to understand the broader regional STR landscape.
| Market | Active Properties | Monthly Revenue | Daily Rate | Avg. Occupancy |
|---|---|---|---|---|
| Penrose | 12 | $6,349 | $600.00 | 42% |
| Berry | 115 | $6,185 | $540.04 | 41% |
| Jaspers Brush | 13 | $5,600 | $510.06 | 37% |
| Burrawang | 11 | $5,005 | $523.75 | 43% |
| Berrima | 44 | $4,756 | $426.34 | 42% |
| Braidwood | 20 | $4,708 | $443.62 | 40% |
| Robertson | 44 | $4,655 | $375.71 | 40% |
| Bombo | 10 | $4,613 | $503.00 | 39% |
| Exeter | 30 | $4,595 | $519.08 | 38% |
| Gerringong | 121 | $4,483 | $486.76 | 37% |