Seal Rocks Airbnb Market Analysis 2025: Short Term Rental Data & Vacation Rental Statistics in New South Wales, Australia
Is Airbnb profitable in Seal Rocks in 2025? Explore comprehensive Airbnb analytics for Seal Rocks, New South Wales, Australia to uncover income potential. This 2025 STR market report for Seal Rocks, based on AirROI data from April 2024 to March 2025, reveals key trends in the niche market of 18 active listings.
Whether you're considering an Airbnb investment in Seal Rocks, optimizing your existing vacation rental, or exploring rental arbitrage opportunities, understanding the Seal Rocks Airbnb data is crucial. Navigating the high regulation landscape is key to maximizing your short term rental income potential. Let's dive into the specifics.
Key Seal Rocks Airbnb Performance Metrics Overview
Monthly Airbnb Revenue Variations & Income Potential in Seal Rocks (2025)
Understanding the monthly revenue variations for Airbnb listings in Seal Rocks is key to maximizing your short term rental income potential. Seasonality significantly impacts earnings. Our analysis, based on data from the past 12 months, shows that the peak revenue month for STRs in Seal Rocks is typically January, while May often presents the lowest earnings, highlighting opportunities for strategic pricing adjustments during shoulder and low seasons. Explore the typical Airbnb income in Seal Rocks across different performance tiers:
- Best-in-class properties (Top 10%) achieve $8,789+ monthly, often utilizing dynamic pricing and superior guest experiences.
- Strong performing properties (Top 25%) earn $6,210 or more, indicating effective management and desirable locations/amenities.
- Typical properties (Median) generate around $4,123 per month, representing the average market performance.
- Entry-level properties (Bottom 25%) see earnings around $2,185, often with potential for optimization.
Average Monthly Airbnb Earnings Trend in Seal Rocks
Seal Rocks Airbnb Occupancy Rate Trends (2025)
Maximize your bookings by understanding the Seal Rocks STR occupancy trends. Seasonal demand shifts significantly influence how often properties are booked. Typically, Januarysees the highest demand (peak season occupancy), while May experiences the lowest (low season). Effective strategies, like adjusting minimum stays or offering promotions, can boost occupancy during slower periods. Here's how different property tiers perform in Seal Rocks:
- Best-in-class properties (Top 10%) achieve 67%+ occupancy, indicating high desirability and potentially optimized availability.
- Strong performing properties (Top 25%) maintain 53% or higher occupancy, suggesting good market fit and guest satisfaction.
- Typical properties (Median) have an occupancy rate around 33%.
- Entry-level properties (Bottom 25%) average 19% occupancy, potentially facing higher vacancy.
Average Monthly Occupancy Rate Trend in Seal Rocks
Average Daily Rate (ADR) Airbnb Trends in Seal Rocks (2025)
Effective short term rental pricing strategy in Seal Rocks involves understanding monthly ADR fluctuations. The Average Daily Rate (ADR) for Airbnb in Seal Rocks typically peaks in January and dips lowest during July. Leveraging Airbnb dynamic pricing tools or strategies based on this seasonality can significantly boost revenue. Here's a look at the typical nightly rates achieved:
- Best-in-class properties (Top 10%) command rates of $644+ per night, often due to premium features or locations.
- Strong performing properties (Top 25%) achieve nightly rates of $573 or more.
- Typical properties (Median) charge around $399 per night.
- Entry-level properties (Bottom 25%) earn around $293 per night.
Average Daily Rate (ADR) Trend by Month in Seal Rocks
Get Live Seal Rocks Market Intelligence 👇

Explore Real-time Analytics
Airbnb Seasonality Analysis & Trends in Seal Rocks (2025)
Peak Season (January, December, April)
- Revenue averages $7,287 per month
- Occupancy rates average 48.2%
- Daily rates average $464
Shoulder Season
- Revenue averages $4,210 per month
- Occupancy maintains around 38.4%
- Daily rates hold near $421
Low Season (May, June, August)
- Revenue drops to average $2,318 per month
- Occupancy decreases to average 24.7%
- Daily rates adjust to average $402
Seasonality Insights for Seal Rocks
- The Airbnb seasonality in Seal Rocks shows highly seasonal trends requiring careful strategy. While the sections above show seasonal averages, it's also insightful to look at the extremes:
- During the high season, the absolute peak month showcases Seal Rocks's highest earning potential, with monthly revenues capable of climbing to $8,331, occupancy reaching a high of 50.7%, and ADRs peaking at $486.
- Conversely, the slowest single month of the year, typically falling within the low season, marks the market's lowest point. In this month, revenue might dip to $1,741, occupancy could drop to 20.3%, and ADRs may adjust down to $398.
- Understanding both the seasonal averages and these monthly peaks and troughs in revenue, occupancy, and ADR is crucial for maximizing your Airbnb profit potential in Seal Rocks.
Seasonal Strategies for Maximizing Profit
- Peak Season: Maximize revenue through premium pricing and potentially longer minimum stays. Ensure high availability.
- Low Season: Offer competitive pricing, special promotions (e.g., extended stay discounts), and flexible cancellation policies. Target off-season travelers like remote workers or budget-conscious guests.
- Shoulder Seasons: Implement dynamic pricing that balances peak and low rates. Target weekend travelers or specific events. Offer slightly more flexible terms than peak season.
- Regularly analyze your own performance against these Seal Rocks seasonality benchmarks and adjust your pricing and availability strategy accordingly.
Best Areas for Airbnb Investment in Seal Rocks (2025)
Exploring the top neighborhoods for short-term rentals in Seal Rocks? This section highlights key areas, outlining why they are attractive for hosts and guests, along with notable local attractions. Consider these locations based on your target guest profile and investment strategy.
| Neighborhood / Area | Why Host Here? (Target Guests & Appeal) | Key Attractions & Landmarks |
|---|---|---|
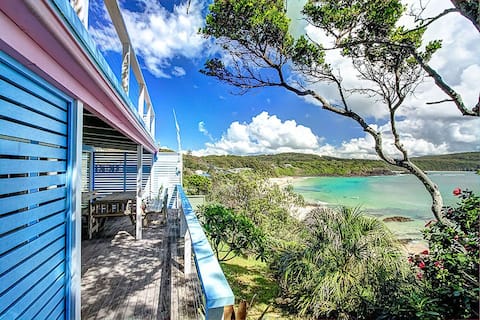
| Seal Rocks Beach | A stunning beachside location known for its beautiful landscapes and pristine beaches. Ideal for those seeking a tranquil getaway close to nature and water activities. | Seal Rocks Beach, Sugarloaf Point Lighthouse, Myall Lakes National Park, One Mile Beach, Stockton Beach |
| Blueys Beach | Known for its surf-friendly waves and scenic charm, Blueys Beach is a popular choice for families and surfers alike, offering a laid-back coastal vibe with local cafes and shops. | Blueys Beach, Blueys General Store, Boatshed Blueys, Camping at Blueys Beach, Nearby hiking trails |
| Foster | A nearby town that provides a more urban feel while still being close to the coast. It offers a range of amenities, shops, and access to beautiful lakes and beaches. | Foster Main Beach, Wallis Lake, Local Markets, Great Lakes Cinema, Nature Parks |
| Elizabeth Beach | A serene beach area perfect for relaxation and water sports like swimming and paddleboarding. Attracts vacationers looking for peace and scenic views. | Elizabeth Beach, Elizabeth Beach Surf Club, Local Cafes, Walking Trails, Dolphin Watching |
| Forster-Tuncurry | This twin town is known for its vibrant atmosphere and recreational activities, making it a great spot for families and group vacations, with access to a variety of outdoor activities. | Forster Main Beach, Tuncurry Beach, Forster Ocean Baths, Wallis Lake Cruises, Forster-Tuncurry Golf Club |
| Myall Lakes National Park | A beautiful natural reserve known for its lakes and wildlife. Appeals to nature enthusiasts and eco-tourists looking for adventures in an unspoiled environment. | Myall Lakes, Bennett's Beach, Bird Watching, Kayaking, Camping Sites |
| Pacific Palms | A popular destination for both locals and tourists, featuring stunning beaches and a relaxed atmosphere. Perfect for beach lovers and adventure seekers. | Jimmy's Beach, Sandy Point, Pacific Palms Aquatic Centre, Local Art Galleries, Surfing and Fishing Spots |
| Booti Booti National Park | A unique natural park offering diverse landscapes from beaches to forests, ideal for hikers and nature lovers seeking an immersive outdoor experience. | Booti Booti National Park Trails, Elizabeth Beach Lookout, Bird Watching, Fishing Spots, Scenic Picnic Areas |
Understanding Airbnb License Requirements & STR Laws in Seal Rocks (2025)
Yes, Seal Rocks, New South Wales, Australia enforces high STR regulations. Obtaining a license and ensuring compliance is almost certainly required according to current 2025 STR laws. Always verify the latest short term rental regulations and Airbnb license requirements directly with local government authorities for Seal Rocks to ensure full compliance before hosting.
(Source: AirROI data, 2025, based on 94% licensed listings)
Top Performing Airbnb Properties in Seal Rocks (2025)
Benchmark your potential! Explore examples of top-performing Airbnb properties in Seal Rocksbased on Trailing Twelve Month (TTM) revenue. Analyze their characteristics, revenue, occupancy rate, and ADR to understand what drives success in this market.
The Shack
Entire Place • 3 bedrooms
Fishcakes bohemian living in Seal Rocks
Entire Place • 3 bedrooms
Cair Paravel at Seal Rocks
Entire Place • 4 bedrooms
Surf Shack @ Boat Beach
Entire Place • 3 bedrooms
Carinya Beach House - stunning views & speedy wifi
Entire Place • 3 bedrooms
Sea Shack
Entire Place • 2 bedrooms
Note: Performance varies based on location, size, amenities, seasonality, and management quality. Data reflects the past 12 months.
Top Performing Airbnb Hosts in Seal Rocks (2025)
Learn from the best! This table showcases top-performing Airbnb hosts in Seal Rocks based on the number of properties managed and estimated total revenue over the past year. Analyze their scale and performance metrics.
| Host Name | Properties | Grossing Revenue | Stay Reviews | Avg Rating |
|---|---|---|---|---|
| Pacific Palms | 8 | $383,760 | 251 | 4.68/5.0 |
| Shannan | 1 | $82,333 | 52 | 4.77/5.0 |
| Wayne | 1 | $59,449 | 86 | 4.99/5.0 |
| Lucinda | 1 | $53,982 | 144 | 4.85/5.0 |
| Phillipa | 1 | $51,405 | 10 | 4.80/5.0 |
| Jaeson | 1 | $43,099 | 98 | 4.93/5.0 |
| Host #46432278 | 1 | $32,410 | 17 | 5.00/5.0 |
| Christine | 1 | $29,954 | 161 | 4.94/5.0 |
| Pacific Palms | 1 | $28,465 | 13 | 4.23/5.0 |
| William | 1 | $16,828 | 21 | 4.86/5.0 |
Analyzing the strategies of top hosts, such as their property selection, pricing, and guest communication, can offer valuable lessons for optimizing your own Airbnb operations in Seal Rocks.
Dive Deeper: Advanced Seal Rocks STR Market Data (2025)
Ready to unlock more insights? AirROI provides access to advanced metrics and comprehensive Airbnb data for Seal Rocks. Explore detailed analytics beyond this report to refine your investment strategy, optimize pricing, and maximize your vacation rental profits.
Explore Advanced MetricsSeal Rocks Short-Term Rental Market Composition (2025): Property & Room Types
Room Type Distribution
Property Type Distribution
Market Composition Insights for Seal Rocks
- The Seal Rocks Airbnb market composition is heavily skewed towards Entire Home/Apt listings, which make up 100% of the 18 active rentals. This indicates strong guest preference for privacy and space.
- Looking at the property type distribution in Seal Rocks, House properties are the most common (94.4%), reflecting the local real estate landscape.
- Houses represent a significant 94.4% portion, catering likely to families or larger groups.
- The presence of 5.6% Hotel/Boutique listings indicates integration with traditional hospitality.
Seal Rocks Airbnb Room Capacity Analysis (2025): Bedroom Distribution
Distribution of Listings by Number of Bedrooms
Room Capacity Insights for Seal Rocks
- The dominant room capacity in Seal Rocks is 3 bedrooms listings, making up 55.6% of the market. This suggests a strong demand for properties suitable for families or small groups.
- Together, 3 bedrooms and 4 bedrooms properties represent 88.9% of the active Airbnb listings in Seal Rocks, indicating a high concentration in these sizes.
- A significant 88.9% of listings offer 3+ bedrooms, catering to larger groups and families seeking more space in Seal Rocks.
Seal Rocks Vacation Rental Guest Capacity Trends (2025)
Distribution of Listings by Guest Capacity
Guest Capacity Insights for Seal Rocks
- The most common guest capacity trend in Seal Rocks vacation rentals is listings accommodating 8+ guests (55.6%). This suggests the primary traveler segment is likely larger groups.
- Properties designed for 8+ guests and 6 guests dominate the Seal Rocks STR market, accounting for 77.8% of listings.
- 88.9% of properties accommodate 6+ guests, serving the market segment for larger families or group travel in Seal Rocks.
- On average, properties in Seal Rocks are equipped to host 7.1 guests.
Seal Rocks Airbnb Booking Patterns (2025): Available vs. Booked Days
Available Days Distribution
Booked Days Distribution
Booking Pattern Insights for Seal Rocks
- The most common availability pattern in Seal Rocks falls within the 271-366 days range, representing 44.4% of listings. This suggests many properties have significant open periods on their calendars.
- Approximately 88.8% of listings show high availability (181+ days open annually), indicating potential for increased bookings or specific owner usage patterns.
- For booked days, the 91-180 days range is most frequent in Seal Rocks (44.4%), reflecting common guest stay durations or potential owner blocking patterns.
- A notable 16.7% of properties secure long booking periods (181+ days booked per year), highlighting successful long-term rental strategies or significant owner usage.
Seal Rocks Airbnb Minimum Stay Requirements Analysis
Distribution of Listings by Minimum Night Requirement
2 Nights
2 listings
11.8% of total
3 Nights
4 listings
23.5% of total
4-6 Nights
1 listings
5.9% of total
30+ Nights
10 listings
58.8% of total
Key Insights
- The most prevalent minimum stay requirement in Seal Rocks is 30+ Nights, adopted by 58.8% of listings. This highlights the market's preference for longer commitments.
- Very short stays (1-2 nights) are less common (11.8%), suggesting hosts prefer slightly longer bookings to optimize turnover.
- A significant segment (58.8%) caters to monthly stays (30+ nights) in Seal Rocks, pointing to opportunities in the extended-stay market.
Recommendations
- Align with the market by considering a 30+ Nights minimum stay, as 58.8% of Seal Rocks hosts use this setting.
- Explore offering discounts for stays of 30+ nights to attract the 58.8% of the market seeking extended stays.
- Adjust minimum nights based on seasonality – potentially shorter during low season and longer during peak demand periods in Seal Rocks.
Seal Rocks Airbnb Cancellation Policy Trends Analysis (2025)
Super Strict 60 Days
9 listings
50% of total
Moderate
1 listings
5.6% of total
Firm
3 listings
16.7% of total
Strict
5 listings
27.8% of total
Cancellation Policy Insights for Seal Rocks
- The prevailing Airbnb cancellation policy trend in Seal Rocks is Super Strict 60 Days, used by 50% of listings.
- There's a relatively balanced mix between guest-friendly (5.6%) and stricter (44.5%) policies, offering choices for different guest needs.
Recommendations for Hosts
- Consider adopting a Super Strict 60 Days policy to align with the 50% market standard in Seal Rocks.
- Regularly review your cancellation policy against competitors and market demand shifts in Seal Rocks.
Seal Rocks STR Booking Lead Time Analysis (2025)
Average Booking Lead Time by Month
Booking Lead Time Insights for Seal Rocks
- The overall average booking lead time for vacation rentals in Seal Rocks is 105 days.
- Guests book furthest in advance for stays during December (average 191 days), likely coinciding with peak travel demand or local events.
- The shortest booking windows occur for stays in July (average 51 days), indicating more last-minute travel plans during this time.
- Seasonally, Winter (154 days avg.) sees the longest lead times, while Summer (66 days avg.) has the shortest, reflecting typical travel planning cycles.
Recommendations for Hosts
- Use the overall average lead time (105 days) as a baseline for your pricing and availability strategy in Seal Rocks.
- For December stays, consider implementing length-of-stay discounts or slightly higher rates for bookings made less than 191 days out to capitalize on advance planning.
- Target marketing efforts for the Winter season well in advance (at least 154 days) to capture early planners.
- Monitor your own booking lead times against these Seal Rocks averages to identify opportunities for dynamic pricing adjustments.
Popular & Essential Airbnb Amenities in Seal Rocks (2025)
Amenity Prevalence
Amenity Insights for Seal Rocks
- Essential amenities in Seal Rocks that guests expect include: Kitchen, Hot water, Free parking on premises, Smoke alarm. Lacking these (any) could significantly impact bookings.
- Popular amenities like Washer, Cooking basics, Dishes and silverware are common but not universal. Offering these can provide a competitive edge.
Recommendations for Hosts
- Ensure your listing includes all essential amenities for Seal Rocks: Kitchen, Hot water, Free parking on premises, Smoke alarm.
- Consider adding popular differentiators like Washer or Cooking basics to increase appeal.
- Highlight unique or less common amenities you offer (e.g., hot tub, dedicated workspace, EV charger) in your listing description and photos.
- Regularly check competitor amenities in Seal Rocks to stay competitive.
Seal Rocks Airbnb Guest Demographics & Profile Analysis (2025)
Guest Profile Summary for Seal Rocks
- The typical guest profile for Airbnb in Seal Rocks consists of primarily domestic travelers (93%), often arriving from nearby Sydney, typically belonging to the Post-2000s (Gen Z/Alpha) group (50%), primarily speaking English or French.
- Domestic travelers account for 93.3% of guests.
- Key international markets include Australia (93.3%) and United States (2.9%).
- Top languages spoken are English (73.1%) followed by French (7.7%).
- A significant demographic segment is the Post-2000s (Gen Z/Alpha) group, representing 50% of guests.
Recommendations for Hosts
- Target domestic marketing efforts towards travelers from Sydney and Newcastle.
- Tailor amenities and listing descriptions to appeal to the dominant Post-2000s (Gen Z/Alpha) demographic (e.g., highlight fast WiFi, smart home features, local guides).
- Highlight unique local experiences or amenities relevant to the primary guest profile.
- Consider seasonal promotions aligned with peak travel times for key origin markets.
Nearby Short-Term Rental Market Comparison
How does the Seal Rocks Airbnb market stack up against its neighbors? Compare key performance metrics like average monthly revenue, ADR, and occupancy rates in surrounding areas to understand the broader regional STR landscape.
| Market | Active Properties | Monthly Revenue | Daily Rate | Avg. Occupancy |
|---|---|---|---|---|
| Green Point | 16 | $4,869 | $360.27 | 48% |
| Dora Creek | 17 | $4,613 | $370.02 | 45% |
| Singleton Council | 154 | $4,304 | $517.74 | 32% |
| Nulkaba | 37 | $4,242 | $524.17 | 30% |
| Broke | 58 | $4,084 | $448.99 | 32% |
| Branxton | 17 | $4,019 | $399.77 | 32% |
| Cessnock | 493 | $3,878 | $416.89 | 35% |
| Coomba Park | 31 | $3,858 | $395.11 | 39% |
| Millfield | 29 | $3,809 | $385.13 | 35% |
| Cessnock City Council | 127 | $3,776 | $436.62 | 35% |