Orange City Council Airbnb Market Analysis 2025: Short Term Rental Data & Vacation Rental Statistics in New South Wales, Australia
Is Airbnb profitable in Orange City Council in 2025? Explore comprehensive Airbnb analytics for Orange City Council, New South Wales, Australia to uncover income potential. This 2025 STR market report for Orange City Council, based on AirROI data from April 2024 to March 2025, reveals key trends in the niche market of 23 active listings.
Whether you're considering an Airbnb investment in Orange City Council, optimizing your existing vacation rental, or exploring rental arbitrage opportunities, understanding the Orange City Council Airbnb data is crucial. Navigating the high regulation landscape is key to maximizing your short term rental income potential. Let's dive into the specifics.
Key Orange City Council Airbnb Performance Metrics Overview
Monthly Airbnb Revenue Variations & Income Potential in Orange City Council (2025)
Understanding the monthly revenue variations for Airbnb listings in Orange City Council is key to maximizing your short term rental income potential. Seasonality significantly impacts earnings. Our analysis, based on data from the past 12 months, shows that the peak revenue month for STRs in Orange City Council is typically April, while November often presents the lowest earnings, highlighting opportunities for strategic pricing adjustments during shoulder and low seasons. Explore the typical Airbnb income in Orange City Council across different performance tiers:
- Best-in-class properties (Top 10%) achieve $7,299+ monthly, often utilizing dynamic pricing and superior guest experiences.
- Strong performing properties (Top 25%) earn $3,524 or more, indicating effective management and desirable locations/amenities.
- Typical properties (Median) generate around $2,145 per month, representing the average market performance.
- Entry-level properties (Bottom 25%) see earnings around $1,201, often with potential for optimization.
Average Monthly Airbnb Earnings Trend in Orange City Council
Orange City Council Airbnb Occupancy Rate Trends (2025)
Maximize your bookings by understanding the Orange City Council STR occupancy trends. Seasonal demand shifts significantly influence how often properties are booked. Typically, Octobersees the highest demand (peak season occupancy), while November experiences the lowest (low season). Effective strategies, like adjusting minimum stays or offering promotions, can boost occupancy during slower periods. Here's how different property tiers perform in Orange City Council:
- Best-in-class properties (Top 10%) achieve 77%+ occupancy, indicating high desirability and potentially optimized availability.
- Strong performing properties (Top 25%) maintain 57% or higher occupancy, suggesting good market fit and guest satisfaction.
- Typical properties (Median) have an occupancy rate around 40%.
- Entry-level properties (Bottom 25%) average 20% occupancy, potentially facing higher vacancy.
Average Monthly Occupancy Rate Trend in Orange City Council
Average Daily Rate (ADR) Airbnb Trends in Orange City Council (2025)
Effective short term rental pricing strategy in Orange City Council involves understanding monthly ADR fluctuations. The Average Daily Rate (ADR) for Airbnb in Orange City Council typically peaks in October and dips lowest during February. Leveraging Airbnb dynamic pricing tools or strategies based on this seasonality can significantly boost revenue. Here's a look at the typical nightly rates achieved:
- Best-in-class properties (Top 10%) command rates of $651+ per night, often due to premium features or locations.
- Strong performing properties (Top 25%) achieve nightly rates of $266 or more.
- Typical properties (Median) charge around $146 per night.
- Entry-level properties (Bottom 25%) earn around $104 per night.
Average Daily Rate (ADR) Trend by Month in Orange City Council
Get Live Orange City Council Market Intelligence 👇

Explore Real-time Analytics
Airbnb Seasonality Analysis & Trends in Orange City Council (2025)
Peak Season (April, October, July)
- Revenue averages $3,922 per month
- Occupancy rates average 51.4%
- Daily rates average $250
Shoulder Season
- Revenue averages $2,988 per month
- Occupancy maintains around 40.8%
- Daily rates hold near $238
Low Season (February, March, November)
- Revenue drops to average $2,281 per month
- Occupancy decreases to average 36.0%
- Daily rates adjust to average $234
Seasonality Insights for Orange City Council
- The Airbnb seasonality in Orange City Council shows highly seasonal trends requiring careful strategy. While the sections above show seasonal averages, it's also insightful to look at the extremes:
- During the high season, the absolute peak month showcases Orange City Council's highest earning potential, with monthly revenues capable of climbing to $4,251, occupancy reaching a high of 52.6%, and ADRs peaking at $255.
- Conversely, the slowest single month of the year, typically falling within the low season, marks the market's lowest point. In this month, revenue might dip to $1,801, occupancy could drop to 31.5%, and ADRs may adjust down to $227.
- Understanding both the seasonal averages and these monthly peaks and troughs in revenue, occupancy, and ADR is crucial for maximizing your Airbnb profit potential in Orange City Council.
Seasonal Strategies for Maximizing Profit
- Peak Season: Maximize revenue through premium pricing and potentially longer minimum stays. Ensure high availability.
- Low Season: Offer competitive pricing, special promotions (e.g., extended stay discounts), and flexible cancellation policies. Target off-season travelers like remote workers or budget-conscious guests.
- Shoulder Seasons: Implement dynamic pricing that balances peak and low rates. Target weekend travelers or specific events. Offer slightly more flexible terms than peak season.
- Regularly analyze your own performance against these Orange City Council seasonality benchmarks and adjust your pricing and availability strategy accordingly.
Best Areas for Airbnb Investment in Orange City Council (2025)
Exploring the top neighborhoods for short-term rentals in Orange City Council? This section highlights key areas, outlining why they are attractive for hosts and guests, along with notable local attractions. Consider these locations based on your target guest profile and investment strategy.
| Neighborhood / Area | Why Host Here? (Target Guests & Appeal) | Key Attractions & Landmarks |
|---|---|---|
| Lakeside Crescent | A serene area known for its proximity to local parks and the stunning Blue Lake. Perfect for families and couples looking for a peaceful retreat in nature, yet close to urban amenities. | Blue Lake, Lakeside Park, Orange Botanic Gardens, Local wineries, Hiking trails |
| Orange Central Business District | The heart of Orange City, this area is bustling with shops, restaurants, and cafes. Ideal for guests looking for convenience and access to local attractions and events. | Orange Regional Gallery, Cook Park, Local Farmers Market, Café culture, Heritage Walks |
| Mount Canobolas | A popular destination for nature lovers with beautiful views and walking trails. Attracts those who want an outdoor experience and enjoy wine tasting in nearby vineyards. | Mount Canobolas Lookout, Canobolas-Snowy Mountains Trail, Vineyards, Wildlife experiences, Biking trails |
| Borenore | A quiet, semi-rural suburb offering a unique experience with nearby wineries and agricultural experiences. Great for guests looking to explore local produce and rural charm. | Borenore Rocks, Local wineries, Fruit picking, Historic sites, Scenic drives |
| Eugowra | A charming village known for its historical significance and local hospitality. Popular with visitors interested in local history and scenic countryside. | Canowindra Historical Museum, Local art galleries, Nature reserves, Historic landmarks, Country markets |
| Millthorpe | A historic village renowned for its heritage buildings and vibrant community. Perfect for travelers seeking a quaint experience and a glimpse into local history. | Millthorpe Heritage Walk, Antique shops, Local eateries, Markets, Historical architecture |
| Thealby | A newer development area that combines modern living with proximity to nature. Ideal for guests looking for a blend of contemporary comforts and outdoor activities. | Nature parks, Walking paths, Family-friendly activities, Community events, Nearby wineries |
| Canowindra | An emerging destination for hot air ballooning and rural tourism, perfect for adventurers and those looking to experience rural New South Wales. | Canowindra Hot Air Ballooning, Billabong Junction, Local arts and crafts, Historic buildings, Country festivals |
Understanding Airbnb License Requirements & STR Laws in Orange City Council (2025)
Yes, Orange City Council, New South Wales, Australia enforces high STR regulations. Obtaining a license and ensuring compliance is almost certainly required according to current 2025 STR laws. Always verify the latest short term rental regulations and Airbnb license requirements directly with local government authorities for Orange City Council to ensure full compliance before hosting.
(Source: AirROI data, 2025, based on 87% licensed listings)
Top Performing Airbnb Properties in Orange City Council (2025)
Benchmark your potential! Explore examples of top-performing Airbnb properties in Orange City Councilbased on Trailing Twelve Month (TTM) revenue. Analyze their characteristics, revenue, occupancy rate, and ADR to understand what drives success in this market.
Snowline - Ultimate Getaway, Pool, Sleeps 16
Entire Place • 5 bedrooms
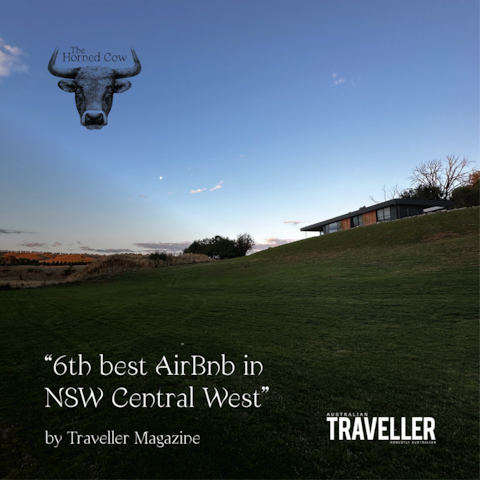
The Horned Cow: luxe 5 bed home 10min to Orange
Entire Place • 5 bedrooms
Narambla Estate - Rural Retreat, Modern Hideaway
Entire Place • 4 bedrooms

Secluded luxury farm stay 12 mins to Orange
Entire Place • 1 bedroom

Braehead Cottage
Entire Place • 1 bedroom

Chaser Studio @ Basalt
Entire Place • 1 bedroom
Note: Performance varies based on location, size, amenities, seasonality, and management quality. Data reflects the past 12 months.
Top Performing Airbnb Hosts in Orange City Council (2025)
Learn from the best! This table showcases top-performing Airbnb hosts in Orange City Council based on the number of properties managed and estimated total revenue over the past year. Analyze their scale and performance metrics.
| Host Name | Properties | Grossing Revenue | Stay Reviews | Avg Rating |
|---|---|---|---|---|
| BNB Made Easy: Timmy | 3 | $222,960 | 250 | 4.84/5.0 |
| Matthew | 1 | $85,497 | 54 | 4.94/5.0 |
| Simon | 3 | $62,267 | 15 | 5.00/5.0 |
| Karen | 1 | $37,992 | 52 | 4.96/5.0 |
| Book Regional | 2 | $35,081 | 59 | 4.65/5.0 |
| Rachel | 1 | $33,039 | 189 | 4.99/5.0 |
| Jo | 1 | $25,187 | 11 | 5.00/5.0 |
| Lindsay | 1 | $25,077 | 123 | 4.99/5.0 |
| Margaret | 1 | $24,308 | 48 | 4.90/5.0 |
| Jane | 1 | $19,555 | 404 | 4.94/5.0 |
Analyzing the strategies of top hosts, such as their property selection, pricing, and guest communication, can offer valuable lessons for optimizing your own Airbnb operations in Orange City Council.
Dive Deeper: Advanced Orange City Council STR Market Data (2025)
Ready to unlock more insights? AirROI provides access to advanced metrics and comprehensive Airbnb data for Orange City Council. Explore detailed analytics beyond this report to refine your investment strategy, optimize pricing, and maximize your vacation rental profits.
Explore Advanced MetricsOrange City Council Short-Term Rental Market Composition (2025): Property & Room Types
Room Type Distribution
Property Type Distribution
Market Composition Insights for Orange City Council
- The Orange City Council Airbnb market composition is heavily skewed towards Entire Home/Apt listings, which make up 95.7% of the 23 active rentals. This indicates strong guest preference for privacy and space.
- Looking at the property type distribution in Orange City Council, House properties are the most common (52.2%), reflecting the local real estate landscape.
- Houses represent a significant 52.2% portion, catering likely to families or larger groups.
- The presence of 8.7% Hotel/Boutique listings indicates integration with traditional hospitality.
Orange City Council Airbnb Room Capacity Analysis (2025): Bedroom Distribution
Distribution of Listings by Number of Bedrooms
Room Capacity Insights for Orange City Council
- The dominant room capacity in Orange City Council is 1 bedroom listings, making up 39.1% of the market. This suggests a strong demand for properties suitable for couples or solo travelers.
- Together, 1 bedroom and 2 bedrooms properties represent 60.8% of the active Airbnb listings in Orange City Council, indicating a high concentration in these sizes.
- A significant 34.7% of listings offer 3+ bedrooms, catering to larger groups and families seeking more space in Orange City Council.
Orange City Council Vacation Rental Guest Capacity Trends (2025)
Distribution of Listings by Guest Capacity
Guest Capacity Insights for Orange City Council
- The most common guest capacity trend in Orange City Council vacation rentals is listings accommodating 2 guests (34.8%). This suggests the primary traveler segment is likely couples or solo travelers.
- Properties designed for 2 guests and 4 guests dominate the Orange City Council STR market, accounting for 60.9% of listings.
- 30.4% of properties accommodate 6+ guests, serving the market segment for larger families or group travel in Orange City Council.
- On average, properties in Orange City Council are equipped to host 4.1 guests.
Orange City Council Airbnb Booking Patterns (2025): Available vs. Booked Days
Available Days Distribution
Booked Days Distribution
Booking Pattern Insights for Orange City Council
- The most common availability pattern in Orange City Council falls within the 271-366 days range, representing 43.5% of listings. This suggests many properties have significant open periods on their calendars.
- Approximately 73.9% of listings show high availability (181+ days open annually), indicating potential for increased bookings or specific owner usage patterns.
- For booked days, the 91-180 days range is most frequent in Orange City Council (30.4%), reflecting common guest stay durations or potential owner blocking patterns.
- A notable 26.0% of properties secure long booking periods (181+ days booked per year), highlighting successful long-term rental strategies or significant owner usage.
Orange City Council Airbnb Minimum Stay Requirements Analysis
Distribution of Listings by Minimum Night Requirement
1 Night
6 listings
30% of total
2 Nights
13 listings
65% of total
30+ Nights
1 listings
5% of total
Key Insights
- The most prevalent minimum stay requirement in Orange City Council is 2 Nights, adopted by 65% of listings. This highlights the market's preference for shorter, flexible bookings.
- A strong majority (95.0%) of the Orange City Council Airbnb data shows acceptance of very short stays (1-2 nights), indicating a dynamic, high-turnover market.
Recommendations
- Align with the market by considering a 2 Nights minimum stay, as 65% of Orange City Council hosts use this setting.
- Adjust minimum nights based on seasonality – potentially shorter during low season and longer during peak demand periods in Orange City Council.
Orange City Council Airbnb Cancellation Policy Trends Analysis (2025)
Flexible
7 listings
35% of total
Moderate
9 listings
45% of total
Firm
4 listings
20% of total
Cancellation Policy Insights for Orange City Council
- The prevailing Airbnb cancellation policy trend in Orange City Council is Moderate, used by 45% of listings.
- The market strongly favors guest-friendly terms, with 80.0% of listings offering Flexible or Moderate policies. This suggests guests in Orange City Council may expect booking flexibility.
Recommendations for Hosts
- Consider adopting a Moderate policy to align with the 45% market standard in Orange City Council.
- Regularly review your cancellation policy against competitors and market demand shifts in Orange City Council.
Orange City Council STR Booking Lead Time Analysis (2025)
Average Booking Lead Time by Month
Booking Lead Time Insights for Orange City Council
- The overall average booking lead time for vacation rentals in Orange City Council is 42 days.
- Guests book furthest in advance for stays during October (average 71 days), likely coinciding with peak travel demand or local events.
- The shortest booking windows occur for stays in July (average 30 days), indicating more last-minute travel plans during this time.
- Seasonally, Fall (55 days avg.) sees the longest lead times, while Summer (33 days avg.) has the shortest, reflecting typical travel planning cycles.
Recommendations for Hosts
- Use the overall average lead time (42 days) as a baseline for your pricing and availability strategy in Orange City Council.
- For October stays, consider implementing length-of-stay discounts or slightly higher rates for bookings made less than 71 days out to capitalize on advance planning.
- Target marketing efforts for the Fall season well in advance (at least 55 days) to capture early planners.
- Monitor your own booking lead times against these Orange City Council averages to identify opportunities for dynamic pricing adjustments.
Popular & Essential Airbnb Amenities in Orange City Council (2025)
Amenity Prevalence
Amenity Insights for Orange City Council
- Essential amenities in Orange City Council that guests expect include: Dishes and silverware, Free parking on premises, Heating, Smoke alarm, Hangers, Hair dryer, Microwave, Hot water, Bed linens, Air conditioning. Lacking these (any) could significantly impact bookings.
Recommendations for Hosts
- Ensure your listing includes all essential amenities for Orange City Council: Dishes and silverware, Free parking on premises, Heating, Smoke alarm, Hangers, Hair dryer, Microwave, Hot water, Bed linens, Air conditioning.
- Prioritize adding missing essentials: Microwave, Hot water, Bed linens, Air conditioning.
- Highlight unique or less common amenities you offer (e.g., hot tub, dedicated workspace, EV charger) in your listing description and photos.
- Regularly check competitor amenities in Orange City Council to stay competitive.
Orange City Council Airbnb Guest Demographics & Profile Analysis (2025)
Guest Profile Summary for Orange City Council
- The typical guest profile for Airbnb in Orange City Council consists of primarily domestic travelers (97%), often arriving from nearby Sydney, typically belonging to the Post-2000s (Gen Z/Alpha) group (50%), primarily speaking English or French.
- Domestic travelers account for 96.7% of guests.
- Key international markets include Australia (96.7%) and United Kingdom (1.5%).
- Top languages spoken are English (78%) followed by French (6.3%).
- A significant demographic segment is the Post-2000s (Gen Z/Alpha) group, representing 50% of guests.
Recommendations for Hosts
- Target domestic marketing efforts towards travelers from Sydney and New South Wales.
- Tailor amenities and listing descriptions to appeal to the dominant Post-2000s (Gen Z/Alpha) demographic (e.g., highlight fast WiFi, smart home features, local guides).
- Highlight unique local experiences or amenities relevant to the primary guest profile.
- Consider seasonal promotions aligned with peak travel times for key origin markets.
Nearby Short-Term Rental Market Comparison
How does the Orange City Council Airbnb market stack up against its neighbors? Compare key performance metrics like average monthly revenue, ADR, and occupancy rates in surrounding areas to understand the broader regional STR landscape.
| Market | Active Properties | Monthly Revenue | Daily Rate | Avg. Occupancy |
|---|---|---|---|---|
| Penrose | 12 | $6,349 | $600.00 | 42% |
| Berry | 115 | $6,185 | $540.04 | 41% |
| Jaspers Brush | 13 | $5,600 | $510.06 | 37% |
| Burrawang | 11 | $5,005 | $523.75 | 43% |
| Berrima | 44 | $4,756 | $426.34 | 42% |
| Robertson | 44 | $4,655 | $375.71 | 40% |
| Bombo | 10 | $4,613 | $503.00 | 39% |
| Exeter | 30 | $4,595 | $519.08 | 38% |
| Gerringong | 121 | $4,483 | $486.76 | 37% |
| Bowral | 170 | $4,412 | $359.45 | 45% |