Ocean Shores Airbnb Market Analysis 2025: Short Term Rental Data & Vacation Rental Statistics in New South Wales, Australia
Is Airbnb profitable in Ocean Shores in 2025? Explore comprehensive Airbnb analytics for Ocean Shores, New South Wales, Australia to uncover income potential. This 2025 STR market report for Ocean Shores, based on AirROI data from April 2024 to March 2025, reveals key trends in the niche market of 82 active listings.
Whether you're considering an Airbnb investment in Ocean Shores, optimizing your existing vacation rental, or exploring rental arbitrage opportunities, understanding the Ocean Shores Airbnb data is crucial. Navigating the high regulation landscape is key to maximizing your short term rental income potential. Let's dive into the specifics.
Key Ocean Shores Airbnb Performance Metrics Overview
Monthly Airbnb Revenue Variations & Income Potential in Ocean Shores (2025)
Understanding the monthly revenue variations for Airbnb listings in Ocean Shores is key to maximizing your short term rental income potential. Seasonality significantly impacts earnings. Our analysis, based on data from the past 12 months, shows that the peak revenue month for STRs in Ocean Shores is typically January, while March often presents the lowest earnings, highlighting opportunities for strategic pricing adjustments during shoulder and low seasons. Explore the typical Airbnb income in Ocean Shores across different performance tiers:
- Best-in-class properties (Top 10%) achieve $6,049+ monthly, often utilizing dynamic pricing and superior guest experiences.
- Strong performing properties (Top 25%) earn $3,743 or more, indicating effective management and desirable locations/amenities.
- Typical properties (Median) generate around $2,204 per month, representing the average market performance.
- Entry-level properties (Bottom 25%) see earnings around $886, often with potential for optimization.
Average Monthly Airbnb Earnings Trend in Ocean Shores
Ocean Shores Airbnb Occupancy Rate Trends (2025)
Maximize your bookings by understanding the Ocean Shores STR occupancy trends. Seasonal demand shifts significantly influence how often properties are booked. Typically, Januarysees the highest demand (peak season occupancy), while June experiences the lowest (low season). Effective strategies, like adjusting minimum stays or offering promotions, can boost occupancy during slower periods. Here's how different property tiers perform in Ocean Shores:
- Best-in-class properties (Top 10%) achieve 82%+ occupancy, indicating high desirability and potentially optimized availability.
- Strong performing properties (Top 25%) maintain 63% or higher occupancy, suggesting good market fit and guest satisfaction.
- Typical properties (Median) have an occupancy rate around 37%.
- Entry-level properties (Bottom 25%) average 18% occupancy, potentially facing higher vacancy.
Average Monthly Occupancy Rate Trend in Ocean Shores
Average Daily Rate (ADR) Airbnb Trends in Ocean Shores (2025)
Effective short term rental pricing strategy in Ocean Shores involves understanding monthly ADR fluctuations. The Average Daily Rate (ADR) for Airbnb in Ocean Shores typically peaks in December and dips lowest during August. Leveraging Airbnb dynamic pricing tools or strategies based on this seasonality can significantly boost revenue. Here's a look at the typical nightly rates achieved:
- Best-in-class properties (Top 10%) command rates of $503+ per night, often due to premium features or locations.
- Strong performing properties (Top 25%) achieve nightly rates of $283 or more.
- Typical properties (Median) charge around $167 per night.
- Entry-level properties (Bottom 25%) earn around $97 per night.
Average Daily Rate (ADR) Trend by Month in Ocean Shores
Get Live Ocean Shores Market Intelligence 👇

Explore Real-time Analytics
Airbnb Seasonality Analysis & Trends in Ocean Shores (2025)
Peak Season (January, December, November)
- Revenue averages $3,602 per month
- Occupancy rates average 50.5%
- Daily rates average $234
Shoulder Season
- Revenue averages $2,647 per month
- Occupancy maintains around 38.5%
- Daily rates hold near $221
Low Season (February, March, August)
- Revenue drops to average $1,987 per month
- Occupancy decreases to average 38.4%
- Daily rates adjust to average $222
Seasonality Insights for Ocean Shores
- The Airbnb seasonality in Ocean Shores shows highly seasonal trends requiring careful strategy. While the sections above show seasonal averages, it's also insightful to look at the extremes:
- During the high season, the absolute peak month showcases Ocean Shores's highest earning potential, with monthly revenues capable of climbing to $3,849, occupancy reaching a high of 54.2%, and ADRs peaking at $240.
- Conversely, the slowest single month of the year, typically falling within the low season, marks the market's lowest point. In this month, revenue might dip to $1,817, occupancy could drop to 29.9%, and ADRs may adjust down to $219.
- Understanding both the seasonal averages and these monthly peaks and troughs in revenue, occupancy, and ADR is crucial for maximizing your Airbnb profit potential in Ocean Shores.
Seasonal Strategies for Maximizing Profit
- Peak Season: Maximize revenue through premium pricing and potentially longer minimum stays. Ensure high availability.
- Low Season: Offer competitive pricing, special promotions (e.g., extended stay discounts), and flexible cancellation policies. Target off-season travelers like remote workers or budget-conscious guests.
- Shoulder Seasons: Implement dynamic pricing that balances peak and low rates. Target weekend travelers or specific events. Offer slightly more flexible terms than peak season.
- Regularly analyze your own performance against these Ocean Shores seasonality benchmarks and adjust your pricing and availability strategy accordingly.
Best Areas for Airbnb Investment in Ocean Shores (2025)
Exploring the top neighborhoods for short-term rentals in Ocean Shores? This section highlights key areas, outlining why they are attractive for hosts and guests, along with notable local attractions. Consider these locations based on your target guest profile and investment strategy.
| Neighborhood / Area | Why Host Here? (Target Guests & Appeal) | Key Attractions & Landmarks |
|---|---|---|
| North Beach | Popular among families and beach-goers for its swimming spots and family-friendly atmosphere. Offers great beach access and proximity to local amenities. | North Beach, Ocean Shores Country Club, Shark Island, Surf Beach, Jane's Beach |
| Fraser Park | A quieter location great for nature lovers and those seeking a peaceful getaway. Close to natural parks and walking trails. | Fraser Park, Lake Innes Nature Reserve, Beach walks, Nature trails, Wildlife experiences |
| Shore Street | Known for its stunning sunset views and relaxed beach ambiance. Attracts couples and travelers looking for picturesque scenery. | Shore Beach, Sunset Park, Coastal walking paths, Beachfront cafes, Local markets |
| Ocean Shores Golf Club | Ideal for golf enthusiasts and those looking for a resort-style experience. Offers leisure activities and scenic views. | Ocean Shores Golf Club, Nature reserves, Spa Club, Golf courses, Restaurant and bar |
| Shellharbour Bay | A prime spot for water sports and beach activities. Attracts adventure-seekers and families alike. | Shellharbour Beach, Boat ramp, Surfing spots, Picnic areas, Fishing spots |
| Tallebudgerra Creek | A hidden gem known for its tranquil waters and beautiful surrounds. Great for a relaxing retreat. | Tallebudgerra Creek, Beach access, Kayaking spots, Sand dunes, Picnic areas |
| The Quarters | A centralized area ideal for exploring both beaches and shopping facilities. Convenient for travelers needing access to amenities. | Shopping precinct, Local eateries, Parks, Beach access, Events and festivals |
| Byron Bay | Famous beachside town with a vibrant community feel. Attracts travelers for its beaches, culture, and nightlife. | Byron Bay Lighthouse, Main Beach, Cape Byron Nature Reserve, Local markets, Nightlife spots |
Understanding Airbnb License Requirements & STR Laws in Ocean Shores (2025)
Yes, Ocean Shores, New South Wales, Australia enforces high STR regulations. Obtaining a license and ensuring compliance is almost certainly required according to current 2025 STR laws. Always verify the latest short term rental regulations and Airbnb license requirements directly with local government authorities for Ocean Shores to ensure full compliance before hosting.
(Source: AirROI data, 2025, based on 74% licensed listings)
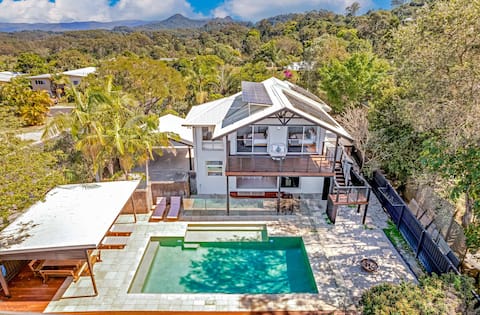
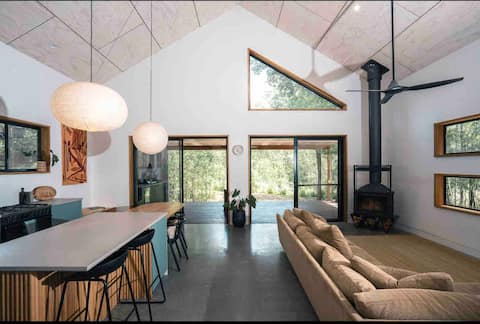
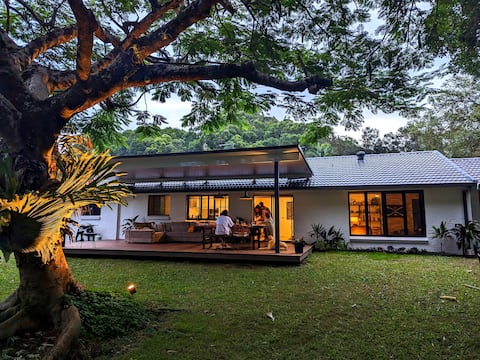
Top Performing Airbnb Properties in Ocean Shores (2025)
Benchmark your potential! Explore examples of top-performing Airbnb properties in Ocean Shoresbased on Trailing Twelve Month (TTM) revenue. Analyze their characteristics, revenue, occupancy rate, and ADR to understand what drives success in this market.
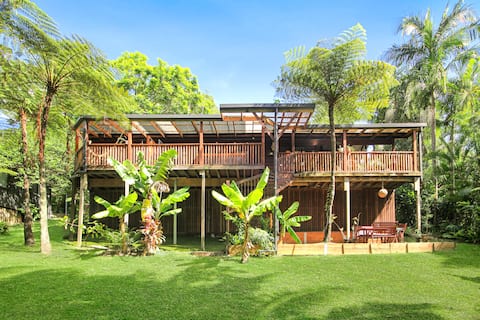
King Bed, Outdoor Bath, BBQ + Fireplace & Firepit
Entire Place • 3 bedrooms

Dragonfly - ocean & hinterland views
Entire Place • 3 bedrooms
Ruby's on Rajah - Family Friendly in Ocean Shores
Entire Place • 4 bedrooms

Artistic spacious home With saltwater pool-
Entire Place • 5 bedrooms
South Golden Breeze
Entire Place • 2 bedrooms
Chillout at the River House, a private paradise!
Entire Place • 3 bedrooms
Note: Performance varies based on location, size, amenities, seasonality, and management quality. Data reflects the past 12 months.
Top Performing Airbnb Hosts in Ocean Shores (2025)
Learn from the best! This table showcases top-performing Airbnb hosts in Ocean Shores based on the number of properties managed and estimated total revenue over the past year. Analyze their scale and performance metrics.
| Host Name | Properties | Grossing Revenue | Stay Reviews | Avg Rating |
|---|---|---|---|---|
| Jenny | 6 | $189,250 | 197 | 4.86/5.0 |
| Robyn And Steve | 2 | $88,251 | 1614 | 4.83/5.0 |
| Claire | 1 | $86,961 | 143 | 4.92/5.0 |
| Sarah | 1 | $79,340 | 13 | 4.92/5.0 |
| Intrepid BnB | 1 | $72,277 | 23 | 4.87/5.0 |
| Melissa | 1 | $70,922 | 33 | 4.85/5.0 |
| Gillian | 1 | $61,453 | 18 | 4.78/5.0 |
| Dean | 1 | $61,210 | 52 | 4.88/5.0 |
| Glen | 1 | $58,642 | 18 | 5.00/5.0 |
| Lachlan | 1 | $58,010 | 11 | 4.82/5.0 |
Analyzing the strategies of top hosts, such as their property selection, pricing, and guest communication, can offer valuable lessons for optimizing your own Airbnb operations in Ocean Shores.
Dive Deeper: Advanced Ocean Shores STR Market Data (2025)
Ready to unlock more insights? AirROI provides access to advanced metrics and comprehensive Airbnb data for Ocean Shores. Explore detailed analytics beyond this report to refine your investment strategy, optimize pricing, and maximize your vacation rental profits.
Explore Advanced MetricsOcean Shores Short-Term Rental Market Composition (2025): Property & Room Types
Room Type Distribution
Property Type Distribution
Market Composition Insights for Ocean Shores
- The Ocean Shores Airbnb market composition is heavily skewed towards Entire Home/Apt listings, which make up 79.3% of the 82 active rentals. This indicates strong guest preference for privacy and space.
- Looking at the property type distribution in Ocean Shores, House properties are the most common (69.5%), reflecting the local real estate landscape.
- Houses represent a significant 69.5% portion, catering likely to families or larger groups.
- The presence of 8.5% Hotel/Boutique listings indicates integration with traditional hospitality.
Ocean Shores Airbnb Room Capacity Analysis (2025): Bedroom Distribution
Distribution of Listings by Number of Bedrooms
Room Capacity Insights for Ocean Shores
- The dominant room capacity in Ocean Shores is 1 bedroom listings, making up 24.4% of the market. This suggests a strong demand for properties suitable for couples or solo travelers.
- Together, 1 bedroom and 3 bedrooms properties represent 47.6% of the active Airbnb listings in Ocean Shores, indicating a high concentration in these sizes.
- A significant 36.6% of listings offer 3+ bedrooms, catering to larger groups and families seeking more space in Ocean Shores.
Ocean Shores Vacation Rental Guest Capacity Trends (2025)
Distribution of Listings by Guest Capacity
Guest Capacity Insights for Ocean Shores
- The most common guest capacity trend in Ocean Shores vacation rentals is listings accommodating 2 guests (28%). This suggests the primary traveler segment is likely couples or solo travelers.
- Properties designed for 2 guests and 4 guests dominate the Ocean Shores STR market, accounting for 46.3% of listings.
- 32.9% of properties accommodate 6+ guests, serving the market segment for larger families or group travel in Ocean Shores.
- On average, properties in Ocean Shores are equipped to host 4.0 guests.
Ocean Shores Airbnb Booking Patterns (2025): Available vs. Booked Days
Available Days Distribution
Booked Days Distribution
Booking Pattern Insights for Ocean Shores
- The most common availability pattern in Ocean Shores falls within the 271-366 days range, representing 59.8% of listings. This suggests many properties have significant open periods on their calendars.
- Approximately 78.1% of listings show high availability (181+ days open annually), indicating potential for increased bookings or specific owner usage patterns.
- For booked days, the 1-30 days range is most frequent in Ocean Shores (36.6%), reflecting common guest stay durations or potential owner blocking patterns.
- A notable 22.0% of properties secure long booking periods (181+ days booked per year), highlighting successful long-term rental strategies or significant owner usage.
Ocean Shores Airbnb Minimum Stay Requirements Analysis
Distribution of Listings by Minimum Night Requirement
1 Night
7 listings
9.3% of total
2 Nights
15 listings
20% of total
3 Nights
15 listings
20% of total
4-6 Nights
5 listings
6.7% of total
7-29 Nights
4 listings
5.3% of total
30+ Nights
29 listings
38.7% of total
Key Insights
- The most prevalent minimum stay requirement in Ocean Shores is 30+ Nights, adopted by 38.7% of listings. This highlights the market's preference for longer commitments.
- A significant segment (38.7%) caters to monthly stays (30+ nights) in Ocean Shores, pointing to opportunities in the extended-stay market.
Recommendations
- Align with the market by considering a 30+ Nights minimum stay, as 38.7% of Ocean Shores hosts use this setting.
- If feasible, allowing 1-night stays, especially midweek or during low season, could capture last-minute bookings, as only 9.3% currently do.
- Explore offering discounts for stays of 30+ nights to attract the 38.7% of the market seeking extended stays.
- Adjust minimum nights based on seasonality – potentially shorter during low season and longer during peak demand periods in Ocean Shores.
Ocean Shores Airbnb Cancellation Policy Trends Analysis (2025)
Super Strict 30 Days
2 listings
3% of total
Flexible
9 listings
13.4% of total
Moderate
10 listings
14.9% of total
Firm
24 listings
35.8% of total
Strict
22 listings
32.8% of total
Cancellation Policy Insights for Ocean Shores
- The prevailing Airbnb cancellation policy trend in Ocean Shores is Firm, used by 35.8% of listings.
- A majority (68.6%) of hosts in Ocean Shores utilize Firm or Strict policies, indicating a market where hosts prioritize booking security.
Recommendations for Hosts
- Consider adopting a Firm policy to align with the 35.8% market standard in Ocean Shores.
- With 32.8% using Strict terms, this is a viable option in Ocean Shores, particularly for high-value properties or during peak demand periods.
- Regularly review your cancellation policy against competitors and market demand shifts in Ocean Shores.
Ocean Shores STR Booking Lead Time Analysis (2025)
Average Booking Lead Time by Month
Booking Lead Time Insights for Ocean Shores
- The overall average booking lead time for vacation rentals in Ocean Shores is 44 days.
- Guests book furthest in advance for stays during December (average 54 days), likely coinciding with peak travel demand or local events.
- The shortest booking windows occur for stays in March (average 22 days), indicating more last-minute travel plans during this time.
- Seasonally, Winter (47 days avg.) sees the longest lead times, while Spring (38 days avg.) has the shortest, reflecting typical travel planning cycles.
Recommendations for Hosts
- Use the overall average lead time (44 days) as a baseline for your pricing and availability strategy in Ocean Shores.
- Target marketing efforts for the Winter season well in advance (at least 47 days) to capture early planners.
- Monitor your own booking lead times against these Ocean Shores averages to identify opportunities for dynamic pricing adjustments.
Popular & Essential Airbnb Amenities in Ocean Shores (2025)
Amenity Prevalence
Amenity Insights for Ocean Shores
- Essential amenities in Ocean Shores that guests expect include: Smoke alarm, Wifi, Kitchen, Essentials. Lacking these (any) could significantly impact bookings.
- Popular amenities like Heating, Hot water, Washer are common but not universal. Offering these can provide a competitive edge.
Recommendations for Hosts
- Ensure your listing includes all essential amenities for Ocean Shores: Smoke alarm, Wifi, Kitchen, Essentials.
- Prioritize adding missing essentials: Smoke alarm, Wifi, Kitchen, Essentials.
- Consider adding popular differentiators like Heating or Hot water to increase appeal.
- Highlight unique or less common amenities you offer (e.g., hot tub, dedicated workspace, EV charger) in your listing description and photos.
- Regularly check competitor amenities in Ocean Shores to stay competitive.
Ocean Shores Airbnb Guest Demographics & Profile Analysis (2025)
Guest Profile Summary for Ocean Shores
- The typical guest profile for Airbnb in Ocean Shores consists of primarily domestic travelers (86%), often arriving from nearby Brisbane, typically belonging to the Post-2000s (Gen Z/Alpha) group (50%), primarily speaking English or Spanish.
- Domestic travelers account for 85.8% of guests.
- Key international markets include Australia (85.8%) and United Kingdom (3.4%).
- Top languages spoken are English (61.8%) followed by Spanish (8%).
- A significant demographic segment is the Post-2000s (Gen Z/Alpha) group, representing 50% of guests.
Recommendations for Hosts
- Target domestic marketing efforts towards travelers from Brisbane and Sydney.
- Tailor amenities and listing descriptions to appeal to the dominant Post-2000s (Gen Z/Alpha) demographic (e.g., highlight fast WiFi, smart home features, local guides).
- Highlight unique local experiences or amenities relevant to the primary guest profile.
- Consider seasonal promotions aligned with peak travel times for key origin markets.
Nearby Short-Term Rental Market Comparison
How does the Ocean Shores Airbnb market stack up against its neighbors? Compare key performance metrics like average monthly revenue, ADR, and occupancy rates in surrounding areas to understand the broader regional STR landscape.
| Market | Active Properties | Monthly Revenue | Daily Rate | Avg. Occupancy |
|---|---|---|---|---|
| Byron Bay | 952 | $4,207 | $425.18 | 43% |
| Byron Shire Council | 206 | $3,945 | $428.48 | 42% |
| Ewingsdale | 67 | $3,804 | $487.49 | 37% |
| Kingscliff | 336 | $3,683 | $376.49 | 41% |
| Casuarina Beach | 138 | $3,646 | $407.62 | 42% |
| Clunes | 18 | $3,531 | $285.32 | 41% |
| Uki | 14 | $3,492 | $275.12 | 40% |
| Gold Coast City | 5,526 | $3,362 | $265.25 | 51% |
| Bogangar | 117 | $3,299 | $350.07 | 42% |
| Scenic Rim Regional | 284 | $3,224 | $243.05 | 46% |