Oberon Council Airbnb Market Analysis 2025: Short Term Rental Data & Vacation Rental Statistics in New South Wales, Australia
Is Airbnb profitable in Oberon Council in 2025? Explore comprehensive Airbnb analytics for Oberon Council, New South Wales, Australia to uncover income potential. This 2025 STR market report for Oberon Council, based on AirROI data from April 2024 to March 2025, reveals key trends in the niche market of 29 active listings.
Whether you're considering an Airbnb investment in Oberon Council, optimizing your existing vacation rental, or exploring rental arbitrage opportunities, understanding the Oberon Council Airbnb data is crucial. Navigating the high regulation landscape is key to maximizing your short term rental income potential. Let's dive into the specifics.
Key Oberon Council Airbnb Performance Metrics Overview
Monthly Airbnb Revenue Variations & Income Potential in Oberon Council (2025)
Understanding the monthly revenue variations for Airbnb listings in Oberon Council is key to maximizing your short term rental income potential. Seasonality significantly impacts earnings. Our analysis, based on data from the past 12 months, shows that the peak revenue month for STRs in Oberon Council is typically July, while February often presents the lowest earnings, highlighting opportunities for strategic pricing adjustments during shoulder and low seasons. Explore the typical Airbnb income in Oberon Council across different performance tiers:
- Best-in-class properties (Top 10%) achieve $6,139+ monthly, often utilizing dynamic pricing and superior guest experiences.
- Strong performing properties (Top 25%) earn $4,078 or more, indicating effective management and desirable locations/amenities.
- Typical properties (Median) generate around $2,131 per month, representing the average market performance.
- Entry-level properties (Bottom 25%) see earnings around $963, often with potential for optimization.
Average Monthly Airbnb Earnings Trend in Oberon Council
Oberon Council Airbnb Occupancy Rate Trends (2025)
Maximize your bookings by understanding the Oberon Council STR occupancy trends. Seasonal demand shifts significantly influence how often properties are booked. Typically, Octobersees the highest demand (peak season occupancy), while November experiences the lowest (low season). Effective strategies, like adjusting minimum stays or offering promotions, can boost occupancy during slower periods. Here's how different property tiers perform in Oberon Council:
- Best-in-class properties (Top 10%) achieve 76%+ occupancy, indicating high desirability and potentially optimized availability.
- Strong performing properties (Top 25%) maintain 54% or higher occupancy, suggesting good market fit and guest satisfaction.
- Typical properties (Median) have an occupancy rate around 31%.
- Entry-level properties (Bottom 25%) average 17% occupancy, potentially facing higher vacancy.
Average Monthly Occupancy Rate Trend in Oberon Council
Average Daily Rate (ADR) Airbnb Trends in Oberon Council (2025)
Effective short term rental pricing strategy in Oberon Council involves understanding monthly ADR fluctuations. The Average Daily Rate (ADR) for Airbnb in Oberon Council typically peaks in October and dips lowest during March. Leveraging Airbnb dynamic pricing tools or strategies based on this seasonality can significantly boost revenue. Here's a look at the typical nightly rates achieved:
- Best-in-class properties (Top 10%) command rates of $621+ per night, often due to premium features or locations.
- Strong performing properties (Top 25%) achieve nightly rates of $360 or more.
- Typical properties (Median) charge around $202 per night.
- Entry-level properties (Bottom 25%) earn around $135 per night.
Average Daily Rate (ADR) Trend by Month in Oberon Council
Get Live Oberon Council Market Intelligence 👇

Explore Real-time Analytics
Airbnb Seasonality Analysis & Trends in Oberon Council (2025)
Peak Season (July, October, June)
- Revenue averages $3,987 per month
- Occupancy rates average 43.6%
- Daily rates average $293
Shoulder Season
- Revenue averages $2,835 per month
- Occupancy maintains around 36.2%
- Daily rates hold near $286
Low Season (January, February, March)
- Revenue drops to average $2,085 per month
- Occupancy decreases to average 33.7%
- Daily rates adjust to average $271
Seasonality Insights for Oberon Council
- The Airbnb seasonality in Oberon Council shows highly seasonal trends requiring careful strategy. While the sections above show seasonal averages, it's also insightful to look at the extremes:
- During the high season, the absolute peak month showcases Oberon Council's highest earning potential, with monthly revenues capable of climbing to $4,220, occupancy reaching a high of 49.0%, and ADRs peaking at $298.
- Conversely, the slowest single month of the year, typically falling within the low season, marks the market's lowest point. In this month, revenue might dip to $1,884, occupancy could drop to 31.7%, and ADRs may adjust down to $265.
- Understanding both the seasonal averages and these monthly peaks and troughs in revenue, occupancy, and ADR is crucial for maximizing your Airbnb profit potential in Oberon Council.
Seasonal Strategies for Maximizing Profit
- Peak Season: Maximize revenue through premium pricing and potentially longer minimum stays. Ensure high availability.
- Low Season: Offer competitive pricing, special promotions (e.g., extended stay discounts), and flexible cancellation policies. Target off-season travelers like remote workers or budget-conscious guests.
- Shoulder Seasons: Implement dynamic pricing that balances peak and low rates. Target weekend travelers or specific events. Offer slightly more flexible terms than peak season.
- Regularly analyze your own performance against these Oberon Council seasonality benchmarks and adjust your pricing and availability strategy accordingly.
Best Areas for Airbnb Investment in Oberon Council (2025)
Exploring the top neighborhoods for short-term rentals in Oberon Council? This section highlights key areas, outlining why they are attractive for hosts and guests, along with notable local attractions. Consider these locations based on your target guest profile and investment strategy.
| Neighborhood / Area | Why Host Here? (Target Guests & Appeal) | Key Attractions & Landmarks |
|---|---|---|
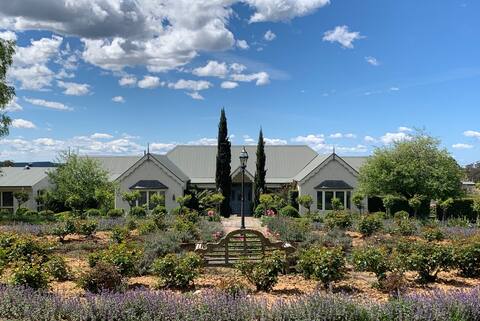
| Oberon | The picturesque and charming town in the Blue Mountains region, known for its cold climate and beautiful scenery. Great for tourists looking for a peaceful retreat and nature experiences. | Oberon Botanic Gardens, Mayfield Garden, Abercrombie Caves, Piper's Flat, The Oberon Common |
| Black Springs | A quaint village offering a rural escape within the Blue Mountains, known for its natural beauty and proximity to nature reserves. Ideal for guests looking for tranquility and outdoor activities. | Mayfield Garden, Kanangra-Boyd National Park, Local walking trails, Scenic viewpoints |
| Jenolan Caves | Famous for its stunning limestone caves, offering a unique experience for tourists interested in geology and nature. Great for adventure seekers and families. | Jenolan Caves, Borenore Caves, Cave tours, Nature trails |
| Tarana | A small village known for its historical significance and proximity to the beautiful countryside, perfect for those looking to escape the city life and enjoy the outdoors. | Tarana Hotel, Local history sites, Beautiful countryside, Creek and walking tracks |
| Wellington | A nearby town famous for its local produce and vineyards, attracting tourists looking for a taste of the region’s wines and food. | Wellington Caves, Local wineries, Fishing and boating on the Bell River |
| Little Hartley | A serene township tucked away in the mountains, ideal for a quiet retreat that offers beautiful views and an escape from city chaos. | Local parks, Nature walks, Scenic drives |
| Meadow Flat | A small community known for its stunning landscapes and agricultural charm. Perfect for guests interested in rural experiences and farm stays. | Scenic countryside, Agricultural shows, Walking trails |
| Pine Grove | A peaceful area known for its natural surroundings, making it ideal for guests looking for serene and nature-oriented experiences. | Local lakes, Fishing spots, Nature reserves |
Understanding Airbnb License Requirements & STR Laws in Oberon Council (2025)
Yes, Oberon Council, New South Wales, Australia enforces high STR regulations. Obtaining a license and ensuring compliance is almost certainly required according to current 2025 STR laws. Always verify the latest short term rental regulations and Airbnb license requirements directly with local government authorities for Oberon Council to ensure full compliance before hosting.
(Source: AirROI data, 2025, based on 86% licensed listings)
Top Performing Airbnb Properties in Oberon Council (2025)
Benchmark your potential! Explore examples of top-performing Airbnb properties in Oberon Councilbased on Trailing Twelve Month (TTM) revenue. Analyze their characteristics, revenue, occupancy rate, and ADR to understand what drives success in this market.
McKeown’s Rest @ Kenzell Farm
Entire Place • 6 bedrooms
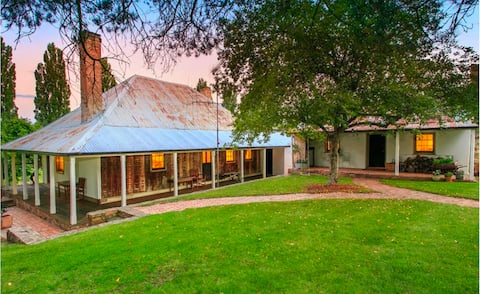
Country Farmhouse - Mutton Falls Tarana
Entire Place • 5 bedrooms
Hickory Moon -Peaceful Luxury - King size beds
Entire Place • 2 bedrooms

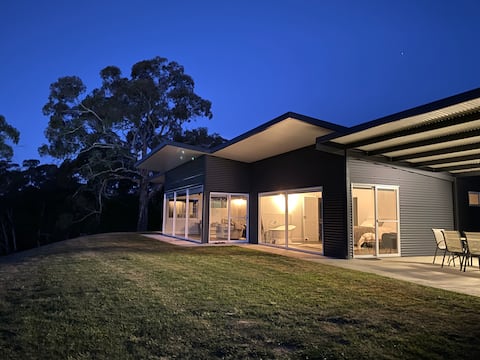
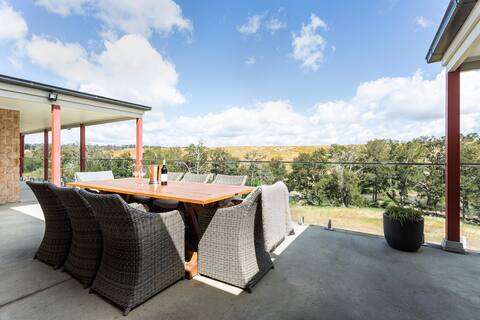
High View Jetty
Entire Place • 2 bedrooms
Flat Rock Retreat
Entire Place • 5 bedrooms
Home Farm Cabin - A breath of fresh mountain air
Entire Place • 1 bedroom
Note: Performance varies based on location, size, amenities, seasonality, and management quality. Data reflects the past 12 months.
Top Performing Airbnb Hosts in Oberon Council (2025)
Learn from the best! This table showcases top-performing Airbnb hosts in Oberon Council based on the number of properties managed and estimated total revenue over the past year. Analyze their scale and performance metrics.
| Host Name | Properties | Grossing Revenue | Stay Reviews | Avg Rating |
|---|---|---|---|---|
| Jacqui | 1 | $84,628 | 32 | 4.91/5.0 |
| Chara | 1 | $80,657 | 5 | 5.00/5.0 |
| Maxine | 1 | $58,811 | 84 | 4.99/5.0 |
| Into The Wild Escapes | 2 | $57,117 | 5 | 2.30/5.0 |
| Ree | 1 | $55,098 | 18 | 4.94/5.0 |
| Mick | 1 | $50,281 | 172 | 4.91/5.0 |
| Gerard & Amanda | 1 | $46,761 | 275 | 4.99/5.0 |
| Grant & Barb | 1 | $44,989 | 225 | 4.99/5.0 |
| Stephanie | 1 | $38,937 | 62 | 4.97/5.0 |
| Host #341852286 | 1 | $35,566 | 40 | 4.78/5.0 |
Analyzing the strategies of top hosts, such as their property selection, pricing, and guest communication, can offer valuable lessons for optimizing your own Airbnb operations in Oberon Council.
Dive Deeper: Advanced Oberon Council STR Market Data (2025)
Ready to unlock more insights? AirROI provides access to advanced metrics and comprehensive Airbnb data for Oberon Council. Explore detailed analytics beyond this report to refine your investment strategy, optimize pricing, and maximize your vacation rental profits.
Explore Advanced MetricsOberon Council Short-Term Rental Market Composition (2025): Property & Room Types
Room Type Distribution
Property Type Distribution
Market Composition Insights for Oberon Council
- The Oberon Council Airbnb market composition is heavily skewed towards Entire Home/Apt listings, which make up 100% of the 29 active rentals. This indicates strong guest preference for privacy and space.
- Looking at the property type distribution in Oberon Council, Outdoor/Unique properties are the most common (44.8%), reflecting the local real estate landscape.
- Houses represent a significant 41.4% portion, catering likely to families or larger groups.
- The presence of 6.9% Hotel/Boutique listings indicates integration with traditional hospitality.
Oberon Council Airbnb Room Capacity Analysis (2025): Bedroom Distribution
Distribution of Listings by Number of Bedrooms
Room Capacity Insights for Oberon Council
- The dominant room capacity in Oberon Council is 1 bedroom listings, making up 31% of the market. This suggests a strong demand for properties suitable for couples or solo travelers.
- Together, 1 bedroom and 2 bedrooms properties represent 55.1% of the active Airbnb listings in Oberon Council, indicating a high concentration in these sizes.
- A significant 41.4% of listings offer 3+ bedrooms, catering to larger groups and families seeking more space in Oberon Council.
Oberon Council Vacation Rental Guest Capacity Trends (2025)
Distribution of Listings by Guest Capacity
Guest Capacity Insights for Oberon Council
- The most common guest capacity trend in Oberon Council vacation rentals is listings accommodating 8+ guests (37.9%). This suggests the primary traveler segment is likely larger groups.
- Properties designed for 8+ guests and 4 guests dominate the Oberon Council STR market, accounting for 65.5% of listings.
- 48.2% of properties accommodate 6+ guests, serving the market segment for larger families or group travel in Oberon Council.
- On average, properties in Oberon Council are equipped to host 5.5 guests.
Oberon Council Airbnb Booking Patterns (2025): Available vs. Booked Days
Available Days Distribution
Booked Days Distribution
Booking Pattern Insights for Oberon Council
- The most common availability pattern in Oberon Council falls within the 271-366 days range, representing 48.3% of listings. This suggests many properties have significant open periods on their calendars.
- Approximately 86.2% of listings show high availability (181+ days open annually), indicating potential for increased bookings or specific owner usage patterns.
- For booked days, the 31-90 days range is most frequent in Oberon Council (41.4%), reflecting common guest stay durations or potential owner blocking patterns.
- A notable 13.7% of properties secure long booking periods (181+ days booked per year), highlighting successful long-term rental strategies or significant owner usage.
Oberon Council Airbnb Minimum Stay Requirements Analysis
Distribution of Listings by Minimum Night Requirement
1 Night
3 listings
11.1% of total
2 Nights
17 listings
63% of total
7-29 Nights
1 listings
3.7% of total
30+ Nights
6 listings
22.2% of total
Key Insights
- The most prevalent minimum stay requirement in Oberon Council is 2 Nights, adopted by 63% of listings. This highlights the market's preference for shorter, flexible bookings.
- A strong majority (74.1%) of the Oberon Council Airbnb data shows acceptance of very short stays (1-2 nights), indicating a dynamic, high-turnover market.
- A significant segment (22.2%) caters to monthly stays (30+ nights) in Oberon Council, pointing to opportunities in the extended-stay market.
Recommendations
- Align with the market by considering a 2 Nights minimum stay, as 63% of Oberon Council hosts use this setting.
- If feasible, allowing 1-night stays, especially midweek or during low season, could capture last-minute bookings, as only 11.1% currently do.
- A 2-night minimum appears standard (63%). Consider this for weekends or peak periods.
- Explore offering discounts for stays of 30+ nights to attract the 22.2% of the market seeking extended stays.
- Adjust minimum nights based on seasonality – potentially shorter during low season and longer during peak demand periods in Oberon Council.
Oberon Council Airbnb Cancellation Policy Trends Analysis (2025)
Super Strict 30 Days
1 listings
4% of total
Flexible
4 listings
16% of total
Moderate
10 listings
40% of total
Firm
3 listings
12% of total
Strict
7 listings
28% of total
Cancellation Policy Insights for Oberon Council
- The prevailing Airbnb cancellation policy trend in Oberon Council is Moderate, used by 40% of listings.
- There's a relatively balanced mix between guest-friendly (56.0%) and stricter (40.0%) policies, offering choices for different guest needs.
Recommendations for Hosts
- Consider adopting a Moderate policy to align with the 40% market standard in Oberon Council.
- Regularly review your cancellation policy against competitors and market demand shifts in Oberon Council.
Oberon Council STR Booking Lead Time Analysis (2025)
Average Booking Lead Time by Month
Booking Lead Time Insights for Oberon Council
- The overall average booking lead time for vacation rentals in Oberon Council is 56 days.
- Guests book furthest in advance for stays during October (average 83 days), likely coinciding with peak travel demand or local events.
- The shortest booking windows occur for stays in March (average 39 days), indicating more last-minute travel plans during this time.
- Seasonally, Fall (64 days avg.) sees the longest lead times, while Spring (47 days avg.) has the shortest, reflecting typical travel planning cycles.
Recommendations for Hosts
- Use the overall average lead time (56 days) as a baseline for your pricing and availability strategy in Oberon Council.
- For October stays, consider implementing length-of-stay discounts or slightly higher rates for bookings made less than 83 days out to capitalize on advance planning.
- Target marketing efforts for the Fall season well in advance (at least 64 days) to capture early planners.
- Monitor your own booking lead times against these Oberon Council averages to identify opportunities for dynamic pricing adjustments.
Popular & Essential Airbnb Amenities in Oberon Council (2025)
Amenity Prevalence
Amenity Insights for Oberon Council
- Essential amenities in Oberon Council that guests expect include: Free parking on premises. Lacking these (this) could significantly impact bookings.
- Popular amenities like Kitchen, Smoke alarm, Hot water are common but not universal. Offering these can provide a competitive edge.
Recommendations for Hosts
- Ensure your listing includes all essential amenities for Oberon Council: Free parking on premises.
- Prioritize adding missing essentials: Free parking on premises.
- Consider adding popular differentiators like Kitchen or Smoke alarm to increase appeal.
- Highlight unique or less common amenities you offer (e.g., hot tub, dedicated workspace, EV charger) in your listing description and photos.
- Regularly check competitor amenities in Oberon Council to stay competitive.
Oberon Council Airbnb Guest Demographics & Profile Analysis (2025)
Guest Profile Summary for Oberon Council
- The typical guest profile for Airbnb in Oberon Council consists of primarily domestic travelers (97%), often arriving from nearby Sydney, typically belonging to the Post-2000s (Gen Z/Alpha) group (50%), primarily speaking English or French.
- Domestic travelers account for 96.8% of guests.
- Key international markets include Australia (96.8%) and United States (1.4%).
- Top languages spoken are English (65.3%) followed by French (5.9%).
- A significant demographic segment is the Post-2000s (Gen Z/Alpha) group, representing 50% of guests.
Recommendations for Hosts
- Target domestic marketing efforts towards travelers from Sydney and New South Wales.
- Tailor amenities and listing descriptions to appeal to the dominant Post-2000s (Gen Z/Alpha) demographic (e.g., highlight fast WiFi, smart home features, local guides).
- Highlight unique local experiences or amenities relevant to the primary guest profile.
- Consider seasonal promotions aligned with peak travel times for key origin markets.
Nearby Short-Term Rental Market Comparison
How does the Oberon Council Airbnb market stack up against its neighbors? Compare key performance metrics like average monthly revenue, ADR, and occupancy rates in surrounding areas to understand the broader regional STR landscape.
| Market | Active Properties | Monthly Revenue | Daily Rate | Avg. Occupancy |
|---|---|---|---|---|
| Penrose | 12 | $6,349 | $600.00 | 42% |
| Berry | 115 | $6,185 | $540.04 | 41% |
| Jaspers Brush | 13 | $5,600 | $510.06 | 37% |
| Burrawang | 11 | $5,005 | $523.75 | 43% |
| Berrima | 44 | $4,756 | $426.34 | 42% |
| Robertson | 44 | $4,655 | $375.71 | 40% |
| Bombo | 10 | $4,613 | $503.00 | 39% |
| Exeter | 30 | $4,595 | $519.08 | 38% |
| Gerringong | 121 | $4,483 | $486.76 | 37% |
| Bowral | 170 | $4,412 | $359.45 | 45% |