Oberon Airbnb Market Analysis 2025: Short Term Rental Data & Vacation Rental Statistics in New South Wales, Australia
Is Airbnb profitable in Oberon in 2025? Explore comprehensive Airbnb analytics for Oberon, New South Wales, Australia to uncover income potential. This 2025 STR market report for Oberon, based on AirROI data from April 2024 to March 2025, reveals key trends in the niche market of 32 active listings.
Whether you're considering an Airbnb investment in Oberon, optimizing your existing vacation rental, or exploring rental arbitrage opportunities, understanding the Oberon Airbnb data is crucial. Navigating the high regulation landscape is key to maximizing your short term rental income potential. Let's dive into the specifics.
Key Oberon Airbnb Performance Metrics Overview
Monthly Airbnb Revenue Variations & Income Potential in Oberon (2025)
Understanding the monthly revenue variations for Airbnb listings in Oberon is key to maximizing your short term rental income potential. Seasonality significantly impacts earnings. Our analysis, based on data from the past 12 months, shows that the peak revenue month for STRs in Oberon is typically April, while February often presents the lowest earnings, highlighting opportunities for strategic pricing adjustments during shoulder and low seasons. Explore the typical Airbnb income in Oberon across different performance tiers:
- Best-in-class properties (Top 10%) achieve $6,286+ monthly, often utilizing dynamic pricing and superior guest experiences.
- Strong performing properties (Top 25%) earn $3,439 or more, indicating effective management and desirable locations/amenities.
- Typical properties (Median) generate around $1,929 per month, representing the average market performance.
- Entry-level properties (Bottom 25%) see earnings around $1,074, often with potential for optimization.
Average Monthly Airbnb Earnings Trend in Oberon
Oberon Airbnb Occupancy Rate Trends (2025)
Maximize your bookings by understanding the Oberon STR occupancy trends. Seasonal demand shifts significantly influence how often properties are booked. Typically, Julysees the highest demand (peak season occupancy), while February experiences the lowest (low season). Effective strategies, like adjusting minimum stays or offering promotions, can boost occupancy during slower periods. Here's how different property tiers perform in Oberon:
- Best-in-class properties (Top 10%) achieve 67%+ occupancy, indicating high desirability and potentially optimized availability.
- Strong performing properties (Top 25%) maintain 42% or higher occupancy, suggesting good market fit and guest satisfaction.
- Typical properties (Median) have an occupancy rate around 27%.
- Entry-level properties (Bottom 25%) average 13% occupancy, potentially facing higher vacancy.
Average Monthly Occupancy Rate Trend in Oberon
Average Daily Rate (ADR) Airbnb Trends in Oberon (2025)
Effective short term rental pricing strategy in Oberon involves understanding monthly ADR fluctuations. The Average Daily Rate (ADR) for Airbnb in Oberon typically peaks in October and dips lowest during March. Leveraging Airbnb dynamic pricing tools or strategies based on this seasonality can significantly boost revenue. Here's a look at the typical nightly rates achieved:
- Best-in-class properties (Top 10%) command rates of $667+ per night, often due to premium features or locations.
- Strong performing properties (Top 25%) achieve nightly rates of $371 or more.
- Typical properties (Median) charge around $240 per night.
- Entry-level properties (Bottom 25%) earn around $167 per night.
Average Daily Rate (ADR) Trend by Month in Oberon
Get Live Oberon Market Intelligence 👇
Explore Real-time Analytics
Airbnb Seasonality Analysis & Trends in Oberon (2025)
Peak Season (April, July, June)
- Revenue averages $3,564 per month
- Occupancy rates average 33.6%
- Daily rates average $372
Shoulder Season
- Revenue averages $2,795 per month
- Occupancy maintains around 32.7%
- Daily rates hold near $349
Low Season (February, March, November)
- Revenue drops to average $1,715 per month
- Occupancy decreases to average 24.9%
- Daily rates adjust to average $296
Seasonality Insights for Oberon
- The Airbnb seasonality in Oberon shows highly seasonal trends requiring careful strategy. While the sections above show seasonal averages, it's also insightful to look at the extremes:
- During the high season, the absolute peak month showcases Oberon's highest earning potential, with monthly revenues capable of climbing to $3,989, occupancy reaching a high of 41.9%, and ADRs peaking at $376.
- Conversely, the slowest single month of the year, typically falling within the low season, marks the market's lowest point. In this month, revenue might dip to $1,541, occupancy could drop to 20.1%, and ADRs may adjust down to $287.
- Understanding both the seasonal averages and these monthly peaks and troughs in revenue, occupancy, and ADR is crucial for maximizing your Airbnb profit potential in Oberon.
Seasonal Strategies for Maximizing Profit
- Peak Season: Maximize revenue through premium pricing and potentially longer minimum stays. Ensure high availability.
- Low Season: Offer competitive pricing, special promotions (e.g., extended stay discounts), and flexible cancellation policies. Target off-season travelers like remote workers or budget-conscious guests.
- Shoulder Seasons: Implement dynamic pricing that balances peak and low rates. Target weekend travelers or specific events. Offer slightly more flexible terms than peak season.
- Regularly analyze your own performance against these Oberon seasonality benchmarks and adjust your pricing and availability strategy accordingly.
Best Areas for Airbnb Investment in Oberon (2025)
Exploring the top neighborhoods for short-term rentals in Oberon? This section highlights key areas, outlining why they are attractive for hosts and guests, along with notable local attractions. Consider these locations based on your target guest profile and investment strategy.
| Neighborhood / Area | Why Host Here? (Target Guests & Appeal) | Key Attractions & Landmarks |
|---|---|---|
| Oberon Town Centre | The heart of Oberon, perfect for guests who want easy access to local shops, cafes, and amenities. A charming town atmosphere with friendly locals and laid-back vibes. | Oberon Visitor Information Centre, Mayfield Garden, Oberon Common, Oberon Museum, Local cafes and restaurants |
| Oberon Ranges | A scenic area ideal for nature lovers and those looking to escape to the great outdoors. Close to beautiful parks and nature trails, perfect for hiking and exploring. | Oberon Botanic Gardens, Kanangra-Boyd National Park, Borenore Caves, Cliefden Caves, Springwood from the train station |
| The Abercrombie River | A picturesque location along the Abercrombie River, offering tranquility and natural beauty. Ideal for guests looking for a relaxing getaway by the water. | Abercrombie River Nature Reserve, Fishing and kayaking opportunities, Nature walks, Picnic spots by the river |
| The Tablelands | An appealing spot for those wanting to experience the cool climate and lush landscapes. Great for visitors looking for a rural experience and stunning views. | The Turon River, Historic farm stays, Scenic drives and lookouts, Local wineries and produce |
| Black Springs | A small village nearby, known for its quiet charm and beautiful surroundings. A great base for exploring the larger Oberon area. | Black Springs Village, Natural bushland, Caves and hiking trails, Community markets |
| Wellington | A nearby town with rich history and cultural experiences. Offers additional attractions and easy access to Oberon and surrounding areas. | Wellington Caves, Wellington Historical Museum, Local parks and gardens, Regional events |
| Oberon Golf Club | Ideal for golfing enthusiasts and visitors looking for leisure activities. A well-maintained golf course with beautiful views and facilities. | 18 hole golf course, Clubhouse amenities, Golf tournaments, Social events |
| Tarana | A quaint village just south of Oberon, offering a rural escape and heritage charm. Known for its historic buildings and peaceful environment. | Tarana Heritage Trail, Historic railway station, Local art galleries, Natural beauty spots |
Understanding Airbnb License Requirements & STR Laws in Oberon (2025)
Yes, Oberon, New South Wales, Australia enforces high STR regulations. Obtaining a license and ensuring compliance is almost certainly required according to current 2025 STR laws. Always verify the latest short term rental regulations and Airbnb license requirements directly with local government authorities for Oberon to ensure full compliance before hosting.
(Source: AirROI data, 2025, based on 97% licensed listings)
Top Performing Airbnb Properties in Oberon (2025)
Benchmark your potential! Explore examples of top-performing Airbnb properties in Oberonbased on Trailing Twelve Month (TTM) revenue. Analyze their characteristics, revenue, occupancy rate, and ADR to understand what drives success in this market.
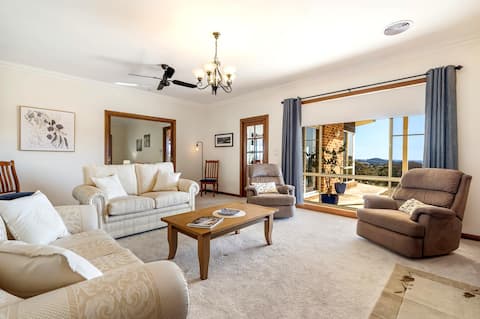
Hidden gem with outstanding view of Oberon Lake
Entire Place • 4 bedrooms

Rural Retreat at Oberon
Entire Place • 4 bedrooms

Spacious and centrally located period home
Entire Place • 4 bedrooms
Waringa Downs Farm Stay - Close to Mayfield Garden
Entire Place • 4 bedrooms

Oberon - A Place For Comfort, My Getaway
Entire Place • 7 bedrooms

Wombalee Farm
Entire Place • 3 bedrooms
Note: Performance varies based on location, size, amenities, seasonality, and management quality. Data reflects the past 12 months.
Top Performing Airbnb Hosts in Oberon (2025)
Learn from the best! This table showcases top-performing Airbnb hosts in Oberon based on the number of properties managed and estimated total revenue over the past year. Analyze their scale and performance metrics.
| Host Name | Properties | Grossing Revenue | Stay Reviews | Avg Rating |
|---|---|---|---|---|
| Eugenia | 1 | $71,200 | 17 | 5.00/5.0 |
| David | 1 | $61,552 | 45 | 4.98/5.0 |
| Julie | 6 | $58,882 | 59 | 4.92/5.0 |
| Heather | 1 | $56,240 | 24 | 4.92/5.0 |
| Book Regional | 1 | $55,216 | 21 | 4.95/5.0 |
| Claude | 1 | $50,227 | 36 | 4.83/5.0 |
| Emilie | 1 | $47,002 | 30 | 5.00/5.0 |
| Monique | 1 | $46,925 | 31 | 4.71/5.0 |
| Melaleuca | 4 | $40,842 | 140 | 4.80/5.0 |
| Host #145613821 | 1 | $40,184 | 1 | 0.00/5.0 |
Analyzing the strategies of top hosts, such as their property selection, pricing, and guest communication, can offer valuable lessons for optimizing your own Airbnb operations in Oberon.
Dive Deeper: Advanced Oberon STR Market Data (2025)
Ready to unlock more insights? AirROI provides access to advanced metrics and comprehensive Airbnb data for Oberon. Explore detailed analytics beyond this report to refine your investment strategy, optimize pricing, and maximize your vacation rental profits.
Explore Advanced MetricsOberon Short-Term Rental Market Composition (2025): Property & Room Types
Room Type Distribution
Property Type Distribution
Market Composition Insights for Oberon
- The Oberon Airbnb market composition is heavily skewed towards Entire Home/Apt listings, which make up 93.8% of the 32 active rentals. This indicates strong guest preference for privacy and space.
- Looking at the property type distribution in Oberon, House properties are the most common (78.1%), reflecting the local real estate landscape.
- Houses represent a significant 78.1% portion, catering likely to families or larger groups.
- Smaller segments like apartment/condo, hotel/boutique (combined 6.2%) offer potential for unique stay experiences.
Oberon Airbnb Room Capacity Analysis (2025): Bedroom Distribution
Distribution of Listings by Number of Bedrooms
Room Capacity Insights for Oberon
- The dominant room capacity in Oberon is 3 bedrooms listings, making up 31.3% of the market. This suggests a strong demand for properties suitable for families or small groups.
- Together, 3 bedrooms and 5+ bedrooms properties represent 53.2% of the active Airbnb listings in Oberon, indicating a high concentration in these sizes.
- A significant 72.0% of listings offer 3+ bedrooms, catering to larger groups and families seeking more space in Oberon.
Oberon Vacation Rental Guest Capacity Trends (2025)
Distribution of Listings by Guest Capacity
Guest Capacity Insights for Oberon
- The most common guest capacity trend in Oberon vacation rentals is listings accommodating 8+ guests (46.9%). This suggests the primary traveler segment is likely larger groups.
- Properties designed for 8+ guests and 6 guests dominate the Oberon STR market, accounting for 68.8% of listings.
- 68.8% of properties accommodate 6+ guests, serving the market segment for larger families or group travel in Oberon.
- On average, properties in Oberon are equipped to host 5.8 guests.
Oberon Airbnb Booking Patterns (2025): Available vs. Booked Days
Available Days Distribution
Booked Days Distribution
Booking Pattern Insights for Oberon
- The most common availability pattern in Oberon falls within the 271-366 days range, representing 59.4% of listings. This suggests many properties have significant open periods on their calendars.
- Approximately 84.4% of listings show high availability (181+ days open annually), indicating potential for increased bookings or specific owner usage patterns.
- For booked days, the 31-90 days range is most frequent in Oberon (40.6%), reflecting common guest stay durations or potential owner blocking patterns.
- A notable 15.7% of properties secure long booking periods (181+ days booked per year), highlighting successful long-term rental strategies or significant owner usage.
Oberon Airbnb Minimum Stay Requirements Analysis
Distribution of Listings by Minimum Night Requirement
1 Night
6 listings
18.8% of total
2 Nights
22 listings
68.8% of total
30+ Nights
4 listings
12.5% of total
Key Insights
- The most prevalent minimum stay requirement in Oberon is 2 Nights, adopted by 68.8% of listings. This highlights the market's preference for shorter, flexible bookings.
- A strong majority (87.6%) of the Oberon Airbnb data shows acceptance of very short stays (1-2 nights), indicating a dynamic, high-turnover market.
- A significant segment (12.5%) caters to monthly stays (30+ nights) in Oberon, pointing to opportunities in the extended-stay market.
Recommendations
- Align with the market by considering a 2 Nights minimum stay, as 68.8% of Oberon hosts use this setting.
- If feasible, allowing 1-night stays, especially midweek or during low season, could capture last-minute bookings, as only 18.8% currently do.
- A 2-night minimum appears standard (68.8%). Consider this for weekends or peak periods.
- Explore offering discounts for stays of 30+ nights to attract the 12.5% of the market seeking extended stays.
- Adjust minimum nights based on seasonality – potentially shorter during low season and longer during peak demand periods in Oberon.
Oberon Airbnb Cancellation Policy Trends Analysis (2025)
Flexible
1 listings
3.2% of total
Moderate
12 listings
38.7% of total
Firm
4 listings
12.9% of total
Strict
14 listings
45.2% of total
Cancellation Policy Insights for Oberon
- The prevailing Airbnb cancellation policy trend in Oberon is Strict, used by 45.2% of listings.
- A majority (58.1%) of hosts in Oberon utilize Firm or Strict policies, indicating a market where hosts prioritize booking security.
Recommendations for Hosts
- Consider adopting a Strict policy to align with the 45.2% market standard in Oberon.
- With 45.2% using Strict terms, this is a viable option in Oberon, particularly for high-value properties or during peak demand periods.
- Regularly review your cancellation policy against competitors and market demand shifts in Oberon.
Oberon STR Booking Lead Time Analysis (2025)
Average Booking Lead Time by Month
Booking Lead Time Insights for Oberon
- The overall average booking lead time for vacation rentals in Oberon is 39 days.
- Guests book furthest in advance for stays during October (average 64 days), likely coinciding with peak travel demand or local events.
- The shortest booking windows occur for stays in August (average 19 days), indicating more last-minute travel plans during this time.
- Seasonally, Fall (54 days avg.) sees the longest lead times, while Summer (24 days avg.) has the shortest, reflecting typical travel planning cycles.
Recommendations for Hosts
- Use the overall average lead time (39 days) as a baseline for your pricing and availability strategy in Oberon.
- For October stays, consider implementing length-of-stay discounts or slightly higher rates for bookings made less than 64 days out to capitalize on advance planning.
- Target marketing efforts for the Fall season well in advance (at least 54 days) to capture early planners.
- Monitor your own booking lead times against these Oberon averages to identify opportunities for dynamic pricing adjustments.
Popular & Essential Airbnb Amenities in Oberon (2025)
Amenity Prevalence
Amenity Insights for Oberon
- Essential amenities in Oberon that guests expect include: Heating, Smoke alarm, Free parking on premises. Lacking these (any) could significantly impact bookings.
- Popular amenities like Bed linens, Hair dryer, TV are common but not universal. Offering these can provide a competitive edge.
Recommendations for Hosts
- Ensure your listing includes all essential amenities for Oberon: Heating, Smoke alarm, Free parking on premises.
- Prioritize adding missing essentials: Heating, Smoke alarm, Free parking on premises.
- Consider adding popular differentiators like Bed linens or Hair dryer to increase appeal.
- Highlight unique or less common amenities you offer (e.g., hot tub, dedicated workspace, EV charger) in your listing description and photos.
- Regularly check competitor amenities in Oberon to stay competitive.
Oberon Airbnb Guest Demographics & Profile Analysis (2025)
Guest Profile Summary for Oberon
- The typical guest profile for Airbnb in Oberon consists of primarily domestic travelers (95%), often arriving from nearby Sydney, typically belonging to the Post-2000s (Gen Z/Alpha) group (50%), primarily speaking English or Chinese.
- Domestic travelers account for 94.8% of guests.
- Key international markets include Australia (94.8%) and Singapore (0.8%).
- Top languages spoken are English (68.1%) followed by Chinese (9.2%).
- A significant demographic segment is the Post-2000s (Gen Z/Alpha) group, representing 50% of guests.
Recommendations for Hosts
- Target domestic marketing efforts towards travelers from Sydney and New South Wales.
- Tailor amenities and listing descriptions to appeal to the dominant Post-2000s (Gen Z/Alpha) demographic (e.g., highlight fast WiFi, smart home features, local guides).
- Highlight unique local experiences or amenities relevant to the primary guest profile.
- Consider seasonal promotions aligned with peak travel times for key origin markets.
Nearby Short-Term Rental Market Comparison
How does the Oberon Airbnb market stack up against its neighbors? Compare key performance metrics like average monthly revenue, ADR, and occupancy rates in surrounding areas to understand the broader regional STR landscape.
| Market | Active Properties | Monthly Revenue | Daily Rate | Avg. Occupancy |
|---|---|---|---|---|
| Penrose | 12 | $6,349 | $600.00 | 42% |
| Berry | 115 | $6,185 | $540.04 | 41% |
| Jaspers Brush | 13 | $5,600 | $510.06 | 37% |
| Burrawang | 11 | $5,005 | $523.75 | 43% |
| Berrima | 44 | $4,756 | $426.34 | 42% |
| Robertson | 44 | $4,655 | $375.71 | 40% |
| Bombo | 10 | $4,613 | $503.00 | 39% |
| Exeter | 30 | $4,595 | $519.08 | 38% |
| Gerringong | 121 | $4,483 | $486.76 | 37% |
| Bowral | 170 | $4,412 | $359.45 | 45% |