Nimbin Airbnb Market Analysis 2025: Short Term Rental Data & Vacation Rental Statistics in New South Wales, Australia
Is Airbnb profitable in Nimbin in 2025? Explore comprehensive Airbnb analytics for Nimbin, New South Wales, Australia to uncover income potential. This 2025 STR market report for Nimbin, based on AirROI data from April 2024 to March 2025, reveals key trends in the niche market of 29 active listings.
Whether you're considering an Airbnb investment in Nimbin, optimizing your existing vacation rental, or exploring rental arbitrage opportunities, understanding the Nimbin Airbnb data is crucial. Navigating the high regulation landscape is key to maximizing your short term rental income potential. Let's dive into the specifics.
Key Nimbin Airbnb Performance Metrics Overview
Monthly Airbnb Revenue Variations & Income Potential in Nimbin (2025)
Understanding the monthly revenue variations for Airbnb listings in Nimbin is key to maximizing your short term rental income potential. Seasonality significantly impacts earnings. Our analysis, based on data from the past 12 months, shows that the peak revenue month for STRs in Nimbin is typically December, while March often presents the lowest earnings, highlighting opportunities for strategic pricing adjustments during shoulder and low seasons. Explore the typical Airbnb income in Nimbin across different performance tiers:
- Best-in-class properties (Top 10%) achieve $3,192+ monthly, often utilizing dynamic pricing and superior guest experiences.
- Strong performing properties (Top 25%) earn $2,225 or more, indicating effective management and desirable locations/amenities.
- Typical properties (Median) generate around $1,436 per month, representing the average market performance.
- Entry-level properties (Bottom 25%) see earnings around $736, often with potential for optimization.
Average Monthly Airbnb Earnings Trend in Nimbin
Nimbin Airbnb Occupancy Rate Trends (2025)
Maximize your bookings by understanding the Nimbin STR occupancy trends. Seasonal demand shifts significantly influence how often properties are booked. Typically, Septembersees the highest demand (peak season occupancy), while June experiences the lowest (low season). Effective strategies, like adjusting minimum stays or offering promotions, can boost occupancy during slower periods. Here's how different property tiers perform in Nimbin:
- Best-in-class properties (Top 10%) achieve 70%+ occupancy, indicating high desirability and potentially optimized availability.
- Strong performing properties (Top 25%) maintain 53% or higher occupancy, suggesting good market fit and guest satisfaction.
- Typical properties (Median) have an occupancy rate around 34%.
- Entry-level properties (Bottom 25%) average 21% occupancy, potentially facing higher vacancy.
Average Monthly Occupancy Rate Trend in Nimbin
Average Daily Rate (ADR) Airbnb Trends in Nimbin (2025)
Effective short term rental pricing strategy in Nimbin involves understanding monthly ADR fluctuations. The Average Daily Rate (ADR) for Airbnb in Nimbin typically peaks in December and dips lowest during August. Leveraging Airbnb dynamic pricing tools or strategies based on this seasonality can significantly boost revenue. Here's a look at the typical nightly rates achieved:
- Best-in-class properties (Top 10%) command rates of $174+ per night, often due to premium features or locations.
- Strong performing properties (Top 25%) achieve nightly rates of $156 or more.
- Typical properties (Median) charge around $110 per night.
- Entry-level properties (Bottom 25%) earn around $88 per night.
Average Daily Rate (ADR) Trend by Month in Nimbin
Get Live Nimbin Market Intelligence 👇

Explore Real-time Analytics
Airbnb Seasonality Analysis & Trends in Nimbin (2025)
Peak Season (December, November, April)
- Revenue averages $1,893 per month
- Occupancy rates average 40.1%
- Daily rates average $122
Shoulder Season
- Revenue averages $1,678 per month
- Occupancy maintains around 38.9%
- Daily rates hold near $115
Low Season (January, February, March)
- Revenue drops to average $1,308 per month
- Occupancy decreases to average 36.2%
- Daily rates adjust to average $125
Seasonality Insights for Nimbin
- The Airbnb seasonality in Nimbin shows moderate seasonality with distinct peak and low periods. While the sections above show seasonal averages, it's also insightful to look at the extremes:
- During the high season, the absolute peak month showcases Nimbin's highest earning potential, with monthly revenues capable of climbing to $1,941, occupancy reaching a high of 48.7%, and ADRs peaking at $131.
- Conversely, the slowest single month of the year, typically falling within the low season, marks the market's lowest point. In this month, revenue might dip to $1,125, occupancy could drop to 24.2%, and ADRs may adjust down to $113.
- Understanding both the seasonal averages and these monthly peaks and troughs in revenue, occupancy, and ADR is crucial for maximizing your Airbnb profit potential in Nimbin.
Seasonal Strategies for Maximizing Profit
- Peak Season: Maximize revenue through premium pricing and potentially longer minimum stays. Ensure high availability.
- Low Season: Offer competitive pricing, special promotions (e.g., extended stay discounts), and flexible cancellation policies. Target off-season travelers like remote workers or budget-conscious guests.
- Shoulder Seasons: Implement dynamic pricing that balances peak and low rates. Target weekend travelers or specific events. Offer slightly more flexible terms than peak season.
- Regularly analyze your own performance against these Nimbin seasonality benchmarks and adjust your pricing and availability strategy accordingly.
Best Areas for Airbnb Investment in Nimbin (2025)
Exploring the top neighborhoods for short-term rentals in Nimbin? This section highlights key areas, outlining why they are attractive for hosts and guests, along with notable local attractions. Consider these locations based on your target guest profile and investment strategy.
| Neighborhood / Area | Why Host Here? (Target Guests & Appeal) | Key Attractions & Landmarks |
|---|---|---|
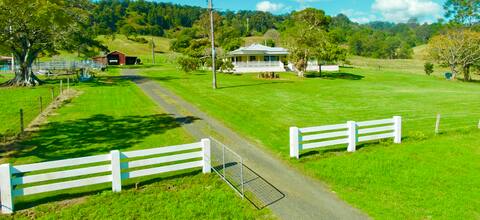
| Nimbin Village | The heart of Nimbin, known for its vibrant alternative lifestyle, arts scene, and cultural festivals. Ideal for tourists looking to experience the unique bohemian culture of the area. | Nimbin Markets, Nimbin Candle Factory, Nimbin Museum, Nimbin Hemp Embassy, Nimbin Rock |
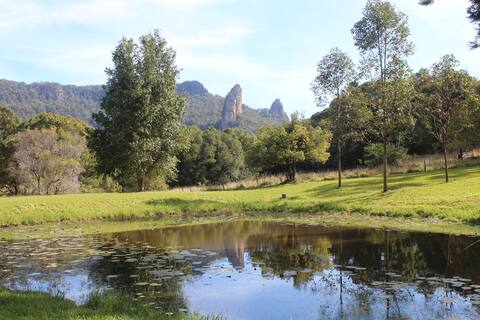
| Rainbow Region | A beautiful area surrounding Nimbin, featuring lush hinterland and natural beauty. Popular with nature lovers and those seeking relaxation in a peaceful setting. | Nightcap National Park, Channon Markets, Uki Village, Minyon Falls, Mount Warning |
| Nimbin River | Scenic location along the river, great for outdoor activities like swimming, kayaking, and picnicking. Attracts families and nature enthusiasts. | Nimbin River Swimming Holes, Picnic Areas, Walking Trails, Fishing Spots, Bushwalking Tracks |
| Nimbin Cultural Centre | A center for workshops, art exhibitions, and cultural events. A hub for community engagement and creativity, attracting both locals and tourists. | Art Workshops, Film Screenings, Community Events, Local Artisans, Craft Markets |
| Wollumbin National Park | A stunning natural park home to the iconic Wollumbin (Mount Warning). Ideal for hikers and those seeking adventure in nature. | Summit Hiking Trails, Scenic Lookouts, Biodiversity, Camping Areas, Wildlife Viewing |
| Local Vineyards | The area is home to several vineyards producing unique wines. Popular for wine tastings and tours, attracting food and wine enthusiasts. | Nimbin Valley Wines, Local Winery Tours, Wine Tastings, Gourmet Food Experiences, Scenic Views |
| Nimbin Eco Village | A sustainable living community showcasing eco-friendly practices. Attracts visitors interested in sustainability and alternative lifestyles. | Eco Tours, Sustainable Living Workshops, Organic Gardens, Community Events, Natural Building Workshops |
| Nearby Beaches | Nimbin is a short drive from beautiful beaches like Byron Bay and Lennox Head, making it a great base for beachgoers and surfers. | Byron Bay, Lennox Head, Wategos Beach, Swimming Spots, Surfing Lessons |
Understanding Airbnb License Requirements & STR Laws in Nimbin (2025)
Yes, Nimbin, New South Wales, Australia enforces high STR regulations. Obtaining a license and ensuring compliance is almost certainly required according to current 2025 STR laws. Always verify the latest short term rental regulations and Airbnb license requirements directly with local government authorities for Nimbin to ensure full compliance before hosting.
(Source: AirROI data, 2025, based on 76% licensed listings)
Top Performing Airbnb Properties in Nimbin (2025)
Benchmark your potential! Explore examples of top-performing Airbnb properties in Nimbinbased on Trailing Twelve Month (TTM) revenue. Analyze their characteristics, revenue, occupancy rate, and ADR to understand what drives success in this market.

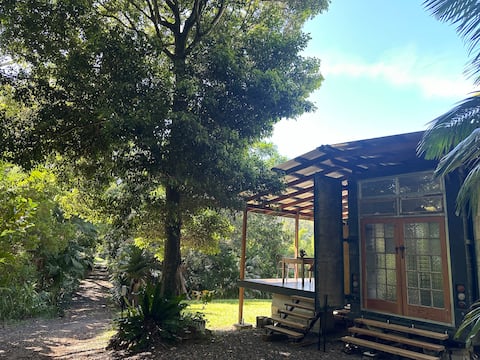
Amazing views - spacious and close to town
Entire Place • 4 bedrooms
Eco-Lux Country House on 180 acre Estate
Entire Place • 4 bedrooms
Freighter House Truck
Entire Place • 1 bedroom
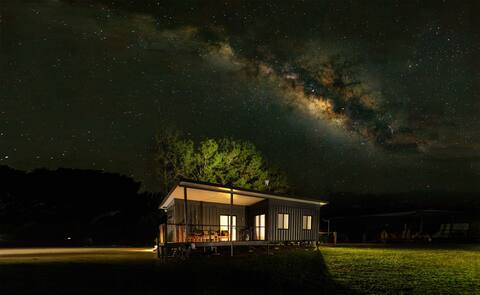
Contained in Nimbin - Wollumbin Cottage
Entire Place • 1 bedroom

Contained in Nimbin - NIGHTCAP Cottage
Entire Place • 1 bedroom
Mist Retreat Nimbin with stunning views & wildlife
Entire Place • 2 bedrooms
Note: Performance varies based on location, size, amenities, seasonality, and management quality. Data reflects the past 12 months.
Top Performing Airbnb Hosts in Nimbin (2025)
Learn from the best! This table showcases top-performing Airbnb hosts in Nimbin based on the number of properties managed and estimated total revenue over the past year. Analyze their scale and performance metrics.
| Host Name | Properties | Grossing Revenue | Stay Reviews | Avg Rating |
|---|---|---|---|---|
| Nicole | 2 | $57,901 | 105 | 4.98/5.0 |
| Theresa | 4 | $51,972 | 267 | 4.69/5.0 |
| Tim | 2 | $50,041 | 91 | 4.87/5.0 |
| Stuart | 1 | $47,834 | 112 | 4.88/5.0 |
| Steve | 3 | $34,429 | 160 | 4.92/5.0 |
| Felicity | 1 | $29,836 | 49 | 4.90/5.0 |
| Helen | 1 | $25,413 | 36 | 4.94/5.0 |
| Amelia | 1 | $25,070 | 34 | 4.94/5.0 |
| Mark | 2 | $19,873 | 177 | 4.95/5.0 |
| Catharina | 1 | $19,275 | 174 | 4.92/5.0 |
Analyzing the strategies of top hosts, such as their property selection, pricing, and guest communication, can offer valuable lessons for optimizing your own Airbnb operations in Nimbin.
Dive Deeper: Advanced Nimbin STR Market Data (2025)
Ready to unlock more insights? AirROI provides access to advanced metrics and comprehensive Airbnb data for Nimbin. Explore detailed analytics beyond this report to refine your investment strategy, optimize pricing, and maximize your vacation rental profits.
Explore Advanced MetricsNimbin Short-Term Rental Market Composition (2025): Property & Room Types
Room Type Distribution
Property Type Distribution
Market Composition Insights for Nimbin
- The Nimbin Airbnb market composition is heavily skewed towards Entire Home/Apt listings, which make up 65.5% of the 29 active rentals. This indicates strong guest preference for privacy and space.
- However, a notable 27.6% share for Private Rooms suggests opportunities for budget-conscious travelers or hosts renting out spare rooms.
- Looking at the property type distribution in Nimbin, House properties are the most common (48.3%), reflecting the local real estate landscape.
- Houses represent a significant 48.3% portion, catering likely to families or larger groups.
- The presence of 17.2% Hotel/Boutique listings indicates integration with traditional hospitality.
- Smaller segments like apartment/condo (combined 3.4%) offer potential for unique stay experiences.
Nimbin Airbnb Room Capacity Analysis (2025): Bedroom Distribution
Distribution of Listings by Number of Bedrooms
Room Capacity Insights for Nimbin
- The dominant room capacity in Nimbin is 1 bedroom listings, making up 55.2% of the market. This suggests a strong demand for properties suitable for couples or solo travelers.
- Together, 1 bedroom and 2 bedrooms properties represent 69.0% of the active Airbnb listings in Nimbin, indicating a high concentration in these sizes.
- With over half the market (55.2%) consisting of studios or 1-bedroom units, Nimbin is particularly well-suited for individuals or couples.
Nimbin Vacation Rental Guest Capacity Trends (2025)
Distribution of Listings by Guest Capacity
Guest Capacity Insights for Nimbin
- The most common guest capacity trend in Nimbin vacation rentals is listings accommodating 2 guests (31%). This suggests the primary traveler segment is likely couples or solo travelers.
- Properties designed for 2 guests and 4 guests dominate the Nimbin STR market, accounting for 44.8% of listings.
- 17.2% of properties accommodate 6+ guests, serving the market segment for larger families or group travel in Nimbin.
- On average, properties in Nimbin are equipped to host 3.1 guests.
Nimbin Airbnb Booking Patterns (2025): Available vs. Booked Days
Available Days Distribution
Booked Days Distribution
Booking Pattern Insights for Nimbin
- The most common availability pattern in Nimbin falls within the 271-366 days range, representing 44.8% of listings. This suggests many properties have significant open periods on their calendars.
- Approximately 79.3% of listings show high availability (181+ days open annually), indicating potential for increased bookings or specific owner usage patterns.
- For booked days, the 31-90 days range is most frequent in Nimbin (34.5%), reflecting common guest stay durations or potential owner blocking patterns.
- A notable 27.6% of properties secure long booking periods (181+ days booked per year), highlighting successful long-term rental strategies or significant owner usage.
Nimbin Airbnb Minimum Stay Requirements Analysis
Distribution of Listings by Minimum Night Requirement
1 Night
15 listings
60% of total
2 Nights
6 listings
24% of total
3 Nights
1 listings
4% of total
4-6 Nights
1 listings
4% of total
30+ Nights
2 listings
8% of total
Key Insights
- The most prevalent minimum stay requirement in Nimbin is 1 Night, adopted by 60% of listings. This highlights the market's preference for shorter, flexible bookings.
- A strong majority (84.0%) of the Nimbin Airbnb data shows acceptance of very short stays (1-2 nights), indicating a dynamic, high-turnover market.
Recommendations
- Align with the market by considering a 1 Night minimum stay, as 60% of Nimbin hosts use this setting.
- Explore offering discounts for stays of 30+ nights to attract the 8% of the market seeking extended stays.
- Adjust minimum nights based on seasonality – potentially shorter during low season and longer during peak demand periods in Nimbin.
Nimbin Airbnb Cancellation Policy Trends Analysis (2025)
Super Strict 60 Days
1 listings
4.2% of total
Flexible
6 listings
25% of total
Moderate
3 listings
12.5% of total
Firm
4 listings
16.7% of total
Strict
10 listings
41.7% of total
Cancellation Policy Insights for Nimbin
- The prevailing Airbnb cancellation policy trend in Nimbin is Strict, used by 41.7% of listings.
- A majority (58.4%) of hosts in Nimbin utilize Firm or Strict policies, indicating a market where hosts prioritize booking security.
Recommendations for Hosts
- Consider adopting a Strict policy to align with the 41.7% market standard in Nimbin.
- With 41.7% using Strict terms, this is a viable option in Nimbin, particularly for high-value properties or during peak demand periods.
- Regularly review your cancellation policy against competitors and market demand shifts in Nimbin.
Nimbin STR Booking Lead Time Analysis (2025)
Average Booking Lead Time by Month
Booking Lead Time Insights for Nimbin
- The overall average booking lead time for vacation rentals in Nimbin is 39 days.
- Guests book furthest in advance for stays during May (average 70 days), likely coinciding with peak travel demand or local events.
- The shortest booking windows occur for stays in September (average 18 days), indicating more last-minute travel plans during this time.
- Seasonally, Spring (57 days avg.) sees the longest lead times, while Summer (21 days avg.) has the shortest, reflecting typical travel planning cycles.
Recommendations for Hosts
- Use the overall average lead time (39 days) as a baseline for your pricing and availability strategy in Nimbin.
- For May stays, consider implementing length-of-stay discounts or slightly higher rates for bookings made less than 70 days out to capitalize on advance planning.
- Target marketing efforts for the Spring season well in advance (at least 57 days) to capture early planners.
- Monitor your own booking lead times against these Nimbin averages to identify opportunities for dynamic pricing adjustments.
Popular & Essential Airbnb Amenities in Nimbin (2025)
Amenity Prevalence
Amenity Insights for Nimbin
- Essential amenities in Nimbin that guests expect include: Hot water, Free parking on premises. Lacking these (any) could significantly impact bookings.
- Popular amenities like Essentials, Kitchen, Smoke alarm are common but not universal. Offering these can provide a competitive edge.
Recommendations for Hosts
- Ensure your listing includes all essential amenities for Nimbin: Hot water, Free parking on premises.
- Prioritize adding missing essentials: Hot water, Free parking on premises.
- Consider adding popular differentiators like Essentials or Kitchen to increase appeal.
- Highlight unique or less common amenities you offer (e.g., hot tub, dedicated workspace, EV charger) in your listing description and photos.
- Regularly check competitor amenities in Nimbin to stay competitive.
Nimbin Airbnb Guest Demographics & Profile Analysis (2025)
Guest Profile Summary for Nimbin
- The typical guest profile for Airbnb in Nimbin consists of primarily domestic travelers (90%), often arriving from nearby Brisbane, typically belonging to the Post-2000s (Gen Z/Alpha) group (50%), primarily speaking English or Spanish.
- Domestic travelers account for 90.2% of guests.
- Key international markets include Australia (90.2%) and United States (1.6%).
- Top languages spoken are English (67.2%) followed by Spanish (5.4%).
- A significant demographic segment is the Post-2000s (Gen Z/Alpha) group, representing 50% of guests.
Recommendations for Hosts
- Target domestic marketing efforts towards travelers from Brisbane and Gold Coast.
- Tailor amenities and listing descriptions to appeal to the dominant Post-2000s (Gen Z/Alpha) demographic (e.g., highlight fast WiFi, smart home features, local guides).
- Highlight unique local experiences or amenities relevant to the primary guest profile.
- Consider seasonal promotions aligned with peak travel times for key origin markets.
Nearby Short-Term Rental Market Comparison
How does the Nimbin Airbnb market stack up against its neighbors? Compare key performance metrics like average monthly revenue, ADR, and occupancy rates in surrounding areas to understand the broader regional STR landscape.
| Market | Active Properties | Monthly Revenue | Daily Rate | Avg. Occupancy |
|---|---|---|---|---|
| Byron Bay | 952 | $4,207 | $425.18 | 43% |
| Byron Shire Council | 206 | $3,945 | $428.48 | 42% |
| Ewingsdale | 67 | $3,804 | $487.49 | 37% |
| Kingscliff | 336 | $3,683 | $376.49 | 41% |
| Casuarina Beach | 138 | $3,646 | $407.62 | 42% |
| Clunes | 18 | $3,531 | $285.32 | 41% |
| Uki | 14 | $3,492 | $275.12 | 40% |
| Gold Coast City | 5,526 | $3,362 | $265.25 | 51% |
| Bogangar | 117 | $3,299 | $350.07 | 42% |
| Scenic Rim Regional | 284 | $3,224 | $243.05 | 46% |