Newcastle-Maitland Airbnb Market Analysis 2025: Short Term Rental Data & Vacation Rental Statistics in New South Wales, Australia
Is Airbnb profitable in Newcastle-Maitland in 2025? Explore comprehensive Airbnb analytics for Newcastle-Maitland, New South Wales, Australia to uncover income potential. This 2025 STR market report for Newcastle-Maitland, based on AirROI data from April 2024 to March 2025, reveals key trends in the market of 951 active listings.
Whether you're considering an Airbnb investment in Newcastle-Maitland, optimizing your existing vacation rental, or exploring rental arbitrage opportunities, understanding the Newcastle-Maitland Airbnb data is crucial. Navigating the high regulation landscape is key to maximizing your short term rental income potential. Let's dive into the specifics.
Key Newcastle-Maitland Airbnb Performance Metrics Overview
Monthly Airbnb Revenue Variations & Income Potential in Newcastle-Maitland (2025)
Understanding the monthly revenue variations for Airbnb listings in Newcastle-Maitland is key to maximizing your short term rental income potential. Seasonality significantly impacts earnings. Our analysis, based on data from the past 12 months, shows that the peak revenue month for STRs in Newcastle-Maitland is typically January, while August often presents the lowest earnings, highlighting opportunities for strategic pricing adjustments during shoulder and low seasons. Explore the typical Airbnb income in Newcastle-Maitland across different performance tiers:
- Best-in-class properties (Top 10%) achieve $6,960+ monthly, often utilizing dynamic pricing and superior guest experiences.
- Strong performing properties (Top 25%) earn $4,517 or more, indicating effective management and desirable locations/amenities.
- Typical properties (Median) generate around $2,604 per month, representing the average market performance.
- Entry-level properties (Bottom 25%) see earnings around $1,345, often with potential for optimization.
Average Monthly Airbnb Earnings Trend in Newcastle-Maitland
Newcastle-Maitland Airbnb Occupancy Rate Trends (2025)
Maximize your bookings by understanding the Newcastle-Maitland STR occupancy trends. Seasonal demand shifts significantly influence how often properties are booked. Typically, Januarysees the highest demand (peak season occupancy), while June experiences the lowest (low season). Effective strategies, like adjusting minimum stays or offering promotions, can boost occupancy during slower periods. Here's how different property tiers perform in Newcastle-Maitland:
- Best-in-class properties (Top 10%) achieve 86%+ occupancy, indicating high desirability and potentially optimized availability.
- Strong performing properties (Top 25%) maintain 72% or higher occupancy, suggesting good market fit and guest satisfaction.
- Typical properties (Median) have an occupancy rate around 48%.
- Entry-level properties (Bottom 25%) average 25% occupancy, potentially facing higher vacancy.
Average Monthly Occupancy Rate Trend in Newcastle-Maitland
Average Daily Rate (ADR) Airbnb Trends in Newcastle-Maitland (2025)
Effective short term rental pricing strategy in Newcastle-Maitland involves understanding monthly ADR fluctuations. The Average Daily Rate (ADR) for Airbnb in Newcastle-Maitland typically peaks in January and dips lowest during August. Leveraging Airbnb dynamic pricing tools or strategies based on this seasonality can significantly boost revenue. Here's a look at the typical nightly rates achieved:
- Best-in-class properties (Top 10%) command rates of $424+ per night, often due to premium features or locations.
- Strong performing properties (Top 25%) achieve nightly rates of $273 or more.
- Typical properties (Median) charge around $175 per night.
- Entry-level properties (Bottom 25%) earn around $111 per night.
Average Daily Rate (ADR) Trend by Month in Newcastle-Maitland
Get Live Newcastle-Maitland Market Intelligence 👇

Explore Real-time Analytics
Airbnb Seasonality Analysis & Trends in Newcastle-Maitland (2025)
Peak Season (January, December, April)
- Revenue averages $4,399 per month
- Occupancy rates average 53.5%
- Daily rates average $249
Shoulder Season
- Revenue averages $3,265 per month
- Occupancy maintains around 47.0%
- Daily rates hold near $219
Low Season (March, August, September)
- Revenue drops to average $2,676 per month
- Occupancy decreases to average 45.0%
- Daily rates adjust to average $215
Seasonality Insights for Newcastle-Maitland
- The Airbnb seasonality in Newcastle-Maitland shows moderate seasonality with distinct peak and low periods. While the sections above show seasonal averages, it's also insightful to look at the extremes:
- During the high season, the absolute peak month showcases Newcastle-Maitland's highest earning potential, with monthly revenues capable of climbing to $4,731, occupancy reaching a high of 58.1%, and ADRs peaking at $265.
- Conversely, the slowest single month of the year, typically falling within the low season, marks the market's lowest point. In this month, revenue might dip to $2,546, occupancy could drop to 40.1%, and ADRs may adjust down to $211.
- Understanding both the seasonal averages and these monthly peaks and troughs in revenue, occupancy, and ADR is crucial for maximizing your Airbnb profit potential in Newcastle-Maitland.
Seasonal Strategies for Maximizing Profit
- Peak Season: Maximize revenue through premium pricing and potentially longer minimum stays. Ensure high availability.
- Low Season: Offer competitive pricing, special promotions (e.g., extended stay discounts), and flexible cancellation policies. Target off-season travelers like remote workers or budget-conscious guests.
- Shoulder Seasons: Implement dynamic pricing that balances peak and low rates. Target weekend travelers or specific events. Offer slightly more flexible terms than peak season.
- Regularly analyze your own performance against these Newcastle-Maitland seasonality benchmarks and adjust your pricing and availability strategy accordingly.
Best Areas for Airbnb Investment in Newcastle-Maitland (2025)
Exploring the top neighborhoods for short-term rentals in Newcastle-Maitland? This section highlights key areas, outlining why they are attractive for hosts and guests, along with notable local attractions. Consider these locations based on your target guest profile and investment strategy.
| Neighborhood / Area | Why Host Here? (Target Guests & Appeal) | Key Attractions & Landmarks |
|---|---|---|
| Maitland CBD | The historic heart of Maitland featuring beautiful heritage buildings and a growing number of cafes and shops. Its accessibility to the Hunter Valley and vineyards makes it attractive for weekend getaways. | Maitland Gaol, Maitland Regional Art Gallery, Walka Water Works, Maitland Riverwalk, Maitland Showground |
| Newcastle Beach | A popular beachfront area in Newcastle, known for its stunning coastline, great surf breaks, and vibrant atmosphere. Ideal for tourists who want beach access and nightlife. | Newcastle Beach, Nobbys Beach, Fort Scratchley, Newcastle Memorial Walk, Darby Street cafes |
| Stockton | A beautiful suburb across the river from Newcastle with stunning beaches and easy access to the city. Attracts families and visitors looking for a quieter beach experience. | Stockton Beach, Heritage-listed churches, Ferry to Newcastle, Stockton Sand Dunes, Picnic areas |
| Honeysuckle | Regenerated waterfront area in Newcastle, known for its dining and nightlife. Attractive for young professionals and tourists who enjoy a vibrant atmosphere by the water. | Honeysuckle Boardwalk, Restaurants and bars, Newcastle Marina, Cockle Creek, Nobbys Lighthouse |
| Cessnock | Gateway to the Hunter Valley wine region, popular for wine tourism. Great for those looking to host visitors seeking wine experiences and vineyard tours. | Hunter Valley wineries, Cessnock Performing Arts Centre, Werakata National Park, Bimbadgen Estate, McGuigan Wines |
| Wallsend | A suburban area of Newcastle known for its family-friendly atmosphere, parks, and local amenities. Fertile ground for hosting workers and families visiting the area. | Wallsend Park, Stockland Jesmond Shopping Centre, Newcastle Showground, The Wallsend Diggers Club, Local playgrounds |
| Charlestown | A central suburb of Lake Macquarie, offering shopping, dining, and proximity to beautiful lakes and beaches. Attractive to families and visitors looking for convenience. | Charlestown Square, Dudley Beach, Glenrock State Conservation Area, Lake Macquarie, Charlestown Golf Club |
| Nelson Bay | A coastal town known for its stunning beaches, marine activities, and whale watching. Ideal for guests looking for a seaside getaway. | Nelson Bay Marina, Dolphin watching tours, Tomaree National Park, Fingal Bay, Shoal Bay |
Understanding Airbnb License Requirements & STR Laws in Newcastle-Maitland (2025)
Yes, Newcastle-Maitland, New South Wales, Australia enforces high STR regulations. Obtaining a license and ensuring compliance is almost certainly required according to current 2025 STR laws. Always verify the latest short term rental regulations and Airbnb license requirements directly with local government authorities for Newcastle-Maitland to ensure full compliance before hosting.
(Source: AirROI data, 2025, based on 89% licensed listings)
Top Performing Airbnb Properties in Newcastle-Maitland (2025)
Benchmark your potential! Explore examples of top-performing Airbnb properties in Newcastle-Maitlandbased on Trailing Twelve Month (TTM) revenue. Analyze their characteristics, revenue, occupancy rate, and ADR to understand what drives success in this market.
The Nest | Games Barn |Cinema|Alfresco Dining
Entire Place • 8 bedrooms
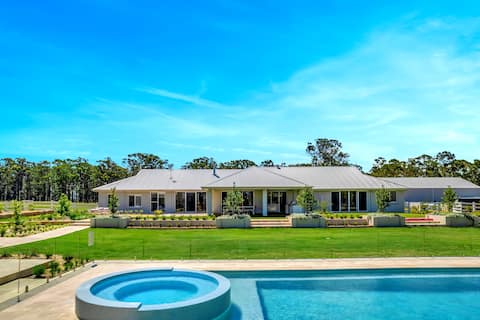
Luxury Hunter Valley Estate
Entire Place • 6 bedrooms
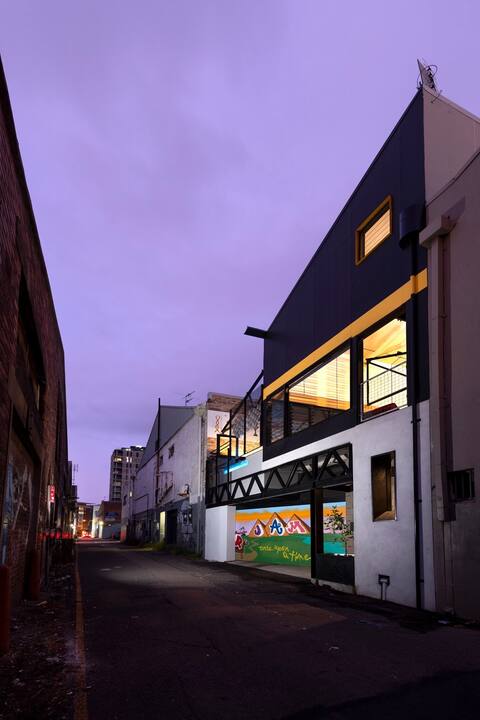
JAM House Award winning warehouse conversion
Entire Place • 5 bedrooms

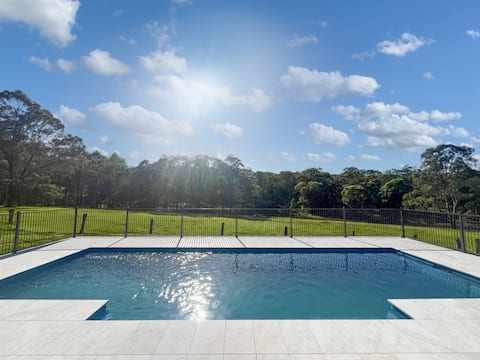
Shimmer Shores Absolute Waterfront Retreat
Entire Place • 6 bedrooms

“Karinya Parkland Estate”
Entire Place • 6 bedrooms

Mindaribba Estate - Mindaribba
Entire Place • 6 bedrooms
Note: Performance varies based on location, size, amenities, seasonality, and management quality. Data reflects the past 12 months.
Top Performing Airbnb Hosts in Newcastle-Maitland (2025)
Learn from the best! This table showcases top-performing Airbnb hosts in Newcastle-Maitland based on the number of properties managed and estimated total revenue over the past year. Analyze their scale and performance metrics.
| Host Name | Properties | Grossing Revenue | Stay Reviews | Avg Rating |
|---|---|---|---|---|
| Carly And Katie | 33 | $1,897,013 | 2126 | 4.74/5.0 |
| Follo | 26 | $1,631,050 | 951 | 4.50/5.0 |
| Lisa | 21 | $1,282,214 | 883 | 4.73/5.0 |
| Weekenda | 16 | $1,222,162 | 321 | 4.50/5.0 |
| Matt | 13 | $781,571 | 263 | 4.25/5.0 |
| Luke & Stacey | 11 | $694,842 | 2475 | 4.78/5.0 |
| Leanne | 16 | $604,282 | 554 | 4.65/5.0 |
| Amanda | 3 | $479,900 | 169 | 4.91/5.0 |
| AirKeeper | 7 | $443,842 | 175 | 4.66/5.0 |
| David & Shiran | 1 | $354,881 | 41 | 4.95/5.0 |
Analyzing the strategies of top hosts, such as their property selection, pricing, and guest communication, can offer valuable lessons for optimizing your own Airbnb operations in Newcastle-Maitland.
Dive Deeper: Advanced Newcastle-Maitland STR Market Data (2025)
Ready to unlock more insights? AirROI provides access to advanced metrics and comprehensive Airbnb data for Newcastle-Maitland. Explore detailed analytics beyond this report to refine your investment strategy, optimize pricing, and maximize your vacation rental profits.
Explore Advanced MetricsNewcastle-Maitland Short-Term Rental Market Composition (2025): Property & Room Types
Room Type Distribution
Property Type Distribution
Market Composition Insights for Newcastle-Maitland
- The Newcastle-Maitland Airbnb market composition is heavily skewed towards Entire Home/Apt listings, which make up 87.2% of the 951 active rentals. This indicates strong guest preference for privacy and space.
- Looking at the property type distribution in Newcastle-Maitland, House properties are the most common (49%), reflecting the local real estate landscape.
- Houses represent a significant 49% portion, catering likely to families or larger groups.
- The presence of 9% Hotel/Boutique listings indicates integration with traditional hospitality.
- Smaller segments like outdoor/unique, unique stays (combined 2.7%) offer potential for unique stay experiences.
Newcastle-Maitland Airbnb Room Capacity Analysis (2025): Bedroom Distribution
Distribution of Listings by Number of Bedrooms
Room Capacity Insights for Newcastle-Maitland
- The dominant room capacity in Newcastle-Maitland is 1 bedroom listings, making up 29.7% of the market. This suggests a strong demand for properties suitable for couples or solo travelers.
- Together, 1 bedroom and 2 bedrooms properties represent 55.7% of the active Airbnb listings in Newcastle-Maitland, indicating a high concentration in these sizes.
- A significant 34.7% of listings offer 3+ bedrooms, catering to larger groups and families seeking more space in Newcastle-Maitland.
Newcastle-Maitland Vacation Rental Guest Capacity Trends (2025)
Distribution of Listings by Guest Capacity
Guest Capacity Insights for Newcastle-Maitland
- The most common guest capacity trend in Newcastle-Maitland vacation rentals is listings accommodating 2 guests (22.2%). This suggests the primary traveler segment is likely couples or solo travelers.
- Properties designed for 2 guests and 4 guests dominate the Newcastle-Maitland STR market, accounting for 44.3% of listings.
- 32.6% of properties accommodate 6+ guests, serving the market segment for larger families or group travel in Newcastle-Maitland.
- On average, properties in Newcastle-Maitland are equipped to host 4.2 guests.
Newcastle-Maitland Airbnb Booking Patterns (2025): Available vs. Booked Days
Available Days Distribution
Booked Days Distribution
Booking Pattern Insights for Newcastle-Maitland
- The most common availability pattern in Newcastle-Maitland falls within the 181-270 days range, representing 30.6% of listings. This suggests many properties have significant open periods on their calendars.
- Approximately 59.0% of listings show high availability (181+ days open annually), indicating potential for increased bookings or specific owner usage patterns.
- For booked days, the 91-180 days range is most frequent in Newcastle-Maitland (30.2%), reflecting common guest stay durations or potential owner blocking patterns.
- A notable 42.4% of properties secure long booking periods (181+ days booked per year), highlighting successful long-term rental strategies or significant owner usage.
Newcastle-Maitland Airbnb Minimum Stay Requirements Analysis
Distribution of Listings by Minimum Night Requirement
1 Night
237 listings
26.5% of total
2 Nights
265 listings
29.6% of total
3 Nights
56 listings
6.3% of total
4-6 Nights
29 listings
3.2% of total
7-29 Nights
50 listings
5.6% of total
30+ Nights
257 listings
28.7% of total
Key Insights
- The most prevalent minimum stay requirement in Newcastle-Maitland is 2 Nights, adopted by 29.6% of listings. This highlights the market's preference for shorter, flexible bookings.
- A significant segment (28.7%) caters to monthly stays (30+ nights) in Newcastle-Maitland, pointing to opportunities in the extended-stay market.
Recommendations
- Align with the market by considering a 2 Nights minimum stay, as 29.6% of Newcastle-Maitland hosts use this setting.
- If feasible, allowing 1-night stays, especially midweek or during low season, could capture last-minute bookings, as only 26.5% currently do.
- Explore offering discounts for stays of 30+ nights to attract the 28.7% of the market seeking extended stays.
- Adjust minimum nights based on seasonality – potentially shorter during low season and longer during peak demand periods in Newcastle-Maitland.
Newcastle-Maitland Airbnb Cancellation Policy Trends Analysis (2025)
Super Strict 60 Days
3 listings
0.3% of total
Super Strict 30 Days
20 listings
2.3% of total
Flexible
200 listings
22.8% of total
Moderate
314 listings
35.8% of total
Firm
176 listings
20.1% of total
Strict
164 listings
18.7% of total
Cancellation Policy Insights for Newcastle-Maitland
- The prevailing Airbnb cancellation policy trend in Newcastle-Maitland is Moderate, used by 35.8% of listings.
- There's a relatively balanced mix between guest-friendly (58.6%) and stricter (38.8%) policies, offering choices for different guest needs.
Recommendations for Hosts
- Consider adopting a Moderate policy to align with the 35.8% market standard in Newcastle-Maitland.
- Regularly review your cancellation policy against competitors and market demand shifts in Newcastle-Maitland.
Newcastle-Maitland STR Booking Lead Time Analysis (2025)
Average Booking Lead Time by Month
Booking Lead Time Insights for Newcastle-Maitland
- The overall average booking lead time for vacation rentals in Newcastle-Maitland is 43 days.
- Guests book furthest in advance for stays during December (average 61 days), likely coinciding with peak travel demand or local events.
- The shortest booking windows occur for stays in August (average 34 days), indicating more last-minute travel plans during this time.
- Seasonally, Winter (52 days avg.) sees the longest lead times, while Summer (37 days avg.) has the shortest, reflecting typical travel planning cycles.
Recommendations for Hosts
- Use the overall average lead time (43 days) as a baseline for your pricing and availability strategy in Newcastle-Maitland.
- For December stays, consider implementing length-of-stay discounts or slightly higher rates for bookings made less than 61 days out to capitalize on advance planning.
- Target marketing efforts for the Winter season well in advance (at least 52 days) to capture early planners.
- Monitor your own booking lead times against these Newcastle-Maitland averages to identify opportunities for dynamic pricing adjustments.
Popular & Essential Airbnb Amenities in Newcastle-Maitland (2025)
Amenity Prevalence
Amenity Insights for Newcastle-Maitland
- Essential amenities in Newcastle-Maitland that guests expect include: Smoke alarm, TV, Wifi. Lacking these (any) could significantly impact bookings.
- Popular amenities like Heating, Kitchen, Dishes and silverware are common but not universal. Offering these can provide a competitive edge.
Recommendations for Hosts
- Ensure your listing includes all essential amenities for Newcastle-Maitland: Smoke alarm, TV, Wifi.
- Prioritize adding missing essentials: Smoke alarm, TV, Wifi.
- Consider adding popular differentiators like Heating or Kitchen to increase appeal.
- Highlight unique or less common amenities you offer (e.g., hot tub, dedicated workspace, EV charger) in your listing description and photos.
- Regularly check competitor amenities in Newcastle-Maitland to stay competitive.
Newcastle-Maitland Airbnb Guest Demographics & Profile Analysis (2025)
Guest Profile Summary for Newcastle-Maitland
- The typical guest profile for Airbnb in Newcastle-Maitland consists of primarily domestic travelers (90%), often arriving from nearby Sydney, typically belonging to the Post-2000s (Gen Z/Alpha) group (50%), primarily speaking English or French.
- Domestic travelers account for 89.6% of guests.
- Key international markets include Australia (89.6%) and United Kingdom (2.3%).
- Top languages spoken are English (70.9%) followed by French (4.4%).
- A significant demographic segment is the Post-2000s (Gen Z/Alpha) group, representing 50% of guests.
Recommendations for Hosts
- Target domestic marketing efforts towards travelers from Sydney and New South Wales.
- Tailor amenities and listing descriptions to appeal to the dominant Post-2000s (Gen Z/Alpha) demographic (e.g., highlight fast WiFi, smart home features, local guides).
- Highlight unique local experiences or amenities relevant to the primary guest profile.
- Consider seasonal promotions aligned with peak travel times for key origin markets.
Nearby Short-Term Rental Market Comparison
How does the Newcastle-Maitland Airbnb market stack up against its neighbors? Compare key performance metrics like average monthly revenue, ADR, and occupancy rates in surrounding areas to understand the broader regional STR landscape.
| Market | Active Properties | Monthly Revenue | Daily Rate | Avg. Occupancy |
|---|---|---|---|---|
| Green Point | 16 | $4,869 | $360.27 | 48% |
| Dora Creek | 17 | $4,613 | $370.02 | 45% |
| Singleton Council | 154 | $4,304 | $517.74 | 32% |
| Nulkaba | 37 | $4,242 | $524.17 | 30% |
| Broke | 58 | $4,084 | $448.99 | 32% |
| Branxton | 17 | $4,019 | $399.77 | 32% |
| Cessnock | 493 | $3,878 | $416.89 | 35% |
| Coomba Park | 31 | $3,858 | $395.11 | 39% |
| Millfield | 29 | $3,809 | $385.13 | 35% |
| Cessnock City Council | 127 | $3,776 | $436.62 | 35% |