Nambucca Valley Council Airbnb Market Analysis 2025: Short Term Rental Data & Vacation Rental Statistics in New South Wales, Australia
Is Airbnb profitable in Nambucca Valley Council in 2025? Explore comprehensive Airbnb analytics for Nambucca Valley Council, New South Wales, Australia to uncover income potential. This 2025 STR market report for Nambucca Valley Council, based on AirROI data from April 2024 to March 2025, reveals key trends in the niche market of 27 active listings.
Whether you're considering an Airbnb investment in Nambucca Valley Council, optimizing your existing vacation rental, or exploring rental arbitrage opportunities, understanding the Nambucca Valley Council Airbnb data is crucial. Navigating the high regulation landscape is key to maximizing your short term rental income potential. Let's dive into the specifics.
Key Nambucca Valley Council Airbnb Performance Metrics Overview
Monthly Airbnb Revenue Variations & Income Potential in Nambucca Valley Council (2025)
Understanding the monthly revenue variations for Airbnb listings in Nambucca Valley Council is key to maximizing your short term rental income potential. Seasonality significantly impacts earnings. Our analysis, based on data from the past 12 months, shows that the peak revenue month for STRs in Nambucca Valley Council is typically December, while March often presents the lowest earnings, highlighting opportunities for strategic pricing adjustments during shoulder and low seasons. Explore the typical Airbnb income in Nambucca Valley Council across different performance tiers:
- Best-in-class properties (Top 10%) achieve $4,362+ monthly, often utilizing dynamic pricing and superior guest experiences.
- Strong performing properties (Top 25%) earn $3,075 or more, indicating effective management and desirable locations/amenities.
- Typical properties (Median) generate around $1,931 per month, representing the average market performance.
- Entry-level properties (Bottom 25%) see earnings around $984, often with potential for optimization.
Average Monthly Airbnb Earnings Trend in Nambucca Valley Council
Nambucca Valley Council Airbnb Occupancy Rate Trends (2025)
Maximize your bookings by understanding the Nambucca Valley Council STR occupancy trends. Seasonal demand shifts significantly influence how often properties are booked. Typically, Decembersees the highest demand (peak season occupancy), while March experiences the lowest (low season). Effective strategies, like adjusting minimum stays or offering promotions, can boost occupancy during slower periods. Here's how different property tiers perform in Nambucca Valley Council:
- Best-in-class properties (Top 10%) achieve 77%+ occupancy, indicating high desirability and potentially optimized availability.
- Strong performing properties (Top 25%) maintain 59% or higher occupancy, suggesting good market fit and guest satisfaction.
- Typical properties (Median) have an occupancy rate around 40%.
- Entry-level properties (Bottom 25%) average 20% occupancy, potentially facing higher vacancy.
Average Monthly Occupancy Rate Trend in Nambucca Valley Council
Average Daily Rate (ADR) Airbnb Trends in Nambucca Valley Council (2025)
Effective short term rental pricing strategy in Nambucca Valley Council involves understanding monthly ADR fluctuations. The Average Daily Rate (ADR) for Airbnb in Nambucca Valley Council typically peaks in January and dips lowest during March. Leveraging Airbnb dynamic pricing tools or strategies based on this seasonality can significantly boost revenue. Here's a look at the typical nightly rates achieved:
- Best-in-class properties (Top 10%) command rates of $355+ per night, often due to premium features or locations.
- Strong performing properties (Top 25%) achieve nightly rates of $217 or more.
- Typical properties (Median) charge around $158 per night.
- Entry-level properties (Bottom 25%) earn around $117 per night.
Average Daily Rate (ADR) Trend by Month in Nambucca Valley Council
Get Live Nambucca Valley Council Market Intelligence 👇

Explore Real-time Analytics
Airbnb Seasonality Analysis & Trends in Nambucca Valley Council (2025)
Peak Season (December, January, October)
- Revenue averages $3,161 per month
- Occupancy rates average 51.3%
- Daily rates average $203
Shoulder Season
- Revenue averages $2,123 per month
- Occupancy maintains around 41.2%
- Daily rates hold near $190
Low Season (February, March, August)
- Revenue drops to average $1,561 per month
- Occupancy decreases to average 35.8%
- Daily rates adjust to average $182
Seasonality Insights for Nambucca Valley Council
- The Airbnb seasonality in Nambucca Valley Council shows highly seasonal trends requiring careful strategy. While the sections above show seasonal averages, it's also insightful to look at the extremes:
- During the high season, the absolute peak month showcases Nambucca Valley Council's highest earning potential, with monthly revenues capable of climbing to $3,590, occupancy reaching a high of 54.7%, and ADRs peaking at $209.
- Conversely, the slowest single month of the year, typically falling within the low season, marks the market's lowest point. In this month, revenue might dip to $1,270, occupancy could drop to 29.4%, and ADRs may adjust down to $176.
- Understanding both the seasonal averages and these monthly peaks and troughs in revenue, occupancy, and ADR is crucial for maximizing your Airbnb profit potential in Nambucca Valley Council.
Seasonal Strategies for Maximizing Profit
- Peak Season: Maximize revenue through premium pricing and potentially longer minimum stays. Ensure high availability.
- Low Season: Offer competitive pricing, special promotions (e.g., extended stay discounts), and flexible cancellation policies. Target off-season travelers like remote workers or budget-conscious guests.
- Shoulder Seasons: Implement dynamic pricing that balances peak and low rates. Target weekend travelers or specific events. Offer slightly more flexible terms than peak season.
- Regularly analyze your own performance against these Nambucca Valley Council seasonality benchmarks and adjust your pricing and availability strategy accordingly.
Best Areas for Airbnb Investment in Nambucca Valley Council (2025)
Exploring the top neighborhoods for short-term rentals in Nambucca Valley Council? This section highlights key areas, outlining why they are attractive for hosts and guests, along with notable local attractions. Consider these locations based on your target guest profile and investment strategy.
| Neighborhood / Area | Why Host Here? (Target Guests & Appeal) | Key Attractions & Landmarks |
|---|---|---|
| Nambucca Heads | A picturesque coastal town known for its stunning beaches and vibrant village atmosphere. Ideal for tourists seeking relaxation, water sports, and stunning natural scenery. | Nambucca River, Main Beach, Shelly Beach, Nambucca Heads Lookout, Valla Beach |
| Macksville | A charming town offering a taste of rural life with close proximity to the coast. Great for visitors looking for a mix of country and coastal experiences. | Macksville Historical Museum, Riverside Park, Nambucca River, Macksville Golf Club |
| Valla Beach | A beautiful seaside destination known for its laid-back vibe and pristine beaches, attracting families and surfers alike. | Valla Beach, Bellingen River, Valla Beach Nature Reserve, Shell Museum |
| Scotts Head | A small coastal village providing a serene escape with surfing spots and lovely walking trails. It attracts visitors looking for nature and tranquility. | Scotts Head Beach, South Head Walking Track, Weeping what Tree, Scotts Head Lookout |
| Belligen | A vibrant town known for its artsy vibe and festivals, appealing to tourists looking for culture, music, and beautiful landscapes. | Bellingen Markets, Bellingen River, Old Bellingen Bridge, Fernmount |
| Urunga | A lovely coastal town with beautiful estuary views, perfect for those seeking a relaxed holiday surrounded by nature. | Urunga Boardwalk, Urunga Beach, Mature Tree Reserve, Urunga River |
| Nana Glen | A beautiful hinterland area attracting visitors for its rural charm, close to national parks and outdoor activities. | Nana Glen Village, Coramba Falls, Nana Glen Nature Reserve, Timor State Forest |
| Thora | A serene rural setting near the Nambucca Valley, ideal for eco-tourism and nature lovers seeking retreat from urban life. | Thora Falls, Macleay Valley, Kunde Cafe, nearby national parks |
Understanding Airbnb License Requirements & STR Laws in Nambucca Valley Council (2025)
Yes, Nambucca Valley Council, New South Wales, Australia enforces high STR regulations. Obtaining a license and ensuring compliance is almost certainly required according to current 2025 STR laws. Always verify the latest short term rental regulations and Airbnb license requirements directly with local government authorities for Nambucca Valley Council to ensure full compliance before hosting.
(Source: AirROI data, 2025, based on 93% licensed listings)
Top Performing Airbnb Properties in Nambucca Valley Council (2025)
Benchmark your potential! Explore examples of top-performing Airbnb properties in Nambucca Valley Councilbased on Trailing Twelve Month (TTM) revenue. Analyze their characteristics, revenue, occupancy rate, and ADR to understand what drives success in this market.
Way Away Cabin
Entire Place • 1 bedroom

Luxury Farmhouse Escape
Entire Place • 3 bedrooms

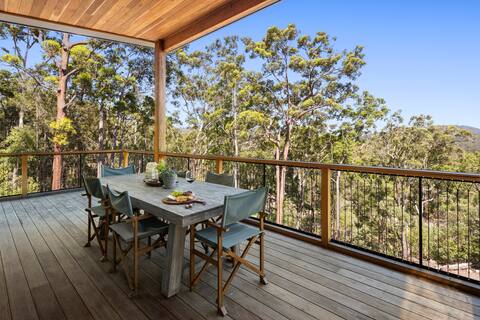
Seascape The Deck
Entire Place • 2 bedrooms
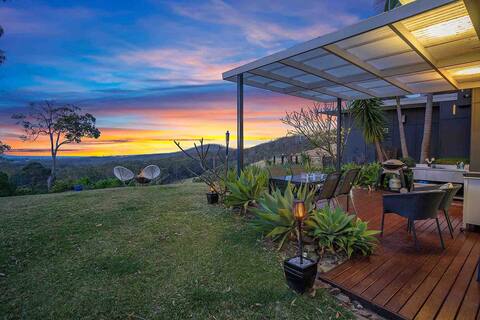
Sarana at Scotts Head, stunning ocean & bush views
Entire Place • 1 bedroom

Scotts Head Whale Watching! Ocean Front Villa.
Entire Place • 3 bedrooms
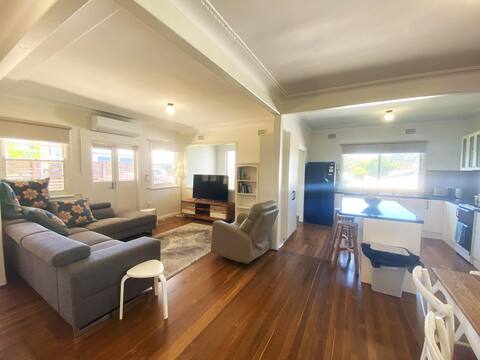
Family Beach Get Away
Entire Place • 4 bedrooms
Note: Performance varies based on location, size, amenities, seasonality, and management quality. Data reflects the past 12 months.
Top Performing Airbnb Hosts in Nambucca Valley Council (2025)
Learn from the best! This table showcases top-performing Airbnb hosts in Nambucca Valley Council based on the number of properties managed and estimated total revenue over the past year. Analyze their scale and performance metrics.
| Host Name | Properties | Grossing Revenue | Stay Reviews | Avg Rating |
|---|---|---|---|---|
| Zac | 3 | $77,181 | 917 | 4.94/5.0 |
| Alexandra | 2 | $55,095 | 23 | 4.66/5.0 |
| Cate | 1 | $52,144 | 30 | 4.97/5.0 |
| Dave | 2 | $41,284 | 557 | 4.97/5.0 |
| Host #49820539 | 1 | $34,613 | 352 | 4.99/5.0 |
| Steve | 1 | $32,026 | 66 | 4.80/5.0 |
| Roberts Nambucca | 1 | $31,833 | 3 | 3.00/5.0 |
| Holiday Coffs Coast | 1 | $28,413 | 5 | 5.00/5.0 |
| Nadia | 1 | $26,969 | 15 | 5.00/5.0 |
| Mick | 1 | $26,638 | 302 | 4.99/5.0 |
Analyzing the strategies of top hosts, such as their property selection, pricing, and guest communication, can offer valuable lessons for optimizing your own Airbnb operations in Nambucca Valley Council.
Dive Deeper: Advanced Nambucca Valley Council STR Market Data (2025)
Ready to unlock more insights? AirROI provides access to advanced metrics and comprehensive Airbnb data for Nambucca Valley Council. Explore detailed analytics beyond this report to refine your investment strategy, optimize pricing, and maximize your vacation rental profits.
Explore Advanced MetricsNambucca Valley Council Short-Term Rental Market Composition (2025): Property & Room Types
Room Type Distribution
Property Type Distribution
Market Composition Insights for Nambucca Valley Council
- The Nambucca Valley Council Airbnb market composition is heavily skewed towards Entire Home/Apt listings, which make up 96.3% of the 27 active rentals. This indicates strong guest preference for privacy and space.
- Looking at the property type distribution in Nambucca Valley Council, House properties are the most common (59.3%), reflecting the local real estate landscape.
- Houses represent a significant 59.3% portion, catering likely to families or larger groups.
- Smaller segments like hotel/boutique (combined 3.7%) offer potential for unique stay experiences.
Nambucca Valley Council Airbnb Room Capacity Analysis (2025): Bedroom Distribution
Distribution of Listings by Number of Bedrooms
Room Capacity Insights for Nambucca Valley Council
- The dominant room capacity in Nambucca Valley Council is 1 bedroom listings, making up 48.1% of the market. This suggests a strong demand for properties suitable for couples or solo travelers.
- Together, 1 bedroom and 2 bedrooms properties represent 70.3% of the active Airbnb listings in Nambucca Valley Council, indicating a high concentration in these sizes.
- A significant 29.6% of listings offer 3+ bedrooms, catering to larger groups and families seeking more space in Nambucca Valley Council.
Nambucca Valley Council Vacation Rental Guest Capacity Trends (2025)
Distribution of Listings by Guest Capacity
Guest Capacity Insights for Nambucca Valley Council
- The most common guest capacity trend in Nambucca Valley Council vacation rentals is listings accommodating 2 guests (44.4%). This suggests the primary traveler segment is likely couples or solo travelers.
- Properties designed for 2 guests and 8+ guests dominate the Nambucca Valley Council STR market, accounting for 66.6% of listings.
- A significant 44.4% of listings cater specifically to 1-2 guests, highlighting strong demand from couples and solo travelers in Nambucca Valley Council.
- 29.6% of properties accommodate 6+ guests, serving the market segment for larger families or group travel in Nambucca Valley Council.
- On average, properties in Nambucca Valley Council are equipped to host 4.1 guests.
Nambucca Valley Council Airbnb Booking Patterns (2025): Available vs. Booked Days
Available Days Distribution
Booked Days Distribution
Booking Pattern Insights for Nambucca Valley Council
- The most common availability pattern in Nambucca Valley Council falls within the 181-270 days range, representing 37% of listings. This suggests many properties have significant open periods on their calendars.
- Approximately 70.3% of listings show high availability (181+ days open annually), indicating potential for increased bookings or specific owner usage patterns.
- For booked days, the 91-180 days range is most frequent in Nambucca Valley Council (37%), reflecting common guest stay durations or potential owner blocking patterns.
- A notable 29.6% of properties secure long booking periods (181+ days booked per year), highlighting successful long-term rental strategies or significant owner usage.
Nambucca Valley Council Airbnb Minimum Stay Requirements Analysis
Distribution of Listings by Minimum Night Requirement
1 Night
7 listings
26.9% of total
2 Nights
7 listings
26.9% of total
3 Nights
1 listings
3.8% of total
4-6 Nights
1 listings
3.8% of total
7-29 Nights
3 listings
11.5% of total
30+ Nights
7 listings
26.9% of total
Key Insights
- The most prevalent minimum stay requirement in Nambucca Valley Council is 1 Night, adopted by 26.9% of listings. This highlights the market's preference for shorter, flexible bookings.
- A significant segment (26.9%) caters to monthly stays (30+ nights) in Nambucca Valley Council, pointing to opportunities in the extended-stay market.
Recommendations
- Align with the market by considering a 1 Night minimum stay, as 26.9% of Nambucca Valley Council hosts use this setting.
- If feasible, allowing 1-night stays, especially midweek or during low season, could capture last-minute bookings, as only 26.9% currently do.
- Explore offering discounts for stays of 30+ nights to attract the 26.9% of the market seeking extended stays.
- Adjust minimum nights based on seasonality – potentially shorter during low season and longer during peak demand periods in Nambucca Valley Council.
Nambucca Valley Council Airbnb Cancellation Policy Trends Analysis (2025)
Super Strict 60 Days
3 listings
11.5% of total
Super Strict 30 Days
1 listings
3.8% of total
Flexible
10 listings
38.5% of total
Moderate
4 listings
15.4% of total
Firm
5 listings
19.2% of total
Strict
3 listings
11.5% of total
Cancellation Policy Insights for Nambucca Valley Council
- The prevailing Airbnb cancellation policy trend in Nambucca Valley Council is Flexible, used by 38.5% of listings.
- There's a relatively balanced mix between guest-friendly (53.9%) and stricter (30.7%) policies, offering choices for different guest needs.
Recommendations for Hosts
- Consider adopting a Flexible policy to align with the 38.5% market standard in Nambucca Valley Council.
- Using a Strict policy might deter some guests, as only 11.5% of listings use it. Evaluate if potential revenue protection outweighs possible lower booking rates.
- Regularly review your cancellation policy against competitors and market demand shifts in Nambucca Valley Council.
Nambucca Valley Council STR Booking Lead Time Analysis (2025)
Average Booking Lead Time by Month
Booking Lead Time Insights for Nambucca Valley Council
- The overall average booking lead time for vacation rentals in Nambucca Valley Council is 51 days.
- Guests book furthest in advance for stays during December (average 80 days), likely coinciding with peak travel demand or local events.
- The shortest booking windows occur for stays in May (average 38 days), indicating more last-minute travel plans during this time.
- Seasonally, Winter (66 days avg.) sees the longest lead times, while Spring (43 days avg.) has the shortest, reflecting typical travel planning cycles.
Recommendations for Hosts
- Use the overall average lead time (51 days) as a baseline for your pricing and availability strategy in Nambucca Valley Council.
- For December stays, consider implementing length-of-stay discounts or slightly higher rates for bookings made less than 80 days out to capitalize on advance planning.
- Target marketing efforts for the Winter season well in advance (at least 66 days) to capture early planners.
- Monitor your own booking lead times against these Nambucca Valley Council averages to identify opportunities for dynamic pricing adjustments.
Popular & Essential Airbnb Amenities in Nambucca Valley Council (2025)
Amenity Prevalence
Amenity Insights for Nambucca Valley Council
- Essential amenities in Nambucca Valley Council that guests expect include: Refrigerator, Free parking on premises, Dishes and silverware, Smoke alarm. Lacking these (any) could significantly impact bookings.
- Popular amenities like Wifi, Kitchen, Heating are common but not universal. Offering these can provide a competitive edge.
- Warning: Wifi is not universally provided but is considered essential globally. Ensure reliable Wifi is offered.
Recommendations for Hosts
- Ensure your listing includes all essential amenities for Nambucca Valley Council: Refrigerator, Free parking on premises, Dishes and silverware, Smoke alarm.
- Prioritize adding missing essentials: Free parking on premises, Dishes and silverware, Smoke alarm.
- Consider adding popular differentiators like Wifi or Kitchen to increase appeal.
- Highlight unique or less common amenities you offer (e.g., hot tub, dedicated workspace, EV charger) in your listing description and photos.
- Regularly check competitor amenities in Nambucca Valley Council to stay competitive.
Nambucca Valley Council Airbnb Guest Demographics & Profile Analysis (2025)
Guest Profile Summary for Nambucca Valley Council
- The typical guest profile for Airbnb in Nambucca Valley Council consists of primarily domestic travelers (90%), often arriving from nearby Sydney, typically belonging to the Post-2000s (Gen Z/Alpha) group (50%), primarily speaking English or German.
- Domestic travelers account for 89.7% of guests.
- Key international markets include Australia (89.7%) and United States (2.4%).
- Top languages spoken are English (66.8%) followed by German (5.2%).
- A significant demographic segment is the Post-2000s (Gen Z/Alpha) group, representing 50% of guests.
Recommendations for Hosts
- Target domestic marketing efforts towards travelers from Sydney and New South Wales.
- Tailor amenities and listing descriptions to appeal to the dominant Post-2000s (Gen Z/Alpha) demographic (e.g., highlight fast WiFi, smart home features, local guides).
- Highlight unique local experiences or amenities relevant to the primary guest profile.
- Consider seasonal promotions aligned with peak travel times for key origin markets.
Nearby Short-Term Rental Market Comparison
How does the Nambucca Valley Council Airbnb market stack up against its neighbors? Compare key performance metrics like average monthly revenue, ADR, and occupancy rates in surrounding areas to understand the broader regional STR landscape.
| Market | Active Properties | Monthly Revenue | Daily Rate | Avg. Occupancy |
|---|---|---|---|---|
| Evans Head | 53 | $3,039 | $319.89 | 39% |
| Sawtell | 141 | $2,907 | $260.87 | 44% |
| Minnie Water | 15 | $2,814 | $227.80 | 42% |
| Yamba | 379 | $2,714 | $306.86 | 38% |
| Gleniffer | 35 | $2,650 | $341.78 | 35% |
| Clarence Valley Council | 74 | $2,611 | $248.17 | 38% |
| Brooms Head | 22 | $2,565 | $252.25 | 37% |
| Mylestom | 13 | $2,544 | $257.18 | 34% |
| Coffs Harbour | 337 | $2,523 | $237.18 | 42% |
| Emerald Beach | 46 | $2,519 | $262.73 | 40% |