Mulwala Airbnb Market Analysis 2025: Short Term Rental Data & Vacation Rental Statistics in New South Wales, Australia
Is Airbnb profitable in Mulwala in 2025? Explore comprehensive Airbnb analytics for Mulwala, New South Wales, Australia to uncover income potential. This 2025 STR market report for Mulwala, based on AirROI data from April 2024 to March 2025, reveals key trends in the niche market of 55 active listings.
Whether you're considering an Airbnb investment in Mulwala, optimizing your existing vacation rental, or exploring rental arbitrage opportunities, understanding the Mulwala Airbnb data is crucial. Navigating the high regulation landscape is key to maximizing your short term rental income potential. Let's dive into the specifics.
Key Mulwala Airbnb Performance Metrics Overview
Monthly Airbnb Revenue Variations & Income Potential in Mulwala (2025)
Understanding the monthly revenue variations for Airbnb listings in Mulwala is key to maximizing your short term rental income potential. Seasonality significantly impacts earnings. Our analysis, based on data from the past 12 months, shows that the peak revenue month for STRs in Mulwala is typically January, while July often presents the lowest earnings, highlighting opportunities for strategic pricing adjustments during shoulder and low seasons. Explore the typical Airbnb income in Mulwala across different performance tiers:
- Best-in-class properties (Top 10%) achieve $6,945+ monthly, often utilizing dynamic pricing and superior guest experiences.
- Strong performing properties (Top 25%) earn $4,227 or more, indicating effective management and desirable locations/amenities.
- Typical properties (Median) generate around $2,430 per month, representing the average market performance.
- Entry-level properties (Bottom 25%) see earnings around $1,438, often with potential for optimization.
Average Monthly Airbnb Earnings Trend in Mulwala
Mulwala Airbnb Occupancy Rate Trends (2025)
Maximize your bookings by understanding the Mulwala STR occupancy trends. Seasonal demand shifts significantly influence how often properties are booked. Typically, Januarysees the highest demand (peak season occupancy), while June experiences the lowest (low season). Effective strategies, like adjusting minimum stays or offering promotions, can boost occupancy during slower periods. Here's how different property tiers perform in Mulwala:
- Best-in-class properties (Top 10%) achieve 59%+ occupancy, indicating high desirability and potentially optimized availability.
- Strong performing properties (Top 25%) maintain 45% or higher occupancy, suggesting good market fit and guest satisfaction.
- Typical properties (Median) have an occupancy rate around 28%.
- Entry-level properties (Bottom 25%) average 15% occupancy, potentially facing higher vacancy.
Average Monthly Occupancy Rate Trend in Mulwala
Average Daily Rate (ADR) Airbnb Trends in Mulwala (2025)
Effective short term rental pricing strategy in Mulwala involves understanding monthly ADR fluctuations. The Average Daily Rate (ADR) for Airbnb in Mulwala typically peaks in January and dips lowest during August. Leveraging Airbnb dynamic pricing tools or strategies based on this seasonality can significantly boost revenue. Here's a look at the typical nightly rates achieved:
- Best-in-class properties (Top 10%) command rates of $586+ per night, often due to premium features or locations.
- Strong performing properties (Top 25%) achieve nightly rates of $448 or more.
- Typical properties (Median) charge around $319 per night.
- Entry-level properties (Bottom 25%) earn around $178 per night.
Average Daily Rate (ADR) Trend by Month in Mulwala
Get Live Mulwala Market Intelligence 👇

Explore Real-time Analytics
Airbnb Seasonality Analysis & Trends in Mulwala (2025)
Peak Season (January, April, December)
- Revenue averages $4,932 per month
- Occupancy rates average 41.4%
- Daily rates average $355
Shoulder Season
- Revenue averages $3,051 per month
- Occupancy maintains around 30.6%
- Daily rates hold near $333
Low Season (July, August, September)
- Revenue drops to average $2,306 per month
- Occupancy decreases to average 24.8%
- Daily rates adjust to average $322
Seasonality Insights for Mulwala
- The Airbnb seasonality in Mulwala shows highly seasonal trends requiring careful strategy. While the sections above show seasonal averages, it's also insightful to look at the extremes:
- During the high season, the absolute peak month showcases Mulwala's highest earning potential, with monthly revenues capable of climbing to $6,223, occupancy reaching a high of 53.1%, and ADRs peaking at $376.
- Conversely, the slowest single month of the year, typically falling within the low season, marks the market's lowest point. In this month, revenue might dip to $2,227, occupancy could drop to 22.0%, and ADRs may adjust down to $318.
- Understanding both the seasonal averages and these monthly peaks and troughs in revenue, occupancy, and ADR is crucial for maximizing your Airbnb profit potential in Mulwala.
Seasonal Strategies for Maximizing Profit
- Peak Season: Maximize revenue through premium pricing and potentially longer minimum stays. Ensure high availability.
- Low Season: Offer competitive pricing, special promotions (e.g., extended stay discounts), and flexible cancellation policies. Target off-season travelers like remote workers or budget-conscious guests.
- Shoulder Seasons: Implement dynamic pricing that balances peak and low rates. Target weekend travelers or specific events. Offer slightly more flexible terms than peak season.
- Regularly analyze your own performance against these Mulwala seasonality benchmarks and adjust your pricing and availability strategy accordingly.
Best Areas for Airbnb Investment in Mulwala (2025)
Exploring the top neighborhoods for short-term rentals in Mulwala? This section highlights key areas, outlining why they are attractive for hosts and guests, along with notable local attractions. Consider these locations based on your target guest profile and investment strategy.
| Neighborhood / Area | Why Host Here? (Target Guests & Appeal) | Key Attractions & Landmarks |
|---|---|---|
| Lake Mulwala | A popular location for water activities, fishing, and relaxing by the lake. Attracts families and holidaymakers looking for a peaceful retreat. | Lake Mulwala, Mulwala Waterski Club, Fishing spots, Walking trails, Local parks |
| Mulwala Resort Area | Home to several resorts, this area offers a range of amenities and activities for guests looking for comfort and entertainment. | Mulwala Water Ski Club, Beach areas, Resort amenities, Dining options, Spa services |
| Yarrawonga | Close to Mulwala, Yarrawonga has a thriving community and offers numerous attractions that appeal to tourists, including attractions related to the Murray River. | Murray River, Yarrawonga Mulwala Golf Club, Local wineries, Walking trails along the river, Shopping precinct |
| Heritage Drive | A scenic area with picturesque views and close proximity to the lake, ideal for visitors who enjoy nature and tranquility. | Walking and biking trails, Scenic outlooks, Nearby parks and picnic areas |
| Mulwala CBD | The central business district with easy access to services, shopping, and dining, making it convenient for visitors to explore local culture. | Local shops, Cafes and restaurants, Cultural events, Market days |
| Murray River Beaches | Known for tranquil beaches along the Murray River, this area attracts those looking to unwind and enjoy nature's beauty. | River beaches, Picnic spots, Fishing sites, Kayaking |
| Mulwala Holiday Parks | These parks provide family-friendly accommodation options and outdoor activities, drawing in families and groups. | Camping facilities, Water sports, Playgrounds, Community events |
| Local Vineyards and Wineries | The area has several wineries that offer tastings and dining, appealing to wine enthusiasts and foodies. | Local wineries, Wine tasting tours, Gourmet dining experiences, Scenic vineyard views |
Understanding Airbnb License Requirements & STR Laws in Mulwala (2025)
Yes, Mulwala, New South Wales, Australia enforces high STR regulations. Obtaining a license and ensuring compliance is almost certainly required according to current 2025 STR laws. Always verify the latest short term rental regulations and Airbnb license requirements directly with local government authorities for Mulwala to ensure full compliance before hosting.
(Source: AirROI data, 2025, based on 78% licensed listings)
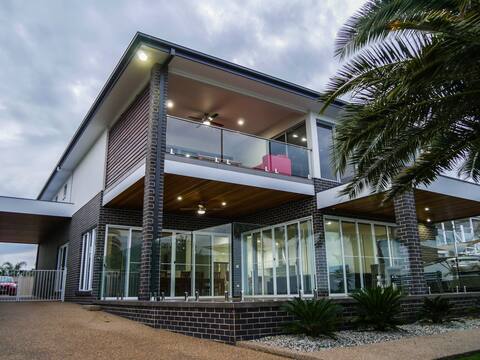
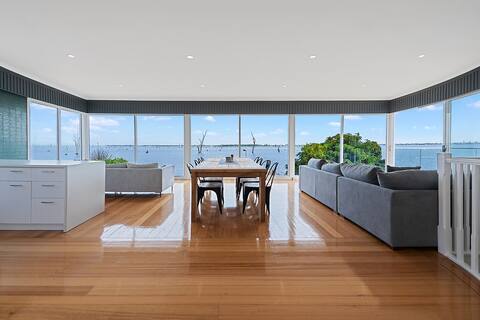
Top Performing Airbnb Properties in Mulwala (2025)
Benchmark your potential! Explore examples of top-performing Airbnb properties in Mulwalabased on Trailing Twelve Month (TTM) revenue. Analyze their characteristics, revenue, occupancy rate, and ADR to understand what drives success in this market.
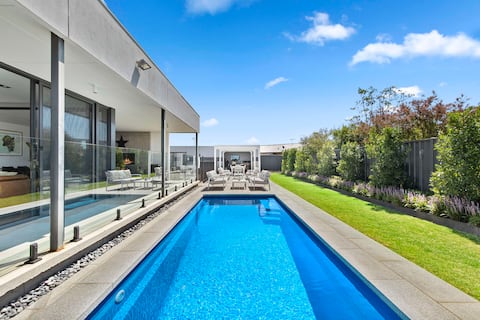
The Sinatra Holiday House - 12 single beds
Entire Place • 5 bedrooms
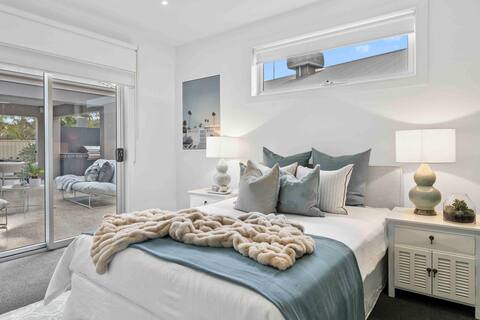
Luxe private retreat
Entire Place • 4 bedrooms

Howe Goods Manners.
Entire Place • 5 bedrooms
2025 bookings will be opened up soon.
Entire Place • 6 bedrooms
The View, Lake Mulwala
Entire Place • 4 bedrooms

The House
Entire Place • 5 bedrooms
Note: Performance varies based on location, size, amenities, seasonality, and management quality. Data reflects the past 12 months.
Top Performing Airbnb Hosts in Mulwala (2025)
Learn from the best! This table showcases top-performing Airbnb hosts in Mulwala based on the number of properties managed and estimated total revenue over the past year. Analyze their scale and performance metrics.
| Host Name | Properties | Grossing Revenue | Stay Reviews | Avg Rating |
|---|---|---|---|---|
| Yarrawonga Escapes | 17 | $480,820 | 138 | 2.24/5.0 |
| Waterfront Holiday Houses Pty | 6 | $201,182 | 117 | 4.88/5.0 |
| Tara And Peter | 1 | $93,023 | 24 | 4.92/5.0 |
| Selena | 1 | $70,300 | 84 | 4.94/5.0 |
| Kaye | 1 | $68,871 | 44 | 4.98/5.0 |
| Brenda | 2 | $64,073 | 53 | 4.92/5.0 |
| Sean | 1 | $60,710 | 10 | 4.80/5.0 |
| Meaghan | 1 | $60,569 | 12 | 5.00/5.0 |
| Lee | 1 | $60,483 | 71 | 4.94/5.0 |
| Kylie | 1 | $46,051 | 8 | 4.75/5.0 |
Analyzing the strategies of top hosts, such as their property selection, pricing, and guest communication, can offer valuable lessons for optimizing your own Airbnb operations in Mulwala.
Dive Deeper: Advanced Mulwala STR Market Data (2025)
Ready to unlock more insights? AirROI provides access to advanced metrics and comprehensive Airbnb data for Mulwala. Explore detailed analytics beyond this report to refine your investment strategy, optimize pricing, and maximize your vacation rental profits.
Explore Advanced MetricsMulwala Short-Term Rental Market Composition (2025): Property & Room Types
Room Type Distribution
Property Type Distribution
Market Composition Insights for Mulwala
- The Mulwala Airbnb market composition is heavily skewed towards Entire Home/Apt listings, which make up 100% of the 55 active rentals. This indicates strong guest preference for privacy and space.
- Looking at the property type distribution in Mulwala, House properties are the most common (60%), reflecting the local real estate landscape.
- Houses represent a significant 60% portion, catering likely to families or larger groups.
- Smaller segments like hotel/boutique, outdoor/unique (combined 5.4%) offer potential for unique stay experiences.
Mulwala Airbnb Room Capacity Analysis (2025): Bedroom Distribution
Distribution of Listings by Number of Bedrooms
Room Capacity Insights for Mulwala
- The dominant room capacity in Mulwala is 3 bedrooms listings, making up 32.7% of the market. This suggests a strong demand for properties suitable for families or small groups.
- Together, 3 bedrooms and 2 bedrooms properties represent 60.0% of the active Airbnb listings in Mulwala, indicating a high concentration in these sizes.
- A significant 69.1% of listings offer 3+ bedrooms, catering to larger groups and families seeking more space in Mulwala.
Mulwala Vacation Rental Guest Capacity Trends (2025)
Distribution of Listings by Guest Capacity
Guest Capacity Insights for Mulwala
- The most common guest capacity trend in Mulwala vacation rentals is listings accommodating 8+ guests (52.7%). This suggests the primary traveler segment is likely larger groups.
- Properties designed for 8+ guests and 6 guests dominate the Mulwala STR market, accounting for 70.9% of listings.
- 78.2% of properties accommodate 6+ guests, serving the market segment for larger families or group travel in Mulwala.
- On average, properties in Mulwala are equipped to host 6.7 guests.
Mulwala Airbnb Booking Patterns (2025): Available vs. Booked Days
Available Days Distribution
Booked Days Distribution
Booking Pattern Insights for Mulwala
- The most common availability pattern in Mulwala falls within the 271-366 days range, representing 54.5% of listings. This suggests many properties have significant open periods on their calendars.
- Approximately 87.2% of listings show high availability (181+ days open annually), indicating potential for increased bookings or specific owner usage patterns.
- For booked days, the 91-180 days range is most frequent in Mulwala (38.2%), reflecting common guest stay durations or potential owner blocking patterns.
- A notable 12.7% of properties secure long booking periods (181+ days booked per year), highlighting successful long-term rental strategies or significant owner usage.
Mulwala Airbnb Minimum Stay Requirements Analysis
Distribution of Listings by Minimum Night Requirement
1 Night
3 listings
5.7% of total
2 Nights
15 listings
28.3% of total
3 Nights
16 listings
30.2% of total
7-29 Nights
2 listings
3.8% of total
30+ Nights
17 listings
32.1% of total
Key Insights
- The most prevalent minimum stay requirement in Mulwala is 30+ Nights, adopted by 32.1% of listings. This highlights the market's preference for longer commitments.
- A significant segment (32.1%) caters to monthly stays (30+ nights) in Mulwala, pointing to opportunities in the extended-stay market.
Recommendations
- Align with the market by considering a 30+ Nights minimum stay, as 32.1% of Mulwala hosts use this setting.
- If feasible, allowing 1-night stays, especially midweek or during low season, could capture last-minute bookings, as only 5.7% currently do.
- Explore offering discounts for stays of 30+ nights to attract the 32.1% of the market seeking extended stays.
- Adjust minimum nights based on seasonality – potentially shorter during low season and longer during peak demand periods in Mulwala.
Mulwala Airbnb Cancellation Policy Trends Analysis (2025)
Super Strict 60 Days
1 listings
2.3% of total
Super Strict 30 Days
2 listings
4.5% of total
Flexible
3 listings
6.8% of total
Moderate
14 listings
31.8% of total
Firm
5 listings
11.4% of total
Strict
19 listings
43.2% of total
Cancellation Policy Insights for Mulwala
- The prevailing Airbnb cancellation policy trend in Mulwala is Strict, used by 43.2% of listings.
- A majority (54.6%) of hosts in Mulwala utilize Firm or Strict policies, indicating a market where hosts prioritize booking security.
Recommendations for Hosts
- Consider adopting a Strict policy to align with the 43.2% market standard in Mulwala.
- With 43.2% using Strict terms, this is a viable option in Mulwala, particularly for high-value properties or during peak demand periods.
- Regularly review your cancellation policy against competitors and market demand shifts in Mulwala.
Mulwala STR Booking Lead Time Analysis (2025)
Average Booking Lead Time by Month
Booking Lead Time Insights for Mulwala
- The overall average booking lead time for vacation rentals in Mulwala is 85 days.
- Guests book furthest in advance for stays during March (average 116 days), likely coinciding with peak travel demand or local events.
- The shortest booking windows occur for stays in August (average 26 days), indicating more last-minute travel plans during this time.
- Seasonally, Winter (94 days avg.) sees the longest lead times, while Summer (41 days avg.) has the shortest, reflecting typical travel planning cycles.
Recommendations for Hosts
- Use the overall average lead time (85 days) as a baseline for your pricing and availability strategy in Mulwala.
- For March stays, consider implementing length-of-stay discounts or slightly higher rates for bookings made less than 116 days out to capitalize on advance planning.
- Target marketing efforts for the Winter season well in advance (at least 94 days) to capture early planners.
- Monitor your own booking lead times against these Mulwala averages to identify opportunities for dynamic pricing adjustments.
Popular & Essential Airbnb Amenities in Mulwala (2025)
Amenity Prevalence
Amenity Insights for Mulwala
- Essential amenities in Mulwala that guests expect include: TV, Air conditioning, Smoke alarm, Kitchen, Free parking on premises, Washer. Lacking these (any) could significantly impact bookings.
- Popular amenities like Refrigerator, Iron, Microwave are common but not universal. Offering these can provide a competitive edge.
Recommendations for Hosts
- Ensure your listing includes all essential amenities for Mulwala: TV, Air conditioning, Smoke alarm, Kitchen, Free parking on premises, Washer.
- Prioritize adding missing essentials: Smoke alarm, Kitchen, Free parking on premises, Washer.
- Consider adding popular differentiators like Refrigerator or Iron to increase appeal.
- Highlight unique or less common amenities you offer (e.g., hot tub, dedicated workspace, EV charger) in your listing description and photos.
- Regularly check competitor amenities in Mulwala to stay competitive.
Mulwala Airbnb Guest Demographics & Profile Analysis (2025)
Guest Profile Summary for Mulwala
- The typical guest profile for Airbnb in Mulwala consists of primarily domestic travelers (98%), often arriving from nearby Melbourne, typically belonging to the Post-2000s (Gen Z/Alpha) group (50%), primarily speaking English or Italian.
- Domestic travelers account for 97.5% of guests.
- Key international markets include Australia (97.5%) and New Zealand (0.8%).
- Top languages spoken are English (89.6%) followed by Italian (3%).
- A significant demographic segment is the Post-2000s (Gen Z/Alpha) group, representing 50% of guests.
Recommendations for Hosts
- Target domestic marketing efforts towards travelers from Melbourne and Victoria.
- Tailor amenities and listing descriptions to appeal to the dominant Post-2000s (Gen Z/Alpha) demographic (e.g., highlight fast WiFi, smart home features, local guides).
- Highlight unique local experiences or amenities relevant to the primary guest profile.
- Consider seasonal promotions aligned with peak travel times for key origin markets.
Nearby Short-Term Rental Market Comparison
How does the Mulwala Airbnb market stack up against its neighbors? Compare key performance metrics like average monthly revenue, ADR, and occupancy rates in surrounding areas to understand the broader regional STR landscape.
| Market | Active Properties | Monthly Revenue | Daily Rate | Avg. Occupancy |
|---|---|---|---|---|
| Bright | 474 | $3,468 | $294.34 | 42% |
| Porepunkah | 40 | $3,397 | $328.54 | 37% |
| Nagambie | 33 | $3,381 | $300.42 | 40% |
| Shire of Strathbogie | 43 | $3,173 | $314.72 | 37% |
| Wandiligong | 20 | $3,137 | $271.80 | 41% |
| Beechworth | 110 | $3,056 | $251.89 | 41% |
| Yarrawonga | 116 | $2,936 | $402.19 | 30% |
| Whitfield | 14 | $2,793 | $202.11 | 54% |
| City of Greater Shepparton | 12 | $2,691 | $204.81 | 38% |
| Alpine Shire | 79 | $2,676 | $279.88 | 38% |