Moss Vale Airbnb Market Analysis 2025: Short Term Rental Data & Vacation Rental Statistics in New South Wales, Australia
Is Airbnb profitable in Moss Vale in 2025? Explore comprehensive Airbnb analytics for Moss Vale, New South Wales, Australia to uncover income potential. This 2025 STR market report for Moss Vale, based on AirROI data from April 2024 to March 2025, reveals key trends in the niche market of 76 active listings.
Whether you're considering an Airbnb investment in Moss Vale, optimizing your existing vacation rental, or exploring rental arbitrage opportunities, understanding the Moss Vale Airbnb data is crucial. Navigating the high regulation landscape is key to maximizing your short term rental income potential. Let's dive into the specifics.
Key Moss Vale Airbnb Performance Metrics Overview
Monthly Airbnb Revenue Variations & Income Potential in Moss Vale (2025)
Understanding the monthly revenue variations for Airbnb listings in Moss Vale is key to maximizing your short term rental income potential. Seasonality significantly impacts earnings. Our analysis, based on data from the past 12 months, shows that the peak revenue month for STRs in Moss Vale is typically June, while February often presents the lowest earnings, highlighting opportunities for strategic pricing adjustments during shoulder and low seasons. Explore the typical Airbnb income in Moss Vale across different performance tiers:
- Best-in-class properties (Top 10%) achieve $8,591+ monthly, often utilizing dynamic pricing and superior guest experiences.
- Strong performing properties (Top 25%) earn $5,442 or more, indicating effective management and desirable locations/amenities.
- Typical properties (Median) generate around $3,009 per month, representing the average market performance.
- Entry-level properties (Bottom 25%) see earnings around $1,580, often with potential for optimization.
Average Monthly Airbnb Earnings Trend in Moss Vale
Moss Vale Airbnb Occupancy Rate Trends (2025)
Maximize your bookings by understanding the Moss Vale STR occupancy trends. Seasonal demand shifts significantly influence how often properties are booked. Typically, Julysees the highest demand (peak season occupancy), while February experiences the lowest (low season). Effective strategies, like adjusting minimum stays or offering promotions, can boost occupancy during slower periods. Here's how different property tiers perform in Moss Vale:
- Best-in-class properties (Top 10%) achieve 78%+ occupancy, indicating high desirability and potentially optimized availability.
- Strong performing properties (Top 25%) maintain 63% or higher occupancy, suggesting good market fit and guest satisfaction.
- Typical properties (Median) have an occupancy rate around 38%.
- Entry-level properties (Bottom 25%) average 22% occupancy, potentially facing higher vacancy.
Average Monthly Occupancy Rate Trend in Moss Vale
Average Daily Rate (ADR) Airbnb Trends in Moss Vale (2025)
Effective short term rental pricing strategy in Moss Vale involves understanding monthly ADR fluctuations. The Average Daily Rate (ADR) for Airbnb in Moss Vale typically peaks in December and dips lowest during August. Leveraging Airbnb dynamic pricing tools or strategies based on this seasonality can significantly boost revenue. Here's a look at the typical nightly rates achieved:
- Best-in-class properties (Top 10%) command rates of $581+ per night, often due to premium features or locations.
- Strong performing properties (Top 25%) achieve nightly rates of $365 or more.
- Typical properties (Median) charge around $227 per night.
- Entry-level properties (Bottom 25%) earn around $143 per night.
Average Daily Rate (ADR) Trend by Month in Moss Vale
Get Live Moss Vale Market Intelligence 👇
Explore Real-time Analytics
Airbnb Seasonality Analysis & Trends in Moss Vale (2025)
Peak Season (June, May, April)
- Revenue averages $5,464 per month
- Occupancy rates average 45.6%
- Daily rates average $291
Shoulder Season
- Revenue averages $4,161 per month
- Occupancy maintains around 43.5%
- Daily rates hold near $307
Low Season (February, March, September)
- Revenue drops to average $3,345 per month
- Occupancy decreases to average 37.7%
- Daily rates adjust to average $314
Seasonality Insights for Moss Vale
- The Airbnb seasonality in Moss Vale shows moderate seasonality with distinct peak and low periods. While the sections above show seasonal averages, it's also insightful to look at the extremes:
- During the high season, the absolute peak month showcases Moss Vale's highest earning potential, with monthly revenues capable of climbing to $5,725, occupancy reaching a high of 48.2%, and ADRs peaking at $331.
- Conversely, the slowest single month of the year, typically falling within the low season, marks the market's lowest point. In this month, revenue might dip to $2,949, occupancy could drop to 33.5%, and ADRs may adjust down to $283.
- Understanding both the seasonal averages and these monthly peaks and troughs in revenue, occupancy, and ADR is crucial for maximizing your Airbnb profit potential in Moss Vale.
Seasonal Strategies for Maximizing Profit
- Peak Season: Maximize revenue through premium pricing and potentially longer minimum stays. Ensure high availability.
- Low Season: Offer competitive pricing, special promotions (e.g., extended stay discounts), and flexible cancellation policies. Target off-season travelers like remote workers or budget-conscious guests.
- Shoulder Seasons: Implement dynamic pricing that balances peak and low rates. Target weekend travelers or specific events. Offer slightly more flexible terms than peak season.
- Regularly analyze your own performance against these Moss Vale seasonality benchmarks and adjust your pricing and availability strategy accordingly.
Best Areas for Airbnb Investment in Moss Vale (2025)
Exploring the top neighborhoods for short-term rentals in Moss Vale? This section highlights key areas, outlining why they are attractive for hosts and guests, along with notable local attractions. Consider these locations based on your target guest profile and investment strategy.
| Neighborhood / Area | Why Host Here? (Target Guests & Appeal) | Key Attractions & Landmarks |
|---|---|---|
| Moss Vale CBD | The central business district of Moss Vale offers proximity to shops, cafes, and restaurants, making it ideal for visitors who want easy access to amenities and attractions. | Moss Vale Market, Moss Vale Train Station, The Bradman Museum, Moss Vale Golf Club, Local cafes and shops |
| Berrima | A historic village close to Moss Vale, Berrima features charming colonial architecture and attracts tourists interested in history and culture. It has great potential for unique stays. | Berrima Courthouse, Berrima Tea Rooms, Berrima District Museum, Local wineries, Scenic viewing spots |
| Bundanoon | A picturesque town known for its natural beauty, Bundanoon is popular for hiking and outdoor activities. Ideal for nature lovers and those looking for a tranquil escape. | Bundanoon Heritage Walk, Gloucester Trees, Fairy Bower Falls, Mason Park, Local art galleries |
| Kangaloon | A rural area with stunning landscapes and gardens, Kangaloon offers a peaceful retreat for travelers looking to experience the Southern Highlands' natural attractions. | Kangaloon Gardens, Local farms, Scenic views of the countryside, Hiking trails, Picnic spots |
| Sutton Forest | Known for its upscale residences and beautiful countryside, Sutton Forest attracts visitors looking for luxury and tranquility in a rural setting. | Sutton Forest Estate and vineyards, Local wineries, Scenic drives, Garden tours, Nature walks |
| Fitzroy Falls | Famous for its stunning waterfall and natural beauty, Fitzroy Falls is a key attraction for tourists looking for outdoor adventures and breathtaking scenery. | Fitzroy Falls Visitor Centre, Walking trails, Lookout points, Nature reserves |
| Tallong | A quaint village set against beautiful landscapes, Tallong is ideal for rural retreats and attracts guests looking for peace and quiet in nature. | Tallong Park, Scenic bushwalking, Birdwatching, Picnic areas, Nature conservation areas |
| Moss Vale North | This area offers a semi-rural lifestyle with a blend of urban and countryside living. It's attractive for guests seeking a relaxing atmosphere with easy access to Moss Vale. | Local parks, Gardens, Walking pathways, Community events, Nearby wineries |
Understanding Airbnb License Requirements & STR Laws in Moss Vale (2025)
Yes, Moss Vale, New South Wales, Australia enforces high STR regulations. Obtaining a license and ensuring compliance is almost certainly required according to current 2025 STR laws. Always verify the latest short term rental regulations and Airbnb license requirements directly with local government authorities for Moss Vale to ensure full compliance before hosting.
(Source: AirROI data, 2025, based on 88% licensed listings)
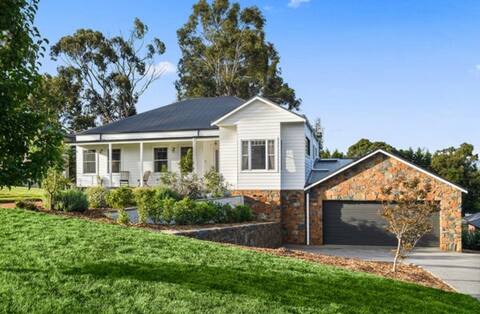
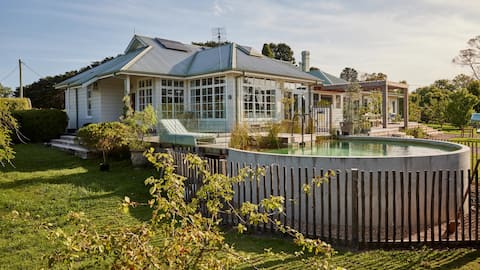
Top Performing Airbnb Properties in Moss Vale (2025)
Benchmark your potential! Explore examples of top-performing Airbnb properties in Moss Valebased on Trailing Twelve Month (TTM) revenue. Analyze their characteristics, revenue, occupancy rate, and ADR to understand what drives success in this market.
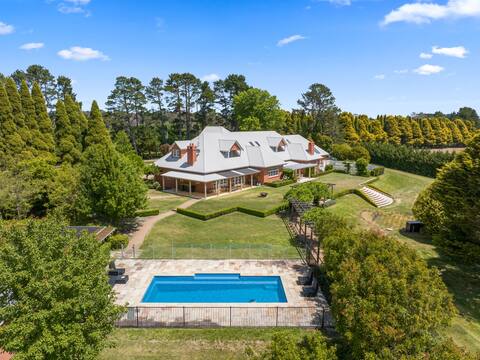
Iona Park, Moss Vale
Entire Place • 8 bedrooms
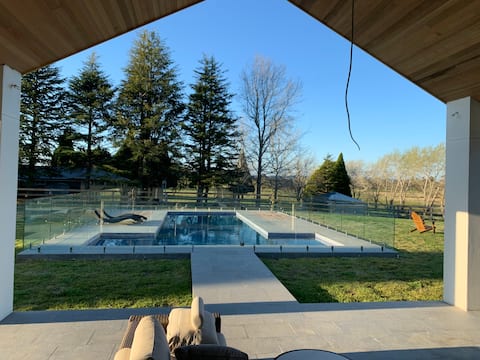
Mainhouse @ The Farm, Mossvale
Entire Place • 6 bedrooms
Group Accommodation - Late check out Sunday
Entire Place • 5 bedrooms
Large, designer home sleeps up to 22
Entire Place • 9 bedrooms
Lavender Haze – serene luxe retreat
Entire Place • 4 bedrooms
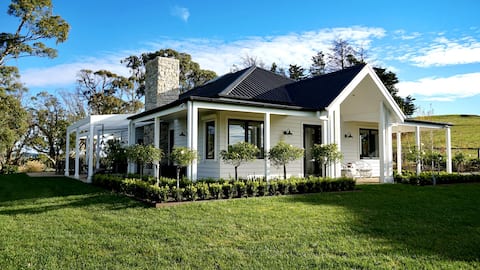
Luxury Country Escape at Colyersdale Cottage
Entire Place • 2 bedrooms
Note: Performance varies based on location, size, amenities, seasonality, and management quality. Data reflects the past 12 months.
Top Performing Airbnb Hosts in Moss Vale (2025)
Learn from the best! This table showcases top-performing Airbnb hosts in Moss Vale based on the number of properties managed and estimated total revenue over the past year. Analyze their scale and performance metrics.
| Host Name | Properties | Grossing Revenue | Stay Reviews | Avg Rating |
|---|---|---|---|---|
| The Holidays Collection | 2 | $437,344 | 31 | 4.71/5.0 |
| Holiday Rental Specialists | 7 | $428,732 | 111 | 4.00/5.0 |
| Alex | 2 | $170,632 | 292 | 4.99/5.0 |
| Fiona | 4 | $154,777 | 155 | 4.84/5.0 |
| Georgia | 3 | $133,765 | 103 | 4.88/5.0 |
| Tara | 2 | $129,078 | 113 | 4.88/5.0 |
| Thomas | 2 | $122,621 | 468 | 4.89/5.0 |
| Host #203933059 | 1 | $115,923 | 26 | 4.96/5.0 |
| Alison | 1 | $91,328 | 33 | 4.97/5.0 |
| Latesha | 1 | $73,387 | 34 | 4.94/5.0 |
Analyzing the strategies of top hosts, such as their property selection, pricing, and guest communication, can offer valuable lessons for optimizing your own Airbnb operations in Moss Vale.
Dive Deeper: Advanced Moss Vale STR Market Data (2025)
Ready to unlock more insights? AirROI provides access to advanced metrics and comprehensive Airbnb data for Moss Vale. Explore detailed analytics beyond this report to refine your investment strategy, optimize pricing, and maximize your vacation rental profits.
Explore Advanced MetricsMoss Vale Short-Term Rental Market Composition (2025): Property & Room Types
Room Type Distribution
Property Type Distribution
Market Composition Insights for Moss Vale
- The Moss Vale Airbnb market composition is heavily skewed towards Entire Home/Apt listings, which make up 94.7% of the 76 active rentals. This indicates strong guest preference for privacy and space.
- Looking at the property type distribution in Moss Vale, House properties are the most common (69.7%), reflecting the local real estate landscape.
- Houses represent a significant 69.7% portion, catering likely to families or larger groups.
- The presence of 5.3% Hotel/Boutique listings indicates integration with traditional hospitality.
- Smaller segments like unique stays (combined 2.6%) offer potential for unique stay experiences.
Moss Vale Airbnb Room Capacity Analysis (2025): Bedroom Distribution
Distribution of Listings by Number of Bedrooms
Room Capacity Insights for Moss Vale
- The dominant room capacity in Moss Vale is 1 bedroom listings, making up 27.6% of the market. This suggests a strong demand for properties suitable for couples or solo travelers.
- Together, 1 bedroom and 2 bedrooms properties represent 50.0% of the active Airbnb listings in Moss Vale, indicating a high concentration in these sizes.
- A significant 43.4% of listings offer 3+ bedrooms, catering to larger groups and families seeking more space in Moss Vale.
Moss Vale Vacation Rental Guest Capacity Trends (2025)
Distribution of Listings by Guest Capacity
Guest Capacity Insights for Moss Vale
- The most common guest capacity trend in Moss Vale vacation rentals is listings accommodating 8+ guests (26.3%). This suggests the primary traveler segment is likely larger groups.
- Properties designed for 8+ guests and 2 guests dominate the Moss Vale STR market, accounting for 52.6% of listings.
- 42.1% of properties accommodate 6+ guests, serving the market segment for larger families or group travel in Moss Vale.
- On average, properties in Moss Vale are equipped to host 4.6 guests.
Moss Vale Airbnb Booking Patterns (2025): Available vs. Booked Days
Available Days Distribution
Booked Days Distribution
Booking Pattern Insights for Moss Vale
- The most common availability pattern in Moss Vale falls within the 91-180 days range, representing 34.2% of listings. This suggests many properties have significant open periods on their calendars.
- Approximately 59.2% of listings show high availability (181+ days open annually), indicating potential for increased bookings or specific owner usage patterns.
- For booked days, the 181-270 days range is most frequent in Moss Vale (34.2%), reflecting common guest stay durations or potential owner blocking patterns.
- A notable 40.8% of properties secure long booking periods (181+ days booked per year), highlighting successful long-term rental strategies or significant owner usage.
Moss Vale Airbnb Minimum Stay Requirements Analysis
Distribution of Listings by Minimum Night Requirement
1 Night
16 listings
22.9% of total
2 Nights
32 listings
45.7% of total
3 Nights
2 listings
2.9% of total
4-6 Nights
1 listings
1.4% of total
7-29 Nights
2 listings
2.9% of total
30+ Nights
17 listings
24.3% of total
Key Insights
- The most prevalent minimum stay requirement in Moss Vale is 2 Nights, adopted by 45.7% of listings. This highlights the market's preference for shorter, flexible bookings.
- A strong majority (68.6%) of the Moss Vale Airbnb data shows acceptance of very short stays (1-2 nights), indicating a dynamic, high-turnover market.
- A significant segment (24.3%) caters to monthly stays (30+ nights) in Moss Vale, pointing to opportunities in the extended-stay market.
Recommendations
- Align with the market by considering a 2 Nights minimum stay, as 45.7% of Moss Vale hosts use this setting.
- If feasible, allowing 1-night stays, especially midweek or during low season, could capture last-minute bookings, as only 22.9% currently do.
- Explore offering discounts for stays of 30+ nights to attract the 24.3% of the market seeking extended stays.
- Adjust minimum nights based on seasonality – potentially shorter during low season and longer during peak demand periods in Moss Vale.
Moss Vale Airbnb Cancellation Policy Trends Analysis (2025)
Super Strict 30 Days
5 listings
7.2% of total
Flexible
15 listings
21.7% of total
Moderate
14 listings
20.3% of total
Firm
21 listings
30.4% of total
Strict
14 listings
20.3% of total
Cancellation Policy Insights for Moss Vale
- The prevailing Airbnb cancellation policy trend in Moss Vale is Firm, used by 30.4% of listings.
- A majority (50.7%) of hosts in Moss Vale utilize Firm or Strict policies, indicating a market where hosts prioritize booking security.
Recommendations for Hosts
- Consider adopting a Firm policy to align with the 30.4% market standard in Moss Vale.
- Regularly review your cancellation policy against competitors and market demand shifts in Moss Vale.
Moss Vale STR Booking Lead Time Analysis (2025)
Average Booking Lead Time by Month
Booking Lead Time Insights for Moss Vale
- The overall average booking lead time for vacation rentals in Moss Vale is 57 days.
- Guests book furthest in advance for stays during March (average 76 days), likely coinciding with peak travel demand or local events.
- The shortest booking windows occur for stays in August (average 43 days), indicating more last-minute travel plans during this time.
- Seasonally, Spring (70 days avg.) sees the longest lead times, while Summer (53 days avg.) has the shortest, reflecting typical travel planning cycles.
Recommendations for Hosts
- Use the overall average lead time (57 days) as a baseline for your pricing and availability strategy in Moss Vale.
- For March stays, consider implementing length-of-stay discounts or slightly higher rates for bookings made less than 76 days out to capitalize on advance planning.
- Target marketing efforts for the Spring season well in advance (at least 70 days) to capture early planners.
- Monitor your own booking lead times against these Moss Vale averages to identify opportunities for dynamic pricing adjustments.
Popular & Essential Airbnb Amenities in Moss Vale (2025)
Amenity Prevalence
Amenity Insights for Moss Vale
- Essential amenities in Moss Vale that guests expect include: Free parking on premises, Smoke alarm, Hot water. Lacking these (any) could significantly impact bookings.
- Popular amenities like Essentials, Heating, Dishes and silverware are common but not universal. Offering these can provide a competitive edge.
- Warning: Wifi is not universally provided but is considered essential globally. Ensure reliable Wifi is offered.
Recommendations for Hosts
- Ensure your listing includes all essential amenities for Moss Vale: Free parking on premises, Smoke alarm, Hot water.
- Prioritize adding missing essentials: Free parking on premises, Smoke alarm, Hot water.
- Consider adding popular differentiators like Essentials or Heating to increase appeal.
- Highlight unique or less common amenities you offer (e.g., hot tub, dedicated workspace, EV charger) in your listing description and photos.
- Regularly check competitor amenities in Moss Vale to stay competitive.
Moss Vale Airbnb Guest Demographics & Profile Analysis (2025)
Guest Profile Summary for Moss Vale
- The typical guest profile for Airbnb in Moss Vale consists of primarily domestic travelers (94%), often arriving from nearby Sydney, typically belonging to the Post-2000s (Gen Z/Alpha) group (50%), primarily speaking English or Spanish.
- Domestic travelers account for 93.6% of guests.
- Key international markets include Australia (93.6%) and United Kingdom (1.9%).
- Top languages spoken are English (70.5%) followed by Spanish (4.3%).
- A significant demographic segment is the Post-2000s (Gen Z/Alpha) group, representing 50% of guests.
Recommendations for Hosts
- Target domestic marketing efforts towards travelers from Sydney and New South Wales.
- Tailor amenities and listing descriptions to appeal to the dominant Post-2000s (Gen Z/Alpha) demographic (e.g., highlight fast WiFi, smart home features, local guides).
- Highlight unique local experiences or amenities relevant to the primary guest profile.
- Consider seasonal promotions aligned with peak travel times for key origin markets.
Nearby Short-Term Rental Market Comparison
How does the Moss Vale Airbnb market stack up against its neighbors? Compare key performance metrics like average monthly revenue, ADR, and occupancy rates in surrounding areas to understand the broader regional STR landscape.
| Market | Active Properties | Monthly Revenue | Daily Rate | Avg. Occupancy |
|---|---|---|---|---|
| Penrose | 12 | $6,349 | $600.00 | 42% |
| Berry | 115 | $6,185 | $540.04 | 41% |
| Jaspers Brush | 13 | $5,600 | $510.06 | 37% |
| Burrawang | 11 | $5,005 | $523.75 | 43% |
| Berrima | 44 | $4,756 | $426.34 | 42% |
| Braidwood | 20 | $4,708 | $443.62 | 40% |
| Robertson | 44 | $4,655 | $375.71 | 40% |
| Dora Creek | 17 | $4,613 | $370.02 | 45% |
| Bombo | 10 | $4,613 | $503.00 | 39% |
| Exeter | 30 | $4,595 | $519.08 | 38% |