Minnamurra Airbnb Market Analysis 2025: Short Term Rental Data & Vacation Rental Statistics in New South Wales, Australia
Is Airbnb profitable in Minnamurra in 2025? Explore comprehensive Airbnb analytics for Minnamurra, New South Wales, Australia to uncover income potential. This 2025 STR market report for Minnamurra, based on AirROI data from April 2024 to March 2025, reveals key trends in the niche market of 20 active listings.
Whether you're considering an Airbnb investment in Minnamurra, optimizing your existing vacation rental, or exploring rental arbitrage opportunities, understanding the Minnamurra Airbnb data is crucial. Navigating the high regulation landscape is key to maximizing your short term rental income potential. Let's dive into the specifics.
Key Minnamurra Airbnb Performance Metrics Overview
Monthly Airbnb Revenue Variations & Income Potential in Minnamurra (2025)
Understanding the monthly revenue variations for Airbnb listings in Minnamurra is key to maximizing your short term rental income potential. Seasonality significantly impacts earnings. Our analysis, based on data from the past 12 months, shows that the peak revenue month for STRs in Minnamurra is typically January, while July often presents the lowest earnings, highlighting opportunities for strategic pricing adjustments during shoulder and low seasons. Explore the typical Airbnb income in Minnamurra across different performance tiers:
- Best-in-class properties (Top 10%) achieve $10,088+ monthly, often utilizing dynamic pricing and superior guest experiences.
- Strong performing properties (Top 25%) earn $5,541 or more, indicating effective management and desirable locations/amenities.
- Typical properties (Median) generate around $3,262 per month, representing the average market performance.
- Entry-level properties (Bottom 25%) see earnings around $1,682, often with potential for optimization.
Average Monthly Airbnb Earnings Trend in Minnamurra
Minnamurra Airbnb Occupancy Rate Trends (2025)
Maximize your bookings by understanding the Minnamurra STR occupancy trends. Seasonal demand shifts significantly influence how often properties are booked. Typically, Januarysees the highest demand (peak season occupancy), while July experiences the lowest (low season). Effective strategies, like adjusting minimum stays or offering promotions, can boost occupancy during slower periods. Here's how different property tiers perform in Minnamurra:
- Best-in-class properties (Top 10%) achieve 62%+ occupancy, indicating high desirability and potentially optimized availability.
- Strong performing properties (Top 25%) maintain 44% or higher occupancy, suggesting good market fit and guest satisfaction.
- Typical properties (Median) have an occupancy rate around 27%.
- Entry-level properties (Bottom 25%) average 18% occupancy, potentially facing higher vacancy.
Average Monthly Occupancy Rate Trend in Minnamurra
Average Daily Rate (ADR) Airbnb Trends in Minnamurra (2025)
Effective short term rental pricing strategy in Minnamurra involves understanding monthly ADR fluctuations. The Average Daily Rate (ADR) for Airbnb in Minnamurra typically peaks in December and dips lowest during August. Leveraging Airbnb dynamic pricing tools or strategies based on this seasonality can significantly boost revenue. Here's a look at the typical nightly rates achieved:
- Best-in-class properties (Top 10%) command rates of $770+ per night, often due to premium features or locations.
- Strong performing properties (Top 25%) achieve nightly rates of $499 or more.
- Typical properties (Median) charge around $307 per night.
- Entry-level properties (Bottom 25%) earn around $190 per night.
Average Daily Rate (ADR) Trend by Month in Minnamurra
Get Live Minnamurra Market Intelligence 👇

Explore Real-time Analytics
Airbnb Seasonality Analysis & Trends in Minnamurra (2025)
Peak Season (January, December, September)
- Revenue averages $6,147 per month
- Occupancy rates average 47.9%
- Daily rates average $425
Shoulder Season
- Revenue averages $4,607 per month
- Occupancy maintains around 32.1%
- Daily rates hold near $374
Low Season (February, July, August)
- Revenue drops to average $2,012 per month
- Occupancy decreases to average 19.4%
- Daily rates adjust to average $367
Seasonality Insights for Minnamurra
- The Airbnb seasonality in Minnamurra shows highly seasonal trends requiring careful strategy. While the sections above show seasonal averages, it's also insightful to look at the extremes:
- During the high season, the absolute peak month showcases Minnamurra's highest earning potential, with monthly revenues capable of climbing to $6,422, occupancy reaching a high of 53.6%, and ADRs peaking at $493.
- Conversely, the slowest single month of the year, typically falling within the low season, marks the market's lowest point. In this month, revenue might dip to $1,803, occupancy could drop to 16.4%, and ADRs may adjust down to $317.
- Understanding both the seasonal averages and these monthly peaks and troughs in revenue, occupancy, and ADR is crucial for maximizing your Airbnb profit potential in Minnamurra.
Seasonal Strategies for Maximizing Profit
- Peak Season: Maximize revenue through premium pricing and potentially longer minimum stays. Ensure high availability.
- Low Season: Offer competitive pricing, special promotions (e.g., extended stay discounts), and flexible cancellation policies. Target off-season travelers like remote workers or budget-conscious guests.
- Shoulder Seasons: Implement dynamic pricing that balances peak and low rates. Target weekend travelers or specific events. Offer slightly more flexible terms than peak season.
- Regularly analyze your own performance against these Minnamurra seasonality benchmarks and adjust your pricing and availability strategy accordingly.
Best Areas for Airbnb Investment in Minnamurra (2025)
Exploring the top neighborhoods for short-term rentals in Minnamurra? This section highlights key areas, outlining why they are attractive for hosts and guests, along with notable local attractions. Consider these locations based on your target guest profile and investment strategy.
| Neighborhood / Area | Why Host Here? (Target Guests & Appeal) | Key Attractions & Landmarks |
|---|---|---|
| Minamurra Beach | A serene coastal area known for its beautiful beaches and relaxing atmosphere. Ideal for holiday-makers who enjoy the ocean and nature, providing a peaceful retreat away from the hustle and bustle. | Minamurra Beach, Killalea State Park, Surfing at Mystics Beach, Fishing at the Minnamurra River, Jamberoo Action Park |
| Minnamurra Rainforest | Part of the Budderoo National Park, this area offers stunning rainforest walks and diverse wildlife. Attractive to eco-tourists and outdoor enthusiasts looking to explore natural beauty. | Minnamurra Rainforest Centre, Rainforest walks, Birdwatching, Guided tours, Picnic areas |
| Kiama | A charming coastal town known for its blowhole and stunning coastal views. Popular with tourists for its picturesque scenery, ideal for short stays. | Kiama Blowhole, Kiama Harbour, Bombo Headland Walk, Kiama Lighthouse, Grand Final Hill |
| Jamberoo | A small village nearby that offers a rural experience with access to Jamberoo Action Park and scenic views. Great for family-friendly accommodations. | Jamberoo Action Park, Dairy Farmers Hill, Bushwalking trails, Historical sites, Local markets |
| Gerringong | A coastal town with beautiful beaches and a laid-back vibe, attracting surfers and nature lovers alike. Offers great investment potential due to its growing popularity. | Werri Beach, Gerringong Historic Museum, Seven Mile Beach, Surfing and swimming spots |
| Berry | A historic town known for its boutique shops and local produce. Ideal for visitors looking for a unique shopping and dining experience. | Berry's historic village, Berry Farmers Market, Restaurants and cafes, Local art galleries |
| Shellharbour | A rapidly growing area with modern amenities and beautiful beaches, appealing to families and young professionals. A good option for year-round rentals. | Shellharbour Beach, Stockland Shellharbour, Cafes and restaurants, Lake Illawarra |
| Albion Park | A township that combines rural and urban living, providing easy access to nature and city amenities. Attractive for families and long-term renters. | Albion Park Rail Heritage, Local parks, Sporting facilities, Markets, Nearby vineyards |
Understanding Airbnb License Requirements & STR Laws in Minnamurra (2025)
Yes, Minnamurra, New South Wales, Australia enforces high STR regulations. Obtaining a license and ensuring compliance is almost certainly required according to current 2025 STR laws. Always verify the latest short term rental regulations and Airbnb license requirements directly with local government authorities for Minnamurra to ensure full compliance before hosting.
(Source: AirROI data, 2025, based on 90% licensed listings)
Top Performing Airbnb Properties in Minnamurra (2025)
Benchmark your potential! Explore examples of top-performing Airbnb properties in Minnamurrabased on Trailing Twelve Month (TTM) revenue. Analyze their characteristics, revenue, occupancy rate, and ADR to understand what drives success in this market.
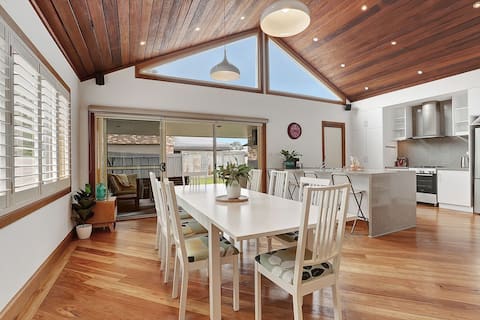
Minnamurra Retreat 2
Entire Place • 4 bedrooms
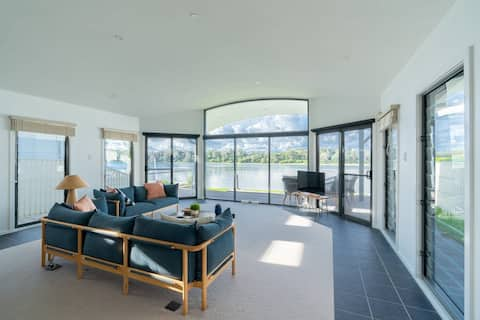
Absolute waterfront beach house
Entire Place • 5 bedrooms

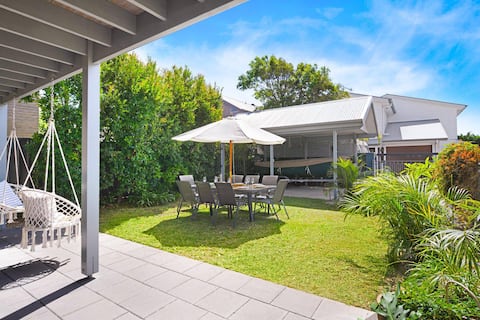
Tranquil Retreat
Entire Place • 4 bedrooms
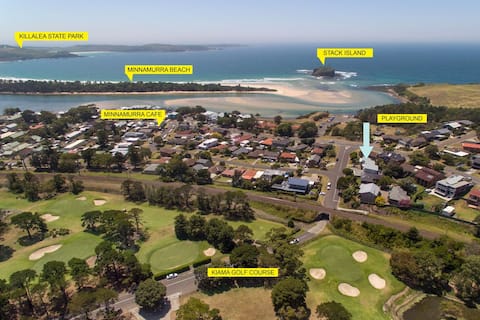
Rangoon Sunrise @ Minnamurra
Entire Place • 4 bedrooms
Minnamurra Beach Bliss, Minnamurra
Entire Place • 3 bedrooms
Aroona at Minnamurra
Entire Place • 2 bedrooms
Note: Performance varies based on location, size, amenities, seasonality, and management quality. Data reflects the past 12 months.
Top Performing Airbnb Hosts in Minnamurra (2025)
Learn from the best! This table showcases top-performing Airbnb hosts in Minnamurra based on the number of properties managed and estimated total revenue over the past year. Analyze their scale and performance metrics.
| Host Name | Properties | Grossing Revenue | Stay Reviews | Avg Rating |
|---|---|---|---|---|
| South Coast Holidays | 6 | $307,796 | 57 | 3.93/5.0 |
| Holiday Rental Specialists | 3 | $120,353 | 54 | 4.69/5.0 |
| The Holidays Collection | 2 | $73,091 | 40 | 2.46/5.0 |
| Coast And Country Holidays | 1 | $49,120 | 37 | 4.89/5.0 |
| Meg And Tim | 1 | $44,044 | 31 | 4.90/5.0 |
| Kerrie | 3 | $43,280 | 119 | 5.00/5.0 |
| Lori | 1 | $42,937 | 174 | 5.00/5.0 |
| Trish | 1 | $18,046 | 109 | 4.99/5.0 |
| Virginia | 1 | $17,248 | 44 | 4.93/5.0 |
| Charlie | 1 | $9,361 | 32 | 4.88/5.0 |
Analyzing the strategies of top hosts, such as their property selection, pricing, and guest communication, can offer valuable lessons for optimizing your own Airbnb operations in Minnamurra.
Dive Deeper: Advanced Minnamurra STR Market Data (2025)
Ready to unlock more insights? AirROI provides access to advanced metrics and comprehensive Airbnb data for Minnamurra. Explore detailed analytics beyond this report to refine your investment strategy, optimize pricing, and maximize your vacation rental profits.
Explore Advanced MetricsMinnamurra Short-Term Rental Market Composition (2025): Property & Room Types
Room Type Distribution
Property Type Distribution
Market Composition Insights for Minnamurra
- The Minnamurra Airbnb market composition is heavily skewed towards Entire Home/Apt listings, which make up 100% of the 20 active rentals. This indicates strong guest preference for privacy and space.
- Looking at the property type distribution in Minnamurra, House properties are the most common (75%), reflecting the local real estate landscape.
- Houses represent a significant 75% portion, catering likely to families or larger groups.
- The presence of 10% Hotel/Boutique listings indicates integration with traditional hospitality.
Minnamurra Airbnb Room Capacity Analysis (2025): Bedroom Distribution
Distribution of Listings by Number of Bedrooms
Room Capacity Insights for Minnamurra
- The dominant room capacity in Minnamurra is 4 bedrooms listings, making up 35% of the market. This suggests a strong demand for properties suitable for families or small groups.
- Together, 4 bedrooms and 1 bedroom properties represent 55.0% of the active Airbnb listings in Minnamurra, indicating a high concentration in these sizes.
- A significant 55.0% of listings offer 3+ bedrooms, catering to larger groups and families seeking more space in Minnamurra.
Minnamurra Vacation Rental Guest Capacity Trends (2025)
Distribution of Listings by Guest Capacity
Guest Capacity Insights for Minnamurra
- The most common guest capacity trend in Minnamurra vacation rentals is listings accommodating 8+ guests (40%). This suggests the primary traveler segment is likely larger groups.
- Properties designed for 8+ guests and 4 guests dominate the Minnamurra STR market, accounting for 65.0% of listings.
- 55.0% of properties accommodate 6+ guests, serving the market segment for larger families or group travel in Minnamurra.
- On average, properties in Minnamurra are equipped to host 5.5 guests.
Minnamurra Airbnb Booking Patterns (2025): Available vs. Booked Days
Available Days Distribution
Booked Days Distribution
Booking Pattern Insights for Minnamurra
- The most common availability pattern in Minnamurra falls within the 271-366 days range, representing 55% of listings. This suggests many properties have significant open periods on their calendars.
- Approximately 90.0% of listings show high availability (181+ days open annually), indicating potential for increased bookings or specific owner usage patterns.
- For booked days, the 31-90 days range is most frequent in Minnamurra (45%), reflecting common guest stay durations or potential owner blocking patterns.
- A notable 10.0% of properties secure long booking periods (181+ days booked per year), highlighting successful long-term rental strategies or significant owner usage.
Minnamurra Airbnb Minimum Stay Requirements Analysis
Distribution of Listings by Minimum Night Requirement
2 Nights
9 listings
45% of total
3 Nights
1 listings
5% of total
4-6 Nights
2 listings
10% of total
30+ Nights
8 listings
40% of total
Key Insights
- The most prevalent minimum stay requirement in Minnamurra is 2 Nights, adopted by 45% of listings. This highlights the market's preference for shorter, flexible bookings.
- A significant segment (40%) caters to monthly stays (30+ nights) in Minnamurra, pointing to opportunities in the extended-stay market.
Recommendations
- Align with the market by considering a 2 Nights minimum stay, as 45% of Minnamurra hosts use this setting.
- A 2-night minimum appears standard (45%). Consider this for weekends or peak periods.
- Explore offering discounts for stays of 30+ nights to attract the 40% of the market seeking extended stays.
- Adjust minimum nights based on seasonality – potentially shorter during low season and longer during peak demand periods in Minnamurra.
Minnamurra Airbnb Cancellation Policy Trends Analysis (2025)
Super Strict 30 Days
3 listings
16.7% of total
Super Strict 60 Days
1 listings
5.6% of total
Flexible
3 listings
16.7% of total
Moderate
1 listings
5.6% of total
Firm
6 listings
33.3% of total
Strict
4 listings
22.2% of total
Cancellation Policy Insights for Minnamurra
- The prevailing Airbnb cancellation policy trend in Minnamurra is Firm, used by 33.3% of listings.
- A majority (55.5%) of hosts in Minnamurra utilize Firm or Strict policies, indicating a market where hosts prioritize booking security.
Recommendations for Hosts
- Consider adopting a Firm policy to align with the 33.3% market standard in Minnamurra.
- Regularly review your cancellation policy against competitors and market demand shifts in Minnamurra.
Minnamurra STR Booking Lead Time Analysis (2025)
Average Booking Lead Time by Month
Booking Lead Time Insights for Minnamurra
- The overall average booking lead time for vacation rentals in Minnamurra is 52 days.
- Guests book furthest in advance for stays during October (average 101 days), likely coinciding with peak travel demand or local events.
- The shortest booking windows occur for stays in February (average 24 days), indicating more last-minute travel plans during this time.
- Seasonally, Fall (82 days avg.) sees the longest lead times, while Summer (49 days avg.) has the shortest, reflecting typical travel planning cycles.
Recommendations for Hosts
- Use the overall average lead time (52 days) as a baseline for your pricing and availability strategy in Minnamurra.
- For October stays, consider implementing length-of-stay discounts or slightly higher rates for bookings made less than 101 days out to capitalize on advance planning.
- Target marketing efforts for the Fall season well in advance (at least 82 days) to capture early planners.
- Monitor your own booking lead times against these Minnamurra averages to identify opportunities for dynamic pricing adjustments.
Popular & Essential Airbnb Amenities in Minnamurra (2025)
Amenity Prevalence
Amenity Insights for Minnamurra
- Essential amenities in Minnamurra that guests expect include: Kitchen, Smoke alarm, Free parking on premises, Washer, TV, Wifi. Lacking these (any) could significantly impact bookings.
- Popular amenities like Hot water, Bed linens, Microwave are common but not universal. Offering these can provide a competitive edge.
Recommendations for Hosts
- Ensure your listing includes all essential amenities for Minnamurra: Kitchen, Smoke alarm, Free parking on premises, Washer, TV, Wifi.
- Prioritize adding missing essentials: Washer, TV, Wifi.
- Consider adding popular differentiators like Hot water or Bed linens to increase appeal.
- Highlight unique or less common amenities you offer (e.g., hot tub, dedicated workspace, EV charger) in your listing description and photos.
- Regularly check competitor amenities in Minnamurra to stay competitive.
Minnamurra Airbnb Guest Demographics & Profile Analysis (2025)
Guest Profile Summary for Minnamurra
- The typical guest profile for Airbnb in Minnamurra consists of primarily domestic travelers (90%), often arriving from nearby Sydney, typically belonging to the Post-2000s (Gen Z/Alpha) group (50%), primarily speaking English or Chinese.
- Domestic travelers account for 90.0% of guests.
- Key international markets include Australia (90%) and United States (3.3%).
- Top languages spoken are English (76.7%) followed by Chinese (10%).
- A significant demographic segment is the Post-2000s (Gen Z/Alpha) group, representing 50% of guests.
Recommendations for Hosts
- Target domestic marketing efforts towards travelers from Sydney and New South Wales.
- Tailor amenities and listing descriptions to appeal to the dominant Post-2000s (Gen Z/Alpha) demographic (e.g., highlight fast WiFi, smart home features, local guides).
- Highlight unique local experiences or amenities relevant to the primary guest profile.
- Consider seasonal promotions aligned with peak travel times for key origin markets.
Nearby Short-Term Rental Market Comparison
How does the Minnamurra Airbnb market stack up against its neighbors? Compare key performance metrics like average monthly revenue, ADR, and occupancy rates in surrounding areas to understand the broader regional STR landscape.
| Market | Active Properties | Monthly Revenue | Daily Rate | Avg. Occupancy |
|---|---|---|---|---|
| Penrose | 12 | $6,349 | $600.00 | 42% |
| Berry | 115 | $6,185 | $540.04 | 41% |
| Jaspers Brush | 13 | $5,600 | $510.06 | 37% |
| Burrawang | 11 | $5,005 | $523.75 | 43% |
| Berrima | 44 | $4,756 | $426.34 | 42% |
| Braidwood | 20 | $4,708 | $443.62 | 40% |
| Robertson | 44 | $4,655 | $375.71 | 40% |
| Dora Creek | 17 | $4,613 | $370.02 | 45% |
| Bombo | 10 | $4,613 | $503.00 | 39% |
| Exeter | 30 | $4,595 | $519.08 | 38% |