Lake Macquarie City Council Airbnb Market Analysis 2025: Short Term Rental Data & Vacation Rental Statistics in New South Wales, Australia
Is Airbnb profitable in Lake Macquarie City Council in 2025? Explore comprehensive Airbnb analytics for Lake Macquarie City Council, New South Wales, Australia to uncover income potential. This 2025 STR market report for Lake Macquarie City Council, based on AirROI data from April 2024 to March 2025, reveals key trends in the niche market of 189 active listings.
Whether you're considering an Airbnb investment in Lake Macquarie City Council, optimizing your existing vacation rental, or exploring rental arbitrage opportunities, understanding the Lake Macquarie City Council Airbnb data is crucial. Navigating the high regulation landscape is key to maximizing your short term rental income potential. Let's dive into the specifics.
Key Lake Macquarie City Council Airbnb Performance Metrics Overview
Monthly Airbnb Revenue Variations & Income Potential in Lake Macquarie City Council (2025)
Understanding the monthly revenue variations for Airbnb listings in Lake Macquarie City Council is key to maximizing your short term rental income potential. Seasonality significantly impacts earnings. Our analysis, based on data from the past 12 months, shows that the peak revenue month for STRs in Lake Macquarie City Council is typically January, while August often presents the lowest earnings, highlighting opportunities for strategic pricing adjustments during shoulder and low seasons. Explore the typical Airbnb income in Lake Macquarie City Council across different performance tiers:
- Best-in-class properties (Top 10%) achieve $8,749+ monthly, often utilizing dynamic pricing and superior guest experiences.
- Strong performing properties (Top 25%) earn $5,135 or more, indicating effective management and desirable locations/amenities.
- Typical properties (Median) generate around $2,669 per month, representing the average market performance.
- Entry-level properties (Bottom 25%) see earnings around $1,363, often with potential for optimization.
Average Monthly Airbnb Earnings Trend in Lake Macquarie City Council
Lake Macquarie City Council Airbnb Occupancy Rate Trends (2025)
Maximize your bookings by understanding the Lake Macquarie City Council STR occupancy trends. Seasonal demand shifts significantly influence how often properties are booked. Typically, Januarysees the highest demand (peak season occupancy), while June experiences the lowest (low season). Effective strategies, like adjusting minimum stays or offering promotions, can boost occupancy during slower periods. Here's how different property tiers perform in Lake Macquarie City Council:
- Best-in-class properties (Top 10%) achieve 76%+ occupancy, indicating high desirability and potentially optimized availability.
- Strong performing properties (Top 25%) maintain 55% or higher occupancy, suggesting good market fit and guest satisfaction.
- Typical properties (Median) have an occupancy rate around 33%.
- Entry-level properties (Bottom 25%) average 17% occupancy, potentially facing higher vacancy.
Average Monthly Occupancy Rate Trend in Lake Macquarie City Council
Average Daily Rate (ADR) Airbnb Trends in Lake Macquarie City Council (2025)
Effective short term rental pricing strategy in Lake Macquarie City Council involves understanding monthly ADR fluctuations. The Average Daily Rate (ADR) for Airbnb in Lake Macquarie City Council typically peaks in January and dips lowest during August. Leveraging Airbnb dynamic pricing tools or strategies based on this seasonality can significantly boost revenue. Here's a look at the typical nightly rates achieved:
- Best-in-class properties (Top 10%) command rates of $593+ per night, often due to premium features or locations.
- Strong performing properties (Top 25%) achieve nightly rates of $395 or more.
- Typical properties (Median) charge around $262 per night.
- Entry-level properties (Bottom 25%) earn around $176 per night.
Average Daily Rate (ADR) Trend by Month in Lake Macquarie City Council
Get Live Lake Macquarie City Council Market Intelligence 👇

Explore Real-time Analytics
Airbnb Seasonality Analysis & Trends in Lake Macquarie City Council (2025)
Peak Season (January, December, April)
- Revenue averages $5,578 per month
- Occupancy rates average 46.8%
- Daily rates average $371
Shoulder Season
- Revenue averages $3,902 per month
- Occupancy maintains around 35.4%
- Daily rates hold near $320
Low Season (February, March, August)
- Revenue drops to average $2,984 per month
- Occupancy decreases to average 32.8%
- Daily rates adjust to average $321
Seasonality Insights for Lake Macquarie City Council
- The Airbnb seasonality in Lake Macquarie City Council shows highly seasonal trends requiring careful strategy. While the sections above show seasonal averages, it's also insightful to look at the extremes:
- During the high season, the absolute peak month showcases Lake Macquarie City Council's highest earning potential, with monthly revenues capable of climbing to $6,541, occupancy reaching a high of 53.4%, and ADRs peaking at $401.
- Conversely, the slowest single month of the year, typically falling within the low season, marks the market's lowest point. In this month, revenue might dip to $2,882, occupancy could drop to 28.3%, and ADRs may adjust down to $308.
- Understanding both the seasonal averages and these monthly peaks and troughs in revenue, occupancy, and ADR is crucial for maximizing your Airbnb profit potential in Lake Macquarie City Council.
Seasonal Strategies for Maximizing Profit
- Peak Season: Maximize revenue through premium pricing and potentially longer minimum stays. Ensure high availability.
- Low Season: Offer competitive pricing, special promotions (e.g., extended stay discounts), and flexible cancellation policies. Target off-season travelers like remote workers or budget-conscious guests.
- Shoulder Seasons: Implement dynamic pricing that balances peak and low rates. Target weekend travelers or specific events. Offer slightly more flexible terms than peak season.
- Regularly analyze your own performance against these Lake Macquarie City Council seasonality benchmarks and adjust your pricing and availability strategy accordingly.
Best Areas for Airbnb Investment in Lake Macquarie City Council (2025)
Exploring the top neighborhoods for short-term rentals in Lake Macquarie City Council? This section highlights key areas, outlining why they are attractive for hosts and guests, along with notable local attractions. Consider these locations based on your target guest profile and investment strategy.
| Neighborhood / Area | Why Host Here? (Target Guests & Appeal) | Key Attractions & Landmarks |
|---|---|---|
| Caves Beach | Popular beach destination known for its scenic coastline and surf culture. Ideal for tourists looking for beach activities, relaxation, and coastal walks. | Caves Beach, Naru Beach, Sandy Beach, Waves on Caves, local cafes and restaurants |
| Toronto | Charming lakeside town offering a relaxed atmosphere and beautiful waterfront views. Great for families and those seeking a quieter stay close to nature. | Lake Macquarie, Toronto Foreshore, local markets, Toronto Shopping Centre |
| Swansea | Gateway to the beautiful southern shores of Lake Macquarie, with access to both the lake and the ocean. Attracts visitors for its fishing, boating, and beach access. | Swansea Channel, Blacksmiths Beach, Swansea Park, Cafes along the waterfront |
| Dora Creek | Serene rural community by the lake, popular for nature lovers and those wanting a peaceful retreat. Close to walking trails and wildlife opportunities. | Dora Creek, Dora Creek Reserve, walking and cycling trails, local wineries |
| Wangi Wangi | Scenic suburb on the western side of Lake Macquarie known for its water views and tranquil setting. Perfect for those who enjoy fishing, boating, and nature walks. | Wangi Wangi Jetty, local parks, water sports, Wangi Wangi Music Festival |
| Belmont | Vibrant suburb with a bustling community and waterfront access. Offers a mix of relaxation and recreational activities, appealing to a broad range of visitors. | Belmont Baths, Belmont Wetlands State Park, shopping and dining options, local festivals |
| Pulbah Island | Unique and tranquil island destination within Lake Macquarie, perfect for nature retreats and private getaways. Ideal for eco-tourists and those seeking solitude. | Pulbah Island Nature Reserve, hiking trails, bird watching, fishing opportunities |
| Marmong Point | Picturesque lakeside suburb that offers stunning views and a relaxed lifestyle. Appeals to those looking for a getaway close to the water without being too far from amenities. | Marmong Point Marina, Lake Macquarie, local parks, walking paths |
Understanding Airbnb License Requirements & STR Laws in Lake Macquarie City Council (2025)
Yes, Lake Macquarie City Council, New South Wales, Australia enforces high STR regulations. Obtaining a license and ensuring compliance is almost certainly required according to current 2025 STR laws. Always verify the latest short term rental regulations and Airbnb license requirements directly with local government authorities for Lake Macquarie City Council to ensure full compliance before hosting.
(Source: AirROI data, 2025, based on 87% licensed listings)
Top Performing Airbnb Properties in Lake Macquarie City Council (2025)
Benchmark your potential! Explore examples of top-performing Airbnb properties in Lake Macquarie City Councilbased on Trailing Twelve Month (TTM) revenue. Analyze their characteristics, revenue, occupancy rate, and ADR to understand what drives success in this market.
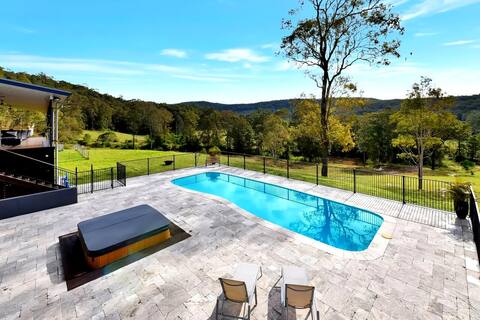
Luxury Mandalong Mansion with Pool & Spa
Entire Place • 7 bedrooms
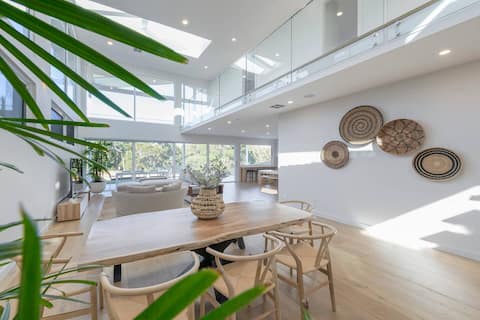
Casa De Mare - Luxury Beach House w/ Spa & Pool
Entire Place • 5 bedrooms
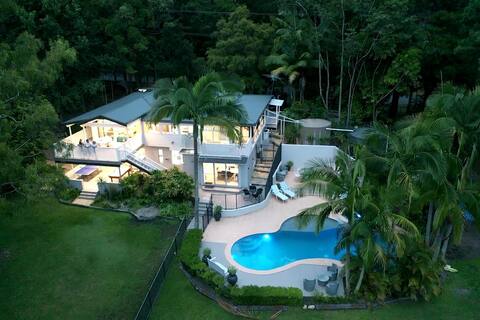
Villa Nessa - Fri Check in 10am Sun check out 6pm
Entire Place • 6 bedrooms
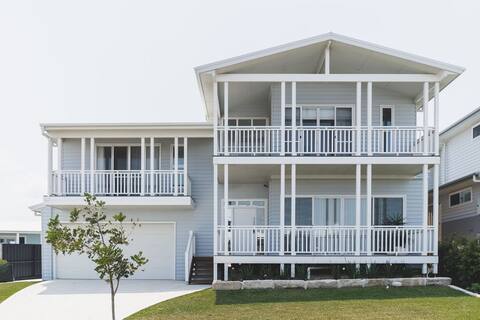
The Chalet with pool. Pay two nights, stay THREE!*
Entire Place • 5 bedrooms

Family-Friendly Pool Walk to beach 1pm checkout
Entire Place • 4 bedrooms
Highland on the Lake—An Idyllic Poolside Oasis
Entire Place • 5 bedrooms
Note: Performance varies based on location, size, amenities, seasonality, and management quality. Data reflects the past 12 months.
Top Performing Airbnb Hosts in Lake Macquarie City Council (2025)
Learn from the best! This table showcases top-performing Airbnb hosts in Lake Macquarie City Council based on the number of properties managed and estimated total revenue over the past year. Analyze their scale and performance metrics.
| Host Name | Properties | Grossing Revenue | Stay Reviews | Avg Rating |
|---|---|---|---|---|
| Lakeshores Accommodation | 34 | $534,448 | 544 | 3.83/5.0 |
| Linda | 1 | $378,919 | 55 | 4.82/5.0 |
| Lisa | 4 | $283,690 | 174 | 4.74/5.0 |
| Mihaela | 1 | $268,009 | 89 | 4.99/5.0 |
| Tiffany | 4 | $197,856 | 16 | 1.22/5.0 |
| Belle Escapes | 2 | $196,924 | 14 | 4.38/5.0 |
| Vanessa | 1 | $194,731 | 288 | 4.82/5.0 |
| James | 2 | $181,388 | 105 | 4.93/5.0 |
| Ziona | 1 | $153,475 | 123 | 4.98/5.0 |
| Sally | 1 | $141,936 | 37 | 5.00/5.0 |
Analyzing the strategies of top hosts, such as their property selection, pricing, and guest communication, can offer valuable lessons for optimizing your own Airbnb operations in Lake Macquarie City Council.
Dive Deeper: Advanced Lake Macquarie City Council STR Market Data (2025)
Ready to unlock more insights? AirROI provides access to advanced metrics and comprehensive Airbnb data for Lake Macquarie City Council. Explore detailed analytics beyond this report to refine your investment strategy, optimize pricing, and maximize your vacation rental profits.
Explore Advanced MetricsLake Macquarie City Council Short-Term Rental Market Composition (2025): Property & Room Types
Room Type Distribution
Property Type Distribution
Market Composition Insights for Lake Macquarie City Council
- The Lake Macquarie City Council Airbnb market composition is heavily skewed towards Entire Home/Apt listings, which make up 97.4% of the 189 active rentals. This indicates strong guest preference for privacy and space.
- Looking at the property type distribution in Lake Macquarie City Council, House properties are the most common (68.3%), reflecting the local real estate landscape.
- Houses represent a significant 68.3% portion, catering likely to families or larger groups.
- The presence of 7.4% Hotel/Boutique listings indicates integration with traditional hospitality.
Lake Macquarie City Council Airbnb Room Capacity Analysis (2025): Bedroom Distribution
Distribution of Listings by Number of Bedrooms
Room Capacity Insights for Lake Macquarie City Council
- The dominant room capacity in Lake Macquarie City Council is 3 bedrooms listings, making up 21.2% of the market. This suggests a strong demand for properties suitable for families or small groups.
- Together, 3 bedrooms and 2 bedrooms properties represent 40.8% of the active Airbnb listings in Lake Macquarie City Council, indicating a high concentration in these sizes.
- A significant 58.3% of listings offer 3+ bedrooms, catering to larger groups and families seeking more space in Lake Macquarie City Council.
Lake Macquarie City Council Vacation Rental Guest Capacity Trends (2025)
Distribution of Listings by Guest Capacity
Guest Capacity Insights for Lake Macquarie City Council
- The most common guest capacity trend in Lake Macquarie City Council vacation rentals is listings accommodating 8+ guests (45%). This suggests the primary traveler segment is likely larger groups.
- Properties designed for 8+ guests and 4 guests dominate the Lake Macquarie City Council STR market, accounting for 61.4% of listings.
- 62.4% of properties accommodate 6+ guests, serving the market segment for larger families or group travel in Lake Macquarie City Council.
- On average, properties in Lake Macquarie City Council are equipped to host 5.9 guests.
Lake Macquarie City Council Airbnb Booking Patterns (2025): Available vs. Booked Days
Available Days Distribution
Booked Days Distribution
Booking Pattern Insights for Lake Macquarie City Council
- The most common availability pattern in Lake Macquarie City Council falls within the 271-366 days range, representing 43.4% of listings. This suggests many properties have significant open periods on their calendars.
- Approximately 79.9% of listings show high availability (181+ days open annually), indicating potential for increased bookings or specific owner usage patterns.
- For booked days, the 91-180 days range is most frequent in Lake Macquarie City Council (37%), reflecting common guest stay durations or potential owner blocking patterns.
- A notable 20.7% of properties secure long booking periods (181+ days booked per year), highlighting successful long-term rental strategies or significant owner usage.
Lake Macquarie City Council Airbnb Minimum Stay Requirements Analysis
Distribution of Listings by Minimum Night Requirement
1 Night
18 listings
10.1% of total
2 Nights
73 listings
40.8% of total
3 Nights
11 listings
6.1% of total
4-6 Nights
3 listings
1.7% of total
30+ Nights
74 listings
41.3% of total
Key Insights
- The most prevalent minimum stay requirement in Lake Macquarie City Council is 30+ Nights, adopted by 41.3% of listings. This highlights the market's preference for longer commitments.
- A significant segment (41.3%) caters to monthly stays (30+ nights) in Lake Macquarie City Council, pointing to opportunities in the extended-stay market.
Recommendations
- Align with the market by considering a 30+ Nights minimum stay, as 41.3% of Lake Macquarie City Council hosts use this setting.
- If feasible, allowing 1-night stays, especially midweek or during low season, could capture last-minute bookings, as only 10.1% currently do.
- A 2-night minimum appears standard (40.8%). Consider this for weekends or peak periods.
- Explore offering discounts for stays of 30+ nights to attract the 41.3% of the market seeking extended stays.
- Adjust minimum nights based on seasonality – potentially shorter during low season and longer during peak demand periods in Lake Macquarie City Council.
Lake Macquarie City Council Airbnb Cancellation Policy Trends Analysis (2025)
Super Strict 30 Days
6 listings
3.5% of total
Flexible
21 listings
12.2% of total
Moderate
51 listings
29.7% of total
Firm
35 listings
20.3% of total
Strict
59 listings
34.3% of total
Cancellation Policy Insights for Lake Macquarie City Council
- The prevailing Airbnb cancellation policy trend in Lake Macquarie City Council is Strict, used by 34.3% of listings.
- A majority (54.6%) of hosts in Lake Macquarie City Council utilize Firm or Strict policies, indicating a market where hosts prioritize booking security.
Recommendations for Hosts
- Consider adopting a Strict policy to align with the 34.3% market standard in Lake Macquarie City Council.
- With 34.3% using Strict terms, this is a viable option in Lake Macquarie City Council, particularly for high-value properties or during peak demand periods.
- Regularly review your cancellation policy against competitors and market demand shifts in Lake Macquarie City Council.
Lake Macquarie City Council STR Booking Lead Time Analysis (2025)
Average Booking Lead Time by Month
Booking Lead Time Insights for Lake Macquarie City Council
- The overall average booking lead time for vacation rentals in Lake Macquarie City Council is 54 days.
- Guests book furthest in advance for stays during December (average 98 days), likely coinciding with peak travel demand or local events.
- The shortest booking windows occur for stays in August (average 33 days), indicating more last-minute travel plans during this time.
- Seasonally, Winter (75 days avg.) sees the longest lead times, while Summer (37 days avg.) has the shortest, reflecting typical travel planning cycles.
Recommendations for Hosts
- Use the overall average lead time (54 days) as a baseline for your pricing and availability strategy in Lake Macquarie City Council.
- For December stays, consider implementing length-of-stay discounts or slightly higher rates for bookings made less than 98 days out to capitalize on advance planning.
- Target marketing efforts for the Winter season well in advance (at least 75 days) to capture early planners.
- Monitor your own booking lead times against these Lake Macquarie City Council averages to identify opportunities for dynamic pricing adjustments.
Popular & Essential Airbnb Amenities in Lake Macquarie City Council (2025)
Amenity Prevalence
Amenity Insights for Lake Macquarie City Council
- Essential amenities in Lake Macquarie City Council that guests expect include: Smoke alarm, TV, Kitchen, Hot water. Lacking these (any) could significantly impact bookings.
- Popular amenities like Heating, Dishes and silverware, Free parking on premises are common but not universal. Offering these can provide a competitive edge.
- Warning: Wifi is not universally provided but is considered essential globally. Ensure reliable Wifi is offered.
Recommendations for Hosts
- Ensure your listing includes all essential amenities for Lake Macquarie City Council: Smoke alarm, TV, Kitchen, Hot water.
- Prioritize adding missing essentials: Smoke alarm, TV, Kitchen, Hot water.
- Consider adding popular differentiators like Heating or Dishes and silverware to increase appeal.
- Highlight unique or less common amenities you offer (e.g., hot tub, dedicated workspace, EV charger) in your listing description and photos.
- Regularly check competitor amenities in Lake Macquarie City Council to stay competitive.
Lake Macquarie City Council Airbnb Guest Demographics & Profile Analysis (2025)
Guest Profile Summary for Lake Macquarie City Council
- The typical guest profile for Airbnb in Lake Macquarie City Council consists of primarily domestic travelers (95%), often arriving from nearby Sydney, typically belonging to the Post-2000s (Gen Z/Alpha) group (50%), primarily speaking English or Spanish.
- Domestic travelers account for 94.6% of guests.
- Key international markets include Australia (94.6%) and United Kingdom (1.2%).
- Top languages spoken are English (70.1%) followed by Spanish (4%).
- A significant demographic segment is the Post-2000s (Gen Z/Alpha) group, representing 50% of guests.
Recommendations for Hosts
- Target domestic marketing efforts towards travelers from Sydney and New South Wales.
- Tailor amenities and listing descriptions to appeal to the dominant Post-2000s (Gen Z/Alpha) demographic (e.g., highlight fast WiFi, smart home features, local guides).
- Highlight unique local experiences or amenities relevant to the primary guest profile.
- Consider seasonal promotions aligned with peak travel times for key origin markets.
Nearby Short-Term Rental Market Comparison
How does the Lake Macquarie City Council Airbnb market stack up against its neighbors? Compare key performance metrics like average monthly revenue, ADR, and occupancy rates in surrounding areas to understand the broader regional STR landscape.
| Market | Active Properties | Monthly Revenue | Daily Rate | Avg. Occupancy |
|---|---|---|---|---|
| Penrose | 12 | $6,349 | $600.00 | 42% |
| Berry | 115 | $6,185 | $540.04 | 41% |
| Jaspers Brush | 13 | $5,600 | $510.06 | 37% |
| Burrawang | 11 | $5,005 | $523.75 | 43% |
| Green Point | 16 | $4,869 | $360.27 | 48% |
| Berrima | 44 | $4,756 | $426.34 | 42% |
| Robertson | 44 | $4,655 | $375.71 | 40% |
| Dora Creek | 17 | $4,613 | $370.02 | 45% |
| Bombo | 10 | $4,613 | $503.00 | 39% |
| Exeter | 30 | $4,595 | $519.08 | 38% |