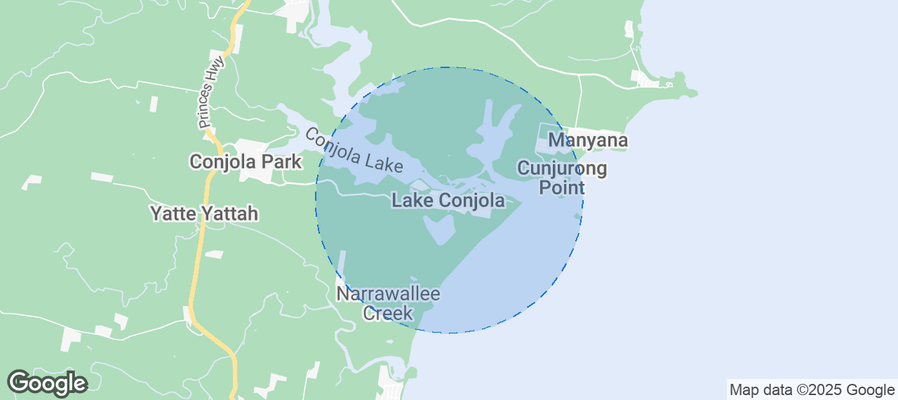
Lake Conjola Airbnb Market Analysis 2025: Short Term Rental Data & Vacation Rental Statistics in New South Wales, Australia
Is Airbnb profitable in Lake Conjola in 2025? Explore comprehensive Airbnb analytics for Lake Conjola, New South Wales, Australia to uncover income potential. This 2025 STR market report for Lake Conjola, based on AirROI data from April 2024 to March 2025, reveals key trends in the niche market of 35 active listings.
Whether you're considering an Airbnb investment in Lake Conjola, optimizing your existing vacation rental, or exploring rental arbitrage opportunities, understanding the Lake Conjola Airbnb data is crucial. Navigating the high regulation landscape is key to maximizing your short term rental income potential. Let's dive into the specifics.
Key Lake Conjola Airbnb Performance Metrics Overview
Monthly Airbnb Revenue Variations & Income Potential in Lake Conjola (2025)
Understanding the monthly revenue variations for Airbnb listings in Lake Conjola is key to maximizing your short term rental income potential. Seasonality significantly impacts earnings. Our analysis, based on data from the past 12 months, shows that the peak revenue month for STRs in Lake Conjola is typically January, while August often presents the lowest earnings, highlighting opportunities for strategic pricing adjustments during shoulder and low seasons. Explore the typical Airbnb income in Lake Conjola across different performance tiers:
- Best-in-class properties (Top 10%) achieve $4,559+ monthly, often utilizing dynamic pricing and superior guest experiences.
- Strong performing properties (Top 25%) earn $3,162 or more, indicating effective management and desirable locations/amenities.
- Typical properties (Median) generate around $2,081 per month, representing the average market performance.
- Entry-level properties (Bottom 25%) see earnings around $1,288, often with potential for optimization.
Average Monthly Airbnb Earnings Trend in Lake Conjola
Lake Conjola Airbnb Occupancy Rate Trends (2025)
Maximize your bookings by understanding the Lake Conjola STR occupancy trends. Seasonal demand shifts significantly influence how often properties are booked. Typically, Januarysees the highest demand (peak season occupancy), while August experiences the lowest (low season). Effective strategies, like adjusting minimum stays or offering promotions, can boost occupancy during slower periods. Here's how different property tiers perform in Lake Conjola:
- Best-in-class properties (Top 10%) achieve 63%+ occupancy, indicating high desirability and potentially optimized availability.
- Strong performing properties (Top 25%) maintain 46% or higher occupancy, suggesting good market fit and guest satisfaction.
- Typical properties (Median) have an occupancy rate around 28%.
- Entry-level properties (Bottom 25%) average 15% occupancy, potentially facing higher vacancy.
Average Monthly Occupancy Rate Trend in Lake Conjola
Average Daily Rate (ADR) Airbnb Trends in Lake Conjola (2025)
Effective short term rental pricing strategy in Lake Conjola involves understanding monthly ADR fluctuations. The Average Daily Rate (ADR) for Airbnb in Lake Conjola typically peaks in January and dips lowest during August. Leveraging Airbnb dynamic pricing tools or strategies based on this seasonality can significantly boost revenue. Here's a look at the typical nightly rates achieved:
- Best-in-class properties (Top 10%) command rates of $497+ per night, often due to premium features or locations.
- Strong performing properties (Top 25%) achieve nightly rates of $334 or more.
- Typical properties (Median) charge around $240 per night.
- Entry-level properties (Bottom 25%) earn around $183 per night.
Average Daily Rate (ADR) Trend by Month in Lake Conjola
Get Live Lake Conjola Market Intelligence 👇
Explore Real-time Analytics
Airbnb Seasonality Analysis & Trends in Lake Conjola (2025)
Peak Season (January, December, April)
- Revenue averages $4,077 per month
- Occupancy rates average 44.1%
- Daily rates average $306
Shoulder Season
- Revenue averages $2,382 per month
- Occupancy maintains around 31.6%
- Daily rates hold near $275
Low Season (July, August, September)
- Revenue drops to average $1,258 per month
- Occupancy decreases to average 20.1%
- Daily rates adjust to average $260
Seasonality Insights for Lake Conjola
- The Airbnb seasonality in Lake Conjola shows highly seasonal trends requiring careful strategy. While the sections above show seasonal averages, it's also insightful to look at the extremes:
- During the high season, the absolute peak month showcases Lake Conjola's highest earning potential, with monthly revenues capable of climbing to $5,523, occupancy reaching a high of 53.3%, and ADRs peaking at $332.
- Conversely, the slowest single month of the year, typically falling within the low season, marks the market's lowest point. In this month, revenue might dip to $923, occupancy could drop to 13.8%, and ADRs may adjust down to $254.
- Understanding both the seasonal averages and these monthly peaks and troughs in revenue, occupancy, and ADR is crucial for maximizing your Airbnb profit potential in Lake Conjola.
Seasonal Strategies for Maximizing Profit
- Peak Season: Maximize revenue through premium pricing and potentially longer minimum stays. Ensure high availability.
- Low Season: Offer competitive pricing, special promotions (e.g., extended stay discounts), and flexible cancellation policies. Target off-season travelers like remote workers or budget-conscious guests.
- Shoulder Seasons: Implement dynamic pricing that balances peak and low rates. Target weekend travelers or specific events. Offer slightly more flexible terms than peak season.
- Regularly analyze your own performance against these Lake Conjola seasonality benchmarks and adjust your pricing and availability strategy accordingly.
Best Areas for Airbnb Investment in Lake Conjola (2025)
Exploring the top neighborhoods for short-term rentals in Lake Conjola? This section highlights key areas, outlining why they are attractive for hosts and guests, along with notable local attractions. Consider these locations based on your target guest profile and investment strategy.
| Neighborhood / Area | Why Host Here? (Target Guests & Appeal) | Key Attractions & Landmarks |
|---|---|---|
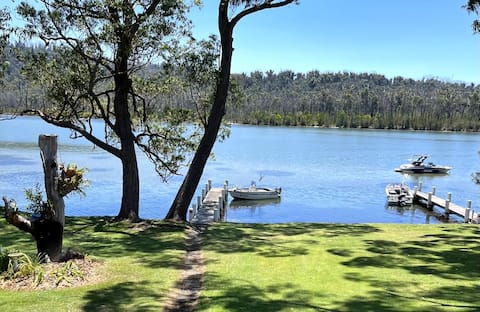
| Lake Conjola Village | Charming village atmosphere with access to breathtaking Lake Conjola. Perfect for families and couples looking for a peaceful getaway with water activities and nature. | Lake Conjola National Park, Conjola Beach, Conjola Creek, local cafes, fishing spots, kayaking opportunities |
| Conjola Beach | Beautiful beach area known for its family-friendly environment. Ideal for beach lovers and water sports enthusiasts seeking a relaxing experience by the shore. | Conjola Beach, surfing, swimming, picnic areas, barbecue facilities, local markets |
| Lake Tabourie | Situated nearby, this area offers a quieter alternative with proximity to stunning beaches and natural reserves, appealing to nature lovers and those wanting to escape the crowds. | Lake Tabourie Beach, Tabourie Lake Nature Reserve, fishing spots, hiking trails, wildlife watching, peaceful picnic areas |
| Bengworden | A hidden gem with scenic views and a laid-back atmosphere. Great for visitors looking for a unique stay away from the more tourist-heavy spots. | Bengworden Lookout, scenic drives, local wildlife, nature walks, fishing, tranquil surroundings |
| Mollymook | Famous for its stunning beaches and golf course, this area attracts both beach enthusiasts and golfers, promising a great vacation experience. | Mollymook Beach, Mollymook Golf Club, local restaurants, water sports, walking trails, diving spots |
| Ulladulla | A vibrant coastal town with a bustling harbor, offering a variety of town amenities, shops, and restaurants along with beautiful beaches. | Ulladulla Harbour, Warden Head Light, local markets, Beecroft Peninsula, Mollymook Golf Club, South Pacific Heathland Reserve |
| Narrawallee | A tranquil coastal area perfect for those looking for a peaceful beach retreat with beautiful scenery and outdoor activities. | Narrawallee Beach, Narrawallee Inlet, snorkeling, beach walks, local restaurants, wildlife watching |
| Depot Beach | A stunning and less-crowded beach perfect for those who appreciate nature and want a pristine environment for relaxation and recreation. | Depot Beach, Biamanga National Park, camping spots, surfing, fishing, walking tracks |
Understanding Airbnb License Requirements & STR Laws in Lake Conjola (2025)
Yes, Lake Conjola, New South Wales, Australia enforces high STR regulations. Obtaining a license and ensuring compliance is almost certainly required according to current 2025 STR laws. Always verify the latest short term rental regulations and Airbnb license requirements directly with local government authorities for Lake Conjola to ensure full compliance before hosting.
(Source: AirROI data, 2025, based on 83% licensed listings)
Top Performing Airbnb Properties in Lake Conjola (2025)
Benchmark your potential! Explore examples of top-performing Airbnb properties in Lake Conjolabased on Trailing Twelve Month (TTM) revenue. Analyze their characteristics, revenue, occupancy rate, and ADR to understand what drives success in this market.
House with private jetty - 'Hooked on Conjola'
Entire Place • 3 bedrooms
Conjola Casa Lago ‘Lake House’
Entire Place • 4 bedrooms
Waterfront Wonder
Entire Place • 3 bedrooms
The Muskoka
Entire Place • 4 bedrooms
Lumiere Lakes
Entire Place • 3 bedrooms
The Boardwalk
Entire Place • 3 bedrooms
Note: Performance varies based on location, size, amenities, seasonality, and management quality. Data reflects the past 12 months.
Top Performing Airbnb Hosts in Lake Conjola (2025)
Learn from the best! This table showcases top-performing Airbnb hosts in Lake Conjola based on the number of properties managed and estimated total revenue over the past year. Analyze their scale and performance metrics.
| Host Name | Properties | Grossing Revenue | Stay Reviews | Avg Rating |
|---|---|---|---|---|
| Mollymook Milton | 3 | $67,617 | 33 | 3.09/5.0 |
| Amanda | 1 | $66,768 | 41 | 4.93/5.0 |
| Ingenia Holidays | 4 | $56,979 | 20 | 1.20/5.0 |
| Katie | 2 | $48,120 | 77 | 4.62/5.0 |
| Dale | 1 | $43,204 | 16 | 4.50/5.0 |
| Holiday Rental Specialists | 2 | $42,866 | 24 | 4.25/5.0 |
| Karly | 1 | $37,579 | 17 | 5.00/5.0 |
| Lynne | 1 | $36,904 | 143 | 4.98/5.0 |
| Bec | 1 | $34,859 | 54 | 4.98/5.0 |
| Denise | 1 | $30,986 | 76 | 4.79/5.0 |
Analyzing the strategies of top hosts, such as their property selection, pricing, and guest communication, can offer valuable lessons for optimizing your own Airbnb operations in Lake Conjola.
Dive Deeper: Advanced Lake Conjola STR Market Data (2025)
Ready to unlock more insights? AirROI provides access to advanced metrics and comprehensive Airbnb data for Lake Conjola. Explore detailed analytics beyond this report to refine your investment strategy, optimize pricing, and maximize your vacation rental profits.
Explore Advanced MetricsLake Conjola Short-Term Rental Market Composition (2025): Property & Room Types
Room Type Distribution
Property Type Distribution
Market Composition Insights for Lake Conjola
- The Lake Conjola Airbnb market composition is heavily skewed towards Entire Home/Apt listings, which make up 100% of the 35 active rentals. This indicates strong guest preference for privacy and space.
- Looking at the property type distribution in Lake Conjola, House properties are the most common (82.9%), reflecting the local real estate landscape.
- Houses represent a significant 82.9% portion, catering likely to families or larger groups.
- Smaller segments like others (combined 2.9%) offer potential for unique stay experiences.
Lake Conjola Airbnb Room Capacity Analysis (2025): Bedroom Distribution
Distribution of Listings by Number of Bedrooms
Room Capacity Insights for Lake Conjola
- The dominant room capacity in Lake Conjola is 3 bedrooms listings, making up 54.3% of the market. This suggests a strong demand for properties suitable for families or small groups.
- Together, 3 bedrooms and 4 bedrooms properties represent 71.4% of the active Airbnb listings in Lake Conjola, indicating a high concentration in these sizes.
- A significant 74.3% of listings offer 3+ bedrooms, catering to larger groups and families seeking more space in Lake Conjola.
Lake Conjola Vacation Rental Guest Capacity Trends (2025)
Distribution of Listings by Guest Capacity
Guest Capacity Insights for Lake Conjola
- The most common guest capacity trend in Lake Conjola vacation rentals is listings accommodating 8+ guests (54.3%). This suggests the primary traveler segment is likely larger groups.
- Properties designed for 8+ guests and 6 guests dominate the Lake Conjola STR market, accounting for 74.3% of listings.
- 82.9% of properties accommodate 6+ guests, serving the market segment for larger families or group travel in Lake Conjola.
- On average, properties in Lake Conjola are equipped to host 6.6 guests.
Lake Conjola Airbnb Booking Patterns (2025): Available vs. Booked Days
Available Days Distribution
Booked Days Distribution
Booking Pattern Insights for Lake Conjola
- The most common availability pattern in Lake Conjola falls within the 271-366 days range, representing 68.6% of listings. This suggests many properties have significant open periods on their calendars.
- Approximately 88.6% of listings show high availability (181+ days open annually), indicating potential for increased bookings or specific owner usage patterns.
- For booked days, the 31-90 days range is most frequent in Lake Conjola (42.9%), reflecting common guest stay durations or potential owner blocking patterns.
- A notable 11.4% of properties secure long booking periods (181+ days booked per year), highlighting successful long-term rental strategies or significant owner usage.
Lake Conjola Airbnb Minimum Stay Requirements Analysis
Distribution of Listings by Minimum Night Requirement
1 Night
1 listings
3.2% of total
2 Nights
6 listings
19.4% of total
3 Nights
3 listings
9.7% of total
4-6 Nights
4 listings
12.9% of total
30+ Nights
17 listings
54.8% of total
Key Insights
- The most prevalent minimum stay requirement in Lake Conjola is 30+ Nights, adopted by 54.8% of listings. This highlights the market's preference for longer commitments.
- A significant segment (54.8%) caters to monthly stays (30+ nights) in Lake Conjola, pointing to opportunities in the extended-stay market.
Recommendations
- Align with the market by considering a 30+ Nights minimum stay, as 54.8% of Lake Conjola hosts use this setting.
- If feasible, allowing 1-night stays, especially midweek or during low season, could capture last-minute bookings, as only 3.2% currently do.
- Explore offering discounts for stays of 30+ nights to attract the 54.8% of the market seeking extended stays.
- Adjust minimum nights based on seasonality – potentially shorter during low season and longer during peak demand periods in Lake Conjola.
Lake Conjola Airbnb Cancellation Policy Trends Analysis (2025)
Super Strict 30 Days
6 listings
20% of total
Super Strict 60 Days
2 listings
6.7% of total
Flexible
3 listings
10% of total
Moderate
4 listings
13.3% of total
Firm
4 listings
13.3% of total
Strict
11 listings
36.7% of total
Cancellation Policy Insights for Lake Conjola
- The prevailing Airbnb cancellation policy trend in Lake Conjola is Strict, used by 36.7% of listings.
- There's a relatively balanced mix between guest-friendly (23.3%) and stricter (50.0%) policies, offering choices for different guest needs.
Recommendations for Hosts
- Consider adopting a Strict policy to align with the 36.7% market standard in Lake Conjola.
- With 36.7% using Strict terms, this is a viable option in Lake Conjola, particularly for high-value properties or during peak demand periods.
- Regularly review your cancellation policy against competitors and market demand shifts in Lake Conjola.
Lake Conjola STR Booking Lead Time Analysis (2025)
Average Booking Lead Time by Month
Booking Lead Time Insights for Lake Conjola
- The overall average booking lead time for vacation rentals in Lake Conjola is 62 days.
- Guests book furthest in advance for stays during December (average 95 days), likely coinciding with peak travel demand or local events.
- The shortest booking windows occur for stays in May (average 31 days), indicating more last-minute travel plans during this time.
- Seasonally, Winter (80 days avg.) sees the longest lead times, while Spring (36 days avg.) has the shortest, reflecting typical travel planning cycles.
Recommendations for Hosts
- Use the overall average lead time (62 days) as a baseline for your pricing and availability strategy in Lake Conjola.
- For December stays, consider implementing length-of-stay discounts or slightly higher rates for bookings made less than 95 days out to capitalize on advance planning.
- Target marketing efforts for the Winter season well in advance (at least 80 days) to capture early planners.
- Monitor your own booking lead times against these Lake Conjola averages to identify opportunities for dynamic pricing adjustments.
Popular & Essential Airbnb Amenities in Lake Conjola (2025)
Amenity Prevalence
Amenity Insights for Lake Conjola
- Essential amenities in Lake Conjola that guests expect include: TV, Smoke alarm, Refrigerator, Kitchen. Lacking these (any) could significantly impact bookings.
- Popular amenities like Cooking basics, Free parking on premises, Dishes and silverware are common but not universal. Offering these can provide a competitive edge.
Recommendations for Hosts
- Ensure your listing includes all essential amenities for Lake Conjola: TV, Smoke alarm, Refrigerator, Kitchen.
- Prioritize adding missing essentials: Smoke alarm, Refrigerator, Kitchen.
- Consider adding popular differentiators like Cooking basics or Free parking on premises to increase appeal.
- Highlight unique or less common amenities you offer (e.g., hot tub, dedicated workspace, EV charger) in your listing description and photos.
- Regularly check competitor amenities in Lake Conjola to stay competitive.
Lake Conjola Airbnb Guest Demographics & Profile Analysis (2025)
Guest Profile Summary for Lake Conjola
- The typical guest profile for Airbnb in Lake Conjola consists of primarily domestic travelers (91%), often arriving from nearby Sydney, typically belonging to the Post-2000s (Gen Z/Alpha) group (50%), primarily speaking English or Spanish.
- Domestic travelers account for 90.5% of guests.
- Key international markets include Australia (90.5%) and United Kingdom (3.2%).
- Top languages spoken are English (60.5%) followed by Spanish (9.2%).
- A significant demographic segment is the Post-2000s (Gen Z/Alpha) group, representing 50% of guests.
Recommendations for Hosts
- Target domestic marketing efforts towards travelers from Sydney and New South Wales.
- Tailor amenities and listing descriptions to appeal to the dominant Post-2000s (Gen Z/Alpha) demographic (e.g., highlight fast WiFi, smart home features, local guides).
- Highlight unique local experiences or amenities relevant to the primary guest profile.
- Consider seasonal promotions aligned with peak travel times for key origin markets.
Nearby Short-Term Rental Market Comparison
How does the Lake Conjola Airbnb market stack up against its neighbors? Compare key performance metrics like average monthly revenue, ADR, and occupancy rates in surrounding areas to understand the broader regional STR landscape.
| Market | Active Properties | Monthly Revenue | Daily Rate | Avg. Occupancy |
|---|---|---|---|---|
| Penrose | 12 | $6,349 | $600.00 | 42% |
| Berry | 115 | $6,185 | $540.04 | 41% |
| Jaspers Brush | 13 | $5,600 | $510.06 | 37% |
| Burrawang | 11 | $5,005 | $523.75 | 43% |
| Berrima | 44 | $4,756 | $426.34 | 42% |
| Braidwood | 20 | $4,708 | $443.62 | 40% |
| Robertson | 44 | $4,655 | $375.71 | 40% |
| Bombo | 10 | $4,613 | $503.00 | 39% |
| Exeter | 30 | $4,595 | $519.08 | 38% |
| Gerringong | 121 | $4,483 | $486.76 | 37% |