Korora Airbnb Market Analysis 2025: Short Term Rental Data & Vacation Rental Statistics in New South Wales, Australia
Is Airbnb profitable in Korora in 2025? Explore comprehensive Airbnb analytics for Korora, New South Wales, Australia to uncover income potential. This 2025 STR market report for Korora, based on AirROI data from April 2024 to March 2025, reveals key trends in the niche market of 46 active listings.
Whether you're considering an Airbnb investment in Korora, optimizing your existing vacation rental, or exploring rental arbitrage opportunities, understanding the Korora Airbnb data is crucial. Navigating the high regulation landscape is key to maximizing your short term rental income potential. Let's dive into the specifics.
Key Korora Airbnb Performance Metrics Overview
Monthly Airbnb Revenue Variations & Income Potential in Korora (2025)
Understanding the monthly revenue variations for Airbnb listings in Korora is key to maximizing your short term rental income potential. Seasonality significantly impacts earnings. Our analysis, based on data from the past 12 months, shows that the peak revenue month for STRs in Korora is typically January, while March often presents the lowest earnings, highlighting opportunities for strategic pricing adjustments during shoulder and low seasons. Explore the typical Airbnb income in Korora across different performance tiers:
- Best-in-class properties (Top 10%) achieve $5,452+ monthly, often utilizing dynamic pricing and superior guest experiences.
- Strong performing properties (Top 25%) earn $3,678 or more, indicating effective management and desirable locations/amenities.
- Typical properties (Median) generate around $2,274 per month, representing the average market performance.
- Entry-level properties (Bottom 25%) see earnings around $1,199, often with potential for optimization.
Average Monthly Airbnb Earnings Trend in Korora
Korora Airbnb Occupancy Rate Trends (2025)
Maximize your bookings by understanding the Korora STR occupancy trends. Seasonal demand shifts significantly influence how often properties are booked. Typically, Januarysees the highest demand (peak season occupancy), while June experiences the lowest (low season). Effective strategies, like adjusting minimum stays or offering promotions, can boost occupancy during slower periods. Here's how different property tiers perform in Korora:
- Best-in-class properties (Top 10%) achieve 81%+ occupancy, indicating high desirability and potentially optimized availability.
- Strong performing properties (Top 25%) maintain 65% or higher occupancy, suggesting good market fit and guest satisfaction.
- Typical properties (Median) have an occupancy rate around 36%.
- Entry-level properties (Bottom 25%) average 19% occupancy, potentially facing higher vacancy.
Average Monthly Occupancy Rate Trend in Korora
Average Daily Rate (ADR) Airbnb Trends in Korora (2025)
Effective short term rental pricing strategy in Korora involves understanding monthly ADR fluctuations. The Average Daily Rate (ADR) for Airbnb in Korora typically peaks in January and dips lowest during May. Leveraging Airbnb dynamic pricing tools or strategies based on this seasonality can significantly boost revenue. Here's a look at the typical nightly rates achieved:
- Best-in-class properties (Top 10%) command rates of $506+ per night, often due to premium features or locations.
- Strong performing properties (Top 25%) achieve nightly rates of $361 or more.
- Typical properties (Median) charge around $213 per night.
- Entry-level properties (Bottom 25%) earn around $125 per night.
Average Daily Rate (ADR) Trend by Month in Korora
Get Live Korora Market Intelligence 👇

Explore Real-time Analytics
Airbnb Seasonality Analysis & Trends in Korora (2025)
Peak Season (January, December, April)
- Revenue averages $3,719 per month
- Occupancy rates average 47.2%
- Daily rates average $291
Shoulder Season
- Revenue averages $2,699 per month
- Occupancy maintains around 41.2%
- Daily rates hold near $249
Low Season (February, March, November)
- Revenue drops to average $2,057 per month
- Occupancy decreases to average 39.2%
- Daily rates adjust to average $267
Seasonality Insights for Korora
- The Airbnb seasonality in Korora shows moderate seasonality with distinct peak and low periods. While the sections above show seasonal averages, it's also insightful to look at the extremes:
- During the high season, the absolute peak month showcases Korora's highest earning potential, with monthly revenues capable of climbing to $3,924, occupancy reaching a high of 53.3%, and ADRs peaking at $320.
- Conversely, the slowest single month of the year, typically falling within the low season, marks the market's lowest point. In this month, revenue might dip to $1,988, occupancy could drop to 34.9%, and ADRs may adjust down to $244.
- Understanding both the seasonal averages and these monthly peaks and troughs in revenue, occupancy, and ADR is crucial for maximizing your Airbnb profit potential in Korora.
Seasonal Strategies for Maximizing Profit
- Peak Season: Maximize revenue through premium pricing and potentially longer minimum stays. Ensure high availability.
- Low Season: Offer competitive pricing, special promotions (e.g., extended stay discounts), and flexible cancellation policies. Target off-season travelers like remote workers or budget-conscious guests.
- Shoulder Seasons: Implement dynamic pricing that balances peak and low rates. Target weekend travelers or specific events. Offer slightly more flexible terms than peak season.
- Regularly analyze your own performance against these Korora seasonality benchmarks and adjust your pricing and availability strategy accordingly.
Best Areas for Airbnb Investment in Korora (2025)
Exploring the top neighborhoods for short-term rentals in Korora? This section highlights key areas, outlining why they are attractive for hosts and guests, along with notable local attractions. Consider these locations based on your target guest profile and investment strategy.
| Neighborhood / Area | Why Host Here? (Target Guests & Appeal) | Key Attractions & Landmarks |
|---|---|---|
| Korora Beach | Popular beach destination with stunning views, great surfing spots, and family-friendly atmosphere. Attracts both tourists and locals looking for leisure and relaxation by the water. | Korora Beach, Sunset Beach, Solitary Islands Marine Park, Coffs Harbour Butterfly House, North Coast Regional Botanic Garden |
| Coffs Harbour | The nearby regional center featuring a wide range of amenities, shops, and restaurants. A hub for tourists exploring the Coffs Coast and the Great Dividing Range. | Big Banana Fun Park, Coffs Harbour Marina, Coffs Central Shopping Centre, Coffs Harbour Regional Museum, Forest Sky Pier |
| Emerald Beach | A quieter beach alternative with a relaxed vibe, popular among families and those seeking a peaceful retreat, while still close to Coffs Harbour. | Emerald Beach, Moonee Beach Nature Reserve, Look At Me Now Headland, Emerald Beach Surf Club |
| Sawtell | Charming coastal village with a strong café culture, picturesque beaches, and relaxed atmosphere. Attracts visitors looking for a tranquil getaway. | Sawtell Beach, Sawtell Cinema, First Avenue Boutique Shops, Bonville Headland Nature Reserve, Macksville |
| Boambee | Suburban area close to Coffs Harbour with easy access to beaches and local amenities. Ideal for families and short-term visits. | Boambee Beach, Coffs Coast Sport and Leisure Park, Local parks and playgrounds, Boambee Creek |
| Diggers Beach | Beautiful spot with scenic views and popular surf conditions. Attracts surfers and beachgoers looking for a great day at the beach. | Diggers Beach, Park Beach Plaza, Coffs Harbour Golf Club, North Coast Regional Botanic Garden |
| Moonee Beach | A laid-back beach community known for its calm waters, ideal for families and those enjoying water sports. Offers a relaxed coastal lifestyle. | Moonee Beach, Moonee Beach Nature Reserve, Local cafes and restaurants, Fishing and surfing spots |
| Sapphire Beach | Upscale residential area with stunning ocean views and a tranquil atmosphere. Popular among those seeking a luxurious seaside experience. | Sapphire Beach, Local high-end restaurants, Coffs Harbour International Marina, Scenic coastal walks |
Understanding Airbnb License Requirements & STR Laws in Korora (2025)
Yes, Korora, New South Wales, Australia enforces high STR regulations. Obtaining a license and ensuring compliance is almost certainly required according to current 2025 STR laws. Always verify the latest short term rental regulations and Airbnb license requirements directly with local government authorities for Korora to ensure full compliance before hosting.
(Source: AirROI data, 2025, based on 89% licensed listings)
Top Performing Airbnb Properties in Korora (2025)
Benchmark your potential! Explore examples of top-performing Airbnb properties in Kororabased on Trailing Twelve Month (TTM) revenue. Analyze their characteristics, revenue, occupancy rate, and ADR to understand what drives success in this market.
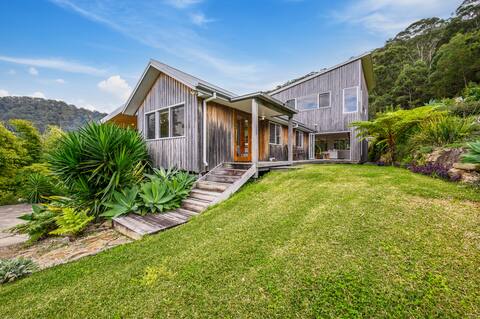
Tranquil Treetop Haven: 3BR Home w/ Stunning Views
Entire Place • 3 bedrooms
Light
Entire Place • 4 bedrooms
Shearwater Nest
Entire Place • 3 bedrooms
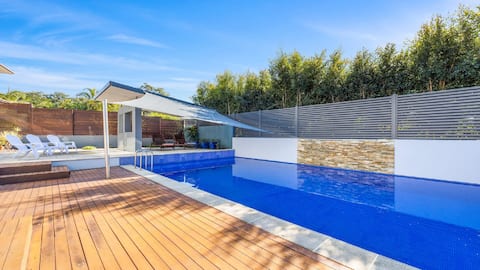
Azure - Couples, Luxe, Pool + Beachfront
Entire Place • 3 bedrooms
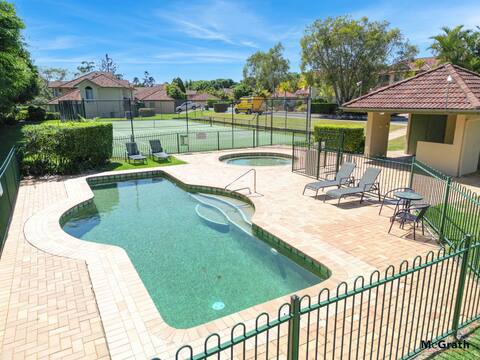
Shell Cove Beach house
Entire Place • 4 bedrooms

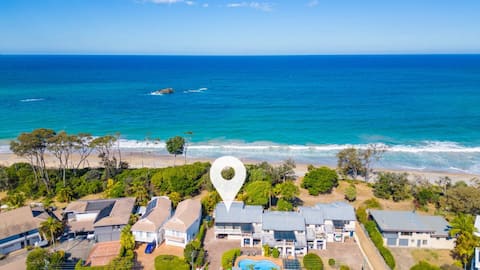
Ocean View Retreat
Entire Place • 1 bedroom
Note: Performance varies based on location, size, amenities, seasonality, and management quality. Data reflects the past 12 months.
Top Performing Airbnb Hosts in Korora (2025)
Learn from the best! This table showcases top-performing Airbnb hosts in Korora based on the number of properties managed and estimated total revenue over the past year. Analyze their scale and performance metrics.
| Host Name | Properties | Grossing Revenue | Stay Reviews | Avg Rating |
|---|---|---|---|---|
| Coffs Coast Accommodation | 5 | $206,994 | 70 | 4.93/5.0 |
| Holiday Coffs Coast | 5 | $135,505 | 79 | 3.87/5.0 |
| Chris | 1 | $67,790 | 58 | 5.00/5.0 |
| Coffs Harbour Holiday Rentals | 2 | $64,834 | 8 | 4.88/5.0 |
| Adele | 2 | $52,345 | 1197 | 4.89/5.0 |
| Benji And Katy | 1 | $48,678 | 108 | 4.94/5.0 |
| Vicki | 1 | $41,998 | 9 | 5.00/5.0 |
| Jarred | 1 | $41,253 | 454 | 4.85/5.0 |
| Lucas | 1 | $38,031 | 34 | 4.85/5.0 |
| Michael | 1 | $36,843 | 24 | 4.96/5.0 |
Analyzing the strategies of top hosts, such as their property selection, pricing, and guest communication, can offer valuable lessons for optimizing your own Airbnb operations in Korora.
Dive Deeper: Advanced Korora STR Market Data (2025)
Ready to unlock more insights? AirROI provides access to advanced metrics and comprehensive Airbnb data for Korora. Explore detailed analytics beyond this report to refine your investment strategy, optimize pricing, and maximize your vacation rental profits.
Explore Advanced MetricsKorora Short-Term Rental Market Composition (2025): Property & Room Types
Room Type Distribution
Property Type Distribution
Market Composition Insights for Korora
- The Korora Airbnb market composition is heavily skewed towards Entire Home/Apt listings, which make up 87% of the 46 active rentals. This indicates strong guest preference for privacy and space.
- Looking at the property type distribution in Korora, House properties are the most common (50%), reflecting the local real estate landscape.
- Houses represent a significant 50% portion, catering likely to families or larger groups.
- The presence of 8.7% Hotel/Boutique listings indicates integration with traditional hospitality.
Korora Airbnb Room Capacity Analysis (2025): Bedroom Distribution
Distribution of Listings by Number of Bedrooms
Room Capacity Insights for Korora
- The dominant room capacity in Korora is 1 bedroom listings, making up 32.6% of the market. This suggests a strong demand for properties suitable for couples or solo travelers.
- Together, 1 bedroom and 2 bedrooms properties represent 58.7% of the active Airbnb listings in Korora, indicating a high concentration in these sizes.
- A significant 34.8% of listings offer 3+ bedrooms, catering to larger groups and families seeking more space in Korora.
Korora Vacation Rental Guest Capacity Trends (2025)
Distribution of Listings by Guest Capacity
Guest Capacity Insights for Korora
- The most common guest capacity trend in Korora vacation rentals is listings accommodating 2 guests (28.3%). This suggests the primary traveler segment is likely couples or solo travelers.
- Properties designed for 2 guests and 8+ guests dominate the Korora STR market, accounting for 50.0% of listings.
- 39.1% of properties accommodate 6+ guests, serving the market segment for larger families or group travel in Korora.
- On average, properties in Korora are equipped to host 4.6 guests.
Korora Airbnb Booking Patterns (2025): Available vs. Booked Days
Available Days Distribution
Booked Days Distribution
Booking Pattern Insights for Korora
- The most common availability pattern in Korora falls within the 271-366 days range, representing 39.1% of listings. This suggests many properties have significant open periods on their calendars.
- Approximately 71.7% of listings show high availability (181+ days open annually), indicating potential for increased bookings or specific owner usage patterns.
- For booked days, the 91-180 days range is most frequent in Korora (32.6%), reflecting common guest stay durations or potential owner blocking patterns.
- A notable 30.4% of properties secure long booking periods (181+ days booked per year), highlighting successful long-term rental strategies or significant owner usage.
Korora Airbnb Minimum Stay Requirements Analysis
Distribution of Listings by Minimum Night Requirement
1 Night
7 listings
16.3% of total
2 Nights
15 listings
34.9% of total
3 Nights
3 listings
7% of total
4-6 Nights
3 listings
7% of total
30+ Nights
15 listings
34.9% of total
Key Insights
- The most prevalent minimum stay requirement in Korora is 2 Nights, adopted by 34.9% of listings. This highlights the market's preference for shorter, flexible bookings.
- A significant segment (34.9%) caters to monthly stays (30+ nights) in Korora, pointing to opportunities in the extended-stay market.
Recommendations
- Align with the market by considering a 2 Nights minimum stay, as 34.9% of Korora hosts use this setting.
- If feasible, allowing 1-night stays, especially midweek or during low season, could capture last-minute bookings, as only 16.3% currently do.
- A 2-night minimum appears standard (34.9%). Consider this for weekends or peak periods.
- Explore offering discounts for stays of 30+ nights to attract the 34.9% of the market seeking extended stays.
- Adjust minimum nights based on seasonality – potentially shorter during low season and longer during peak demand periods in Korora.
Korora Airbnb Cancellation Policy Trends Analysis (2025)
Super Strict 30 Days
6 listings
14% of total
Flexible
6 listings
14% of total
Moderate
17 listings
39.5% of total
Firm
7 listings
16.3% of total
Strict
7 listings
16.3% of total
Cancellation Policy Insights for Korora
- The prevailing Airbnb cancellation policy trend in Korora is Moderate, used by 39.5% of listings.
- There's a relatively balanced mix between guest-friendly (53.5%) and stricter (32.6%) policies, offering choices for different guest needs.
Recommendations for Hosts
- Consider adopting a Moderate policy to align with the 39.5% market standard in Korora.
- Regularly review your cancellation policy against competitors and market demand shifts in Korora.
Korora STR Booking Lead Time Analysis (2025)
Average Booking Lead Time by Month
Booking Lead Time Insights for Korora
- The overall average booking lead time for vacation rentals in Korora is 50 days.
- Guests book furthest in advance for stays during October (average 65 days), likely coinciding with peak travel demand or local events.
- The shortest booking windows occur for stays in April (average 27 days), indicating more last-minute travel plans during this time.
- Seasonally, Winter (53 days avg.) sees the longest lead times, while Summer (37 days avg.) has the shortest, reflecting typical travel planning cycles.
Recommendations for Hosts
- Use the overall average lead time (50 days) as a baseline for your pricing and availability strategy in Korora.
- For October stays, consider implementing length-of-stay discounts or slightly higher rates for bookings made less than 65 days out to capitalize on advance planning.
- Target marketing efforts for the Winter season well in advance (at least 53 days) to capture early planners.
- Monitor your own booking lead times against these Korora averages to identify opportunities for dynamic pricing adjustments.
Popular & Essential Airbnb Amenities in Korora (2025)
Amenity Prevalence
Amenity Insights for Korora
- Essential amenities in Korora that guests expect include: TV, Wifi, Smoke alarm. Lacking these (any) could significantly impact bookings.
- Popular amenities like Dishes and silverware, Free parking on premises, Kitchen are common but not universal. Offering these can provide a competitive edge.
Recommendations for Hosts
- Ensure your listing includes all essential amenities for Korora: TV, Wifi, Smoke alarm.
- Prioritize adding missing essentials: TV, Wifi, Smoke alarm.
- Consider adding popular differentiators like Dishes and silverware or Free parking on premises to increase appeal.
- Highlight unique or less common amenities you offer (e.g., hot tub, dedicated workspace, EV charger) in your listing description and photos.
- Regularly check competitor amenities in Korora to stay competitive.
Korora Airbnb Guest Demographics & Profile Analysis (2025)
Guest Profile Summary for Korora
- The typical guest profile for Airbnb in Korora consists of primarily domestic travelers (89%), often arriving from nearby Sydney, typically belonging to the Post-2000s (Gen Z/Alpha) group (50%), primarily speaking English or Spanish.
- Domestic travelers account for 89.4% of guests.
- Key international markets include Australia (89.4%) and United Kingdom (2.7%).
- Top languages spoken are English (70.2%) followed by Spanish (4.9%).
- A significant demographic segment is the Post-2000s (Gen Z/Alpha) group, representing 50% of guests.
Recommendations for Hosts
- Target domestic marketing efforts towards travelers from Sydney and Brisbane.
- Tailor amenities and listing descriptions to appeal to the dominant Post-2000s (Gen Z/Alpha) demographic (e.g., highlight fast WiFi, smart home features, local guides).
- Highlight unique local experiences or amenities relevant to the primary guest profile.
- Consider seasonal promotions aligned with peak travel times for key origin markets.
Nearby Short-Term Rental Market Comparison
How does the Korora Airbnb market stack up against its neighbors? Compare key performance metrics like average monthly revenue, ADR, and occupancy rates in surrounding areas to understand the broader regional STR landscape.
| Market | Active Properties | Monthly Revenue | Daily Rate | Avg. Occupancy |
|---|---|---|---|---|
| Evans Head | 53 | $3,039 | $319.89 | 39% |
| Sawtell | 141 | $2,907 | $260.87 | 44% |
| Minnie Water | 15 | $2,814 | $227.80 | 42% |
| Yamba | 379 | $2,714 | $306.86 | 38% |
| Gleniffer | 35 | $2,650 | $341.78 | 35% |
| Clarence Valley Council | 74 | $2,611 | $248.17 | 38% |
| Brooms Head | 22 | $2,565 | $252.25 | 37% |
| Mylestom | 13 | $2,544 | $257.18 | 34% |
| Coffs Harbour | 337 | $2,523 | $237.18 | 42% |
| Emerald Beach | 46 | $2,519 | $262.73 | 40% |