Kangaroo Valley Airbnb Market Analysis 2025: Short Term Rental Data & Vacation Rental Statistics in New South Wales, Australia
Is Airbnb profitable in Kangaroo Valley in 2025? Explore comprehensive Airbnb analytics for Kangaroo Valley, New South Wales, Australia to uncover income potential. This 2025 STR market report for Kangaroo Valley, based on AirROI data from April 2024 to March 2025, reveals key trends in the niche market of 130 active listings.
Whether you're considering an Airbnb investment in Kangaroo Valley, optimizing your existing vacation rental, or exploring rental arbitrage opportunities, understanding the Kangaroo Valley Airbnb data is crucial. Navigating the high regulation landscape is key to maximizing your short term rental income potential. Let's dive into the specifics.
Key Kangaroo Valley Airbnb Performance Metrics Overview
Monthly Airbnb Revenue Variations & Income Potential in Kangaroo Valley (2025)
Understanding the monthly revenue variations for Airbnb listings in Kangaroo Valley is key to maximizing your short term rental income potential. Seasonality significantly impacts earnings. Our analysis, based on data from the past 12 months, shows that the peak revenue month for STRs in Kangaroo Valley is typically December, while February often presents the lowest earnings, highlighting opportunities for strategic pricing adjustments during shoulder and low seasons. Explore the typical Airbnb income in Kangaroo Valley across different performance tiers:
- Best-in-class properties (Top 10%) achieve $10,332+ monthly, often utilizing dynamic pricing and superior guest experiences.
- Strong performing properties (Top 25%) earn $5,611 or more, indicating effective management and desirable locations/amenities.
- Typical properties (Median) generate around $3,231 per month, representing the average market performance.
- Entry-level properties (Bottom 25%) see earnings around $1,792, often with potential for optimization.
Average Monthly Airbnb Earnings Trend in Kangaroo Valley
Kangaroo Valley Airbnb Occupancy Rate Trends (2025)
Maximize your bookings by understanding the Kangaroo Valley STR occupancy trends. Seasonal demand shifts significantly influence how often properties are booked. Typically, Januarysees the highest demand (peak season occupancy), while February experiences the lowest (low season). Effective strategies, like adjusting minimum stays or offering promotions, can boost occupancy during slower periods. Here's how different property tiers perform in Kangaroo Valley:
- Best-in-class properties (Top 10%) achieve 77%+ occupancy, indicating high desirability and potentially optimized availability.
- Strong performing properties (Top 25%) maintain 59% or higher occupancy, suggesting good market fit and guest satisfaction.
- Typical properties (Median) have an occupancy rate around 39%.
- Entry-level properties (Bottom 25%) average 22% occupancy, potentially facing higher vacancy.
Average Monthly Occupancy Rate Trend in Kangaroo Valley
Average Daily Rate (ADR) Airbnb Trends in Kangaroo Valley (2025)
Effective short term rental pricing strategy in Kangaroo Valley involves understanding monthly ADR fluctuations. The Average Daily Rate (ADR) for Airbnb in Kangaroo Valley typically peaks in December and dips lowest during March. Leveraging Airbnb dynamic pricing tools or strategies based on this seasonality can significantly boost revenue. Here's a look at the typical nightly rates achieved:
- Best-in-class properties (Top 10%) command rates of $815+ per night, often due to premium features or locations.
- Strong performing properties (Top 25%) achieve nightly rates of $463 or more.
- Typical properties (Median) charge around $280 per night.
- Entry-level properties (Bottom 25%) earn around $178 per night.
Average Daily Rate (ADR) Trend by Month in Kangaroo Valley
Get Live Kangaroo Valley Market Intelligence 👇

Explore Real-time Analytics
Airbnb Seasonality Analysis & Trends in Kangaroo Valley (2025)
Peak Season (December, January, April)
- Revenue averages $5,777 per month
- Occupancy rates average 47.8%
- Daily rates average $402
Shoulder Season
- Revenue averages $4,857 per month
- Occupancy maintains around 41.2%
- Daily rates hold near $393
Low Season (February, March, September)
- Revenue drops to average $3,753 per month
- Occupancy decreases to average 37.2%
- Daily rates adjust to average $386
Seasonality Insights for Kangaroo Valley
- The Airbnb seasonality in Kangaroo Valley shows moderate seasonality with distinct peak and low periods. While the sections above show seasonal averages, it's also insightful to look at the extremes:
- During the high season, the absolute peak month showcases Kangaroo Valley's highest earning potential, with monthly revenues capable of climbing to $6,255, occupancy reaching a high of 48.5%, and ADRs peaking at $406.
- Conversely, the slowest single month of the year, typically falling within the low season, marks the market's lowest point. In this month, revenue might dip to $3,216, occupancy could drop to 35.0%, and ADRs may adjust down to $383.
- Understanding both the seasonal averages and these monthly peaks and troughs in revenue, occupancy, and ADR is crucial for maximizing your Airbnb profit potential in Kangaroo Valley.
Seasonal Strategies for Maximizing Profit
- Peak Season: Maximize revenue through premium pricing and potentially longer minimum stays. Ensure high availability.
- Low Season: Offer competitive pricing, special promotions (e.g., extended stay discounts), and flexible cancellation policies. Target off-season travelers like remote workers or budget-conscious guests.
- Shoulder Seasons: Implement dynamic pricing that balances peak and low rates. Target weekend travelers or specific events. Offer slightly more flexible terms than peak season.
- Regularly analyze your own performance against these Kangaroo Valley seasonality benchmarks and adjust your pricing and availability strategy accordingly.
Best Areas for Airbnb Investment in Kangaroo Valley (2025)
Exploring the top neighborhoods for short-term rentals in Kangaroo Valley? This section highlights key areas, outlining why they are attractive for hosts and guests, along with notable local attractions. Consider these locations based on your target guest profile and investment strategy.
| Neighborhood / Area | Why Host Here? (Target Guests & Appeal) | Key Attractions & Landmarks |
|---|---|---|
| Kangaroo Valley Village | The heart of Kangaroo Valley with charming shops, cafes, and a vibrant community atmosphere. Ideal for tourists looking for a serene getaway with access to local attractions. | Kangaroo Valley Heritage Museum, Kangaroo River, Kangaroo Valley Golf Club, Local markets, Dining at the Village Green, Walking trails |
| Barrengarry | Known for its lush landscapes and accommodation options, Barrengarry offers scenic views and is close to many national parks, making it ideal for nature lovers and families. | Kangaroo Valley Skywalk, Bendeela Reserve, Giant Tree, Kangaroo Valley Weir, Wollumbin National Park, Exploring local farms |
| Tallowa Dam | A popular spot for fishing and water activities, Tallowa Dam provides a peaceful retreat with beautiful views, attracting visitors looking for outdoor adventures. | Tallowa Dam, Fishing spots, Walking tracks, Paddle boarding, Camping areas, Nature reserves |
| Kangaroo Valley Bush Retreat | This area is perfect for those seeking a true bush experience, with accommodation options nestled in nature. Draws in guests looking for tranquility and nature activities. | Bush walks, Wildlife viewing, Star gazing, Picnic areas, Local wildlife attractions, Scenic views |
| Jasper's Brush | A scenic area featuring stunning landscapes and well-appointed accommodations, attracting visitors looking for relaxation and picturesque settings. | Breathtaking views, Nature trails, Art galleries, Picnic spots, Photography locations, Local wineries |
| Coolangatta Estate | A historic estate offering unique accommodations, wine tasting, and fine dining, ideal for guests looking for a mix of culture and leisure. | Coolangatta Estate Winery, Heritage tours, Dining experiences, Wine tasting, Garden walks, Local markets |
| Beuatiful Kangaroo Valley Escape | This unique getaway offers a range of accommodations and activities surrounded by stunning nature, perfect for travelers seeking adventure and relaxation. | Kayaking on the river, Nature hikes, Local berries picking, Bird watching, Scenic drives, Cultural experiences |
| Misty Mountains | Known for its breathtaking views and luxurious accommodations, Misty Mountains attracts visitors looking for a high-end retreat in a gorgeous natural setting. | Scenic lookout, Spa retreats, Hiking trails, Wildlife experiences, Photography spots, Calm retreat spaces |
Understanding Airbnb License Requirements & STR Laws in Kangaroo Valley (2025)
Yes, Kangaroo Valley, New South Wales, Australia enforces high STR regulations. Obtaining a license and ensuring compliance is almost certainly required according to current 2025 STR laws. Always verify the latest short term rental regulations and Airbnb license requirements directly with local government authorities for Kangaroo Valley to ensure full compliance before hosting.
(Source: AirROI data, 2025, based on 92% licensed listings)
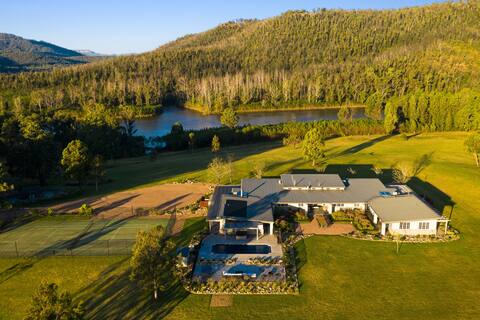
Top Performing Airbnb Properties in Kangaroo Valley (2025)
Benchmark your potential! Explore examples of top-performing Airbnb properties in Kangaroo Valleybased on Trailing Twelve Month (TTM) revenue. Analyze their characteristics, revenue, occupancy rate, and ADR to understand what drives success in this market.

'THE CASA' - Inspiring Kangaroo Valley Retreat
Entire Place • 6 bedrooms
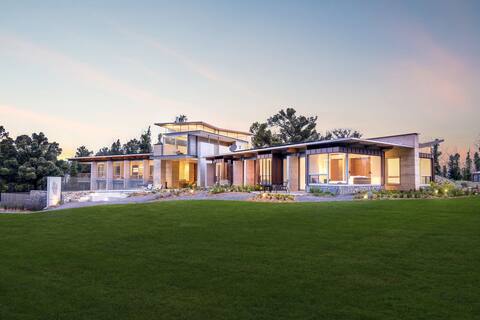
Lake David Luxury Lakehouse
Entire Place • 8 bedrooms
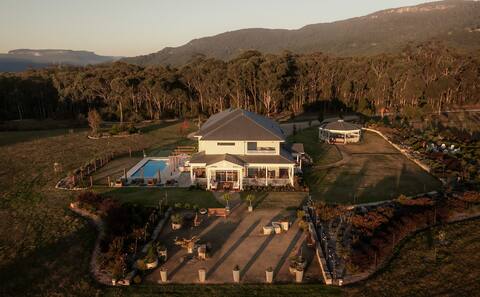
Robinson's Run - The ultimate luxury country retreat
Entire Place • 6 bedrooms
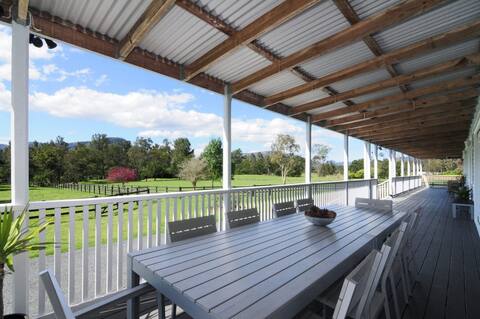
'Saddle Ridge' - Kangaroo Valley
Entire Place • 5 bedrooms
Rivermist - Luxury 6 bedrooms & 6 bathrooms!
Entire Place • 6 bedrooms
Braeside, Kangaroo Valley
Entire Place • 4 bedrooms
Note: Performance varies based on location, size, amenities, seasonality, and management quality. Data reflects the past 12 months.
Top Performing Airbnb Hosts in Kangaroo Valley (2025)
Learn from the best! This table showcases top-performing Airbnb hosts in Kangaroo Valley based on the number of properties managed and estimated total revenue over the past year. Analyze their scale and performance metrics.
| Host Name | Properties | Grossing Revenue | Stay Reviews | Avg Rating |
|---|---|---|---|---|
| Kangaroo Valley Getaways | 31 | $1,370,760 | 736 | 4.23/5.0 |
| Kangaroo Valley Escapes | 14 | $967,665 | 418 | 4.86/5.0 |
| Rob & Bede | 2 | $495,400 | 11 | 5.00/5.0 |
| Nicholas | 1 | $283,579 | 4 | 5.00/5.0 |
| Lisa | 2 | $153,098 | 173 | 2.45/5.0 |
| James | 2 | $139,845 | 106 | 4.92/5.0 |
| Getawayz | 2 | $134,601 | 816 | 4.85/5.0 |
| Dalys | 2 | $114,807 | 636 | 4.98/5.0 |
| Host #43055829 | 1 | $113,159 | 92 | 4.97/5.0 |
| Andrew | 2 | $102,973 | 442 | 5.00/5.0 |
Analyzing the strategies of top hosts, such as their property selection, pricing, and guest communication, can offer valuable lessons for optimizing your own Airbnb operations in Kangaroo Valley.
Dive Deeper: Advanced Kangaroo Valley STR Market Data (2025)
Ready to unlock more insights? AirROI provides access to advanced metrics and comprehensive Airbnb data for Kangaroo Valley. Explore detailed analytics beyond this report to refine your investment strategy, optimize pricing, and maximize your vacation rental profits.
Explore Advanced MetricsKangaroo Valley Short-Term Rental Market Composition (2025): Property & Room Types
Room Type Distribution
Property Type Distribution
Market Composition Insights for Kangaroo Valley
- The Kangaroo Valley Airbnb market composition is heavily skewed towards Entire Home/Apt listings, which make up 99.2% of the 130 active rentals. This indicates strong guest preference for privacy and space.
- Looking at the property type distribution in Kangaroo Valley, House properties are the most common (76.2%), reflecting the local real estate landscape.
- Houses represent a significant 76.2% portion, catering likely to families or larger groups.
- Smaller segments like apartment/condo, hotel/boutique, others (combined 8.4%) offer potential for unique stay experiences.
Kangaroo Valley Airbnb Room Capacity Analysis (2025): Bedroom Distribution
Distribution of Listings by Number of Bedrooms
Room Capacity Insights for Kangaroo Valley
- The dominant room capacity in Kangaroo Valley is 1 bedroom listings, making up 31.5% of the market. This suggests a strong demand for properties suitable for couples or solo travelers.
- Together, 1 bedroom and 3 bedrooms properties represent 53.0% of the active Airbnb listings in Kangaroo Valley, indicating a high concentration in these sizes.
- A significant 43.0% of listings offer 3+ bedrooms, catering to larger groups and families seeking more space in Kangaroo Valley.
Kangaroo Valley Vacation Rental Guest Capacity Trends (2025)
Distribution of Listings by Guest Capacity
Guest Capacity Insights for Kangaroo Valley
- The most common guest capacity trend in Kangaroo Valley vacation rentals is listings accommodating 2 guests (30%). This suggests the primary traveler segment is likely couples or solo travelers.
- Properties designed for 2 guests and 8+ guests dominate the Kangaroo Valley STR market, accounting for 53.1% of listings.
- 47.0% of properties accommodate 6+ guests, serving the market segment for larger families or group travel in Kangaroo Valley.
- On average, properties in Kangaroo Valley are equipped to host 4.8 guests.
Kangaroo Valley Airbnb Booking Patterns (2025): Available vs. Booked Days
Available Days Distribution
Booked Days Distribution
Booking Pattern Insights for Kangaroo Valley
- The most common availability pattern in Kangaroo Valley falls within the 181-270 days range, representing 38.5% of listings. This suggests many properties have significant open periods on their calendars.
- Approximately 73.9% of listings show high availability (181+ days open annually), indicating potential for increased bookings or specific owner usage patterns.
- For booked days, the 91-180 days range is most frequent in Kangaroo Valley (37.7%), reflecting common guest stay durations or potential owner blocking patterns.
- A notable 28.5% of properties secure long booking periods (181+ days booked per year), highlighting successful long-term rental strategies or significant owner usage.
Kangaroo Valley Airbnb Minimum Stay Requirements Analysis
Distribution of Listings by Minimum Night Requirement
1 Night
8 listings
6.3% of total
2 Nights
69 listings
54.8% of total
3 Nights
1 listings
0.8% of total
4-6 Nights
1 listings
0.8% of total
7-29 Nights
1 listings
0.8% of total
30+ Nights
46 listings
36.5% of total
Key Insights
- The most prevalent minimum stay requirement in Kangaroo Valley is 2 Nights, adopted by 54.8% of listings. This highlights the market's preference for shorter, flexible bookings.
- A strong majority (61.1%) of the Kangaroo Valley Airbnb data shows acceptance of very short stays (1-2 nights), indicating a dynamic, high-turnover market.
- A significant segment (36.5%) caters to monthly stays (30+ nights) in Kangaroo Valley, pointing to opportunities in the extended-stay market.
Recommendations
- Align with the market by considering a 2 Nights minimum stay, as 54.8% of Kangaroo Valley hosts use this setting.
- If feasible, allowing 1-night stays, especially midweek or during low season, could capture last-minute bookings, as only 6.3% currently do.
- A 2-night minimum appears standard (54.8%). Consider this for weekends or peak periods.
- Explore offering discounts for stays of 30+ nights to attract the 36.5% of the market seeking extended stays.
- Adjust minimum nights based on seasonality – potentially shorter during low season and longer during peak demand periods in Kangaroo Valley.
Kangaroo Valley Airbnb Cancellation Policy Trends Analysis (2025)
Super Strict 60 Days
28 listings
22.4% of total
Super Strict 30 Days
3 listings
2.4% of total
Flexible
5 listings
4% of total
Moderate
24 listings
19.2% of total
Firm
21 listings
16.8% of total
Strict
44 listings
35.2% of total
Cancellation Policy Insights for Kangaroo Valley
- The prevailing Airbnb cancellation policy trend in Kangaroo Valley is Strict, used by 35.2% of listings.
- A majority (52.0%) of hosts in Kangaroo Valley utilize Firm or Strict policies, indicating a market where hosts prioritize booking security.
Recommendations for Hosts
- Consider adopting a Strict policy to align with the 35.2% market standard in Kangaroo Valley.
- With 35.2% using Strict terms, this is a viable option in Kangaroo Valley, particularly for high-value properties or during peak demand periods.
- Regularly review your cancellation policy against competitors and market demand shifts in Kangaroo Valley.
Kangaroo Valley STR Booking Lead Time Analysis (2025)
Average Booking Lead Time by Month
Booking Lead Time Insights for Kangaroo Valley
- The overall average booking lead time for vacation rentals in Kangaroo Valley is 56 days.
- Guests book furthest in advance for stays during October (average 75 days), likely coinciding with peak travel demand or local events.
- The shortest booking windows occur for stays in August (average 41 days), indicating more last-minute travel plans during this time.
- Seasonally, Fall (67 days avg.) sees the longest lead times, while Summer (48 days avg.) has the shortest, reflecting typical travel planning cycles.
Recommendations for Hosts
- Use the overall average lead time (56 days) as a baseline for your pricing and availability strategy in Kangaroo Valley.
- For October stays, consider implementing length-of-stay discounts or slightly higher rates for bookings made less than 75 days out to capitalize on advance planning.
- Target marketing efforts for the Fall season well in advance (at least 67 days) to capture early planners.
- Monitor your own booking lead times against these Kangaroo Valley averages to identify opportunities for dynamic pricing adjustments.
Popular & Essential Airbnb Amenities in Kangaroo Valley (2025)
Amenity Prevalence
Amenity Insights for Kangaroo Valley
- Popular amenities like Kitchen, Dishes and silverware, Refrigerator are common but not universal. Offering these can provide a competitive edge.
Recommendations for Hosts
- Consider adding popular differentiators like Kitchen or Dishes and silverware to increase appeal.
- Highlight unique or less common amenities you offer (e.g., hot tub, dedicated workspace, EV charger) in your listing description and photos.
- Regularly check competitor amenities in Kangaroo Valley to stay competitive.
Kangaroo Valley Airbnb Guest Demographics & Profile Analysis (2025)
Guest Profile Summary for Kangaroo Valley
- The typical guest profile for Airbnb in Kangaroo Valley consists of primarily domestic travelers (92%), often arriving from nearby Sydney, typically belonging to the Post-2000s (Gen Z/Alpha) group (50%), primarily speaking English or Spanish.
- Domestic travelers account for 91.8% of guests.
- Key international markets include Australia (91.8%) and United Kingdom (2.7%).
- Top languages spoken are English (68.7%) followed by Spanish (5.5%).
- A significant demographic segment is the Post-2000s (Gen Z/Alpha) group, representing 50% of guests.
Recommendations for Hosts
- Target domestic marketing efforts towards travelers from Sydney and New South Wales.
- Tailor amenities and listing descriptions to appeal to the dominant Post-2000s (Gen Z/Alpha) demographic (e.g., highlight fast WiFi, smart home features, local guides).
- Highlight unique local experiences or amenities relevant to the primary guest profile.
- Consider seasonal promotions aligned with peak travel times for key origin markets.
Nearby Short-Term Rental Market Comparison
How does the Kangaroo Valley Airbnb market stack up against its neighbors? Compare key performance metrics like average monthly revenue, ADR, and occupancy rates in surrounding areas to understand the broader regional STR landscape.
| Market | Active Properties | Monthly Revenue | Daily Rate | Avg. Occupancy |
|---|---|---|---|---|
| Penrose | 12 | $6,349 | $600.00 | 42% |
| Berry | 115 | $6,185 | $540.04 | 41% |
| Jaspers Brush | 13 | $5,600 | $510.06 | 37% |
| Burrawang | 11 | $5,005 | $523.75 | 43% |
| Berrima | 44 | $4,756 | $426.34 | 42% |
| Braidwood | 20 | $4,708 | $443.62 | 40% |
| Robertson | 44 | $4,655 | $375.71 | 40% |
| Dora Creek | 17 | $4,613 | $370.02 | 45% |
| Bombo | 10 | $4,613 | $503.00 | 39% |
| Exeter | 30 | $4,595 | $519.08 | 38% |