Goulburn Airbnb Market Analysis 2025: Short Term Rental Data & Vacation Rental Statistics in New South Wales, Australia
Is Airbnb profitable in Goulburn in 2025? Explore comprehensive Airbnb analytics for Goulburn, New South Wales, Australia to uncover income potential. This 2025 STR market report for Goulburn, based on AirROI data from April 2024 to March 2025, reveals key trends in the niche market of 45 active listings.
Whether you're considering an Airbnb investment in Goulburn, optimizing your existing vacation rental, or exploring rental arbitrage opportunities, understanding the Goulburn Airbnb data is crucial. Navigating the high regulation landscape is key to maximizing your short term rental income potential. Let's dive into the specifics.
Key Goulburn Airbnb Performance Metrics Overview
Monthly Airbnb Revenue Variations & Income Potential in Goulburn (2025)
Understanding the monthly revenue variations for Airbnb listings in Goulburn is key to maximizing your short term rental income potential. Seasonality significantly impacts earnings. Our analysis, based on data from the past 12 months, shows that the peak revenue month for STRs in Goulburn is typically January, while September often presents the lowest earnings, highlighting opportunities for strategic pricing adjustments during shoulder and low seasons. Explore the typical Airbnb income in Goulburn across different performance tiers:
- Best-in-class properties (Top 10%) achieve $4,220+ monthly, often utilizing dynamic pricing and superior guest experiences.
- Strong performing properties (Top 25%) earn $2,991 or more, indicating effective management and desirable locations/amenities.
- Typical properties (Median) generate around $1,845 per month, representing the average market performance.
- Entry-level properties (Bottom 25%) see earnings around $967, often with potential for optimization.
Average Monthly Airbnb Earnings Trend in Goulburn
Goulburn Airbnb Occupancy Rate Trends (2025)
Maximize your bookings by understanding the Goulburn STR occupancy trends. Seasonal demand shifts significantly influence how often properties are booked. Typically, Octobersees the highest demand (peak season occupancy), while May experiences the lowest (low season). Effective strategies, like adjusting minimum stays or offering promotions, can boost occupancy during slower periods. Here's how different property tiers perform in Goulburn:
- Best-in-class properties (Top 10%) achieve 84%+ occupancy, indicating high desirability and potentially optimized availability.
- Strong performing properties (Top 25%) maintain 67% or higher occupancy, suggesting good market fit and guest satisfaction.
- Typical properties (Median) have an occupancy rate around 43%.
- Entry-level properties (Bottom 25%) average 23% occupancy, potentially facing higher vacancy.
Average Monthly Occupancy Rate Trend in Goulburn
Average Daily Rate (ADR) Airbnb Trends in Goulburn (2025)
Effective short term rental pricing strategy in Goulburn involves understanding monthly ADR fluctuations. The Average Daily Rate (ADR) for Airbnb in Goulburn typically peaks in November and dips lowest during April. Leveraging Airbnb dynamic pricing tools or strategies based on this seasonality can significantly boost revenue. Here's a look at the typical nightly rates achieved:
- Best-in-class properties (Top 10%) command rates of $255+ per night, often due to premium features or locations.
- Strong performing properties (Top 25%) achieve nightly rates of $155 or more.
- Typical properties (Median) charge around $120 per night.
- Entry-level properties (Bottom 25%) earn around $91 per night.
Average Daily Rate (ADR) Trend by Month in Goulburn
Get Live Goulburn Market Intelligence 👇

Explore Real-time Analytics
Airbnb Seasonality Analysis & Trends in Goulburn (2025)
Peak Season (January, April, October)
- Revenue averages $2,620 per month
- Occupancy rates average 51.0%
- Daily rates average $161
Shoulder Season
- Revenue averages $2,196 per month
- Occupancy maintains around 45.9%
- Daily rates hold near $163
Low Season (May, September, November)
- Revenue drops to average $2,008 per month
- Occupancy decreases to average 38.0%
- Daily rates adjust to average $162
Seasonality Insights for Goulburn
- The Airbnb seasonality in Goulburn shows moderate seasonality with distinct peak and low periods. While the sections above show seasonal averages, it's also insightful to look at the extremes:
- During the high season, the absolute peak month showcases Goulburn's highest earning potential, with monthly revenues capable of climbing to $2,730, occupancy reaching a high of 54.4%, and ADRs peaking at $175.
- Conversely, the slowest single month of the year, typically falling within the low season, marks the market's lowest point. In this month, revenue might dip to $1,932, occupancy could drop to 33.3%, and ADRs may adjust down to $155.
- Understanding both the seasonal averages and these monthly peaks and troughs in revenue, occupancy, and ADR is crucial for maximizing your Airbnb profit potential in Goulburn.
Seasonal Strategies for Maximizing Profit
- Peak Season: Maximize revenue through premium pricing and potentially longer minimum stays. Ensure high availability.
- Low Season: Offer competitive pricing, special promotions (e.g., extended stay discounts), and flexible cancellation policies. Target off-season travelers like remote workers or budget-conscious guests.
- Shoulder Seasons: Implement dynamic pricing that balances peak and low rates. Target weekend travelers or specific events. Offer slightly more flexible terms than peak season.
- Regularly analyze your own performance against these Goulburn seasonality benchmarks and adjust your pricing and availability strategy accordingly.
Best Areas for Airbnb Investment in Goulburn (2025)
Exploring the top neighborhoods for short-term rentals in Goulburn? This section highlights key areas, outlining why they are attractive for hosts and guests, along with notable local attractions. Consider these locations based on your target guest profile and investment strategy.
| Neighborhood / Area | Why Host Here? (Target Guests & Appeal) | Key Attractions & Landmarks |
|---|---|---|
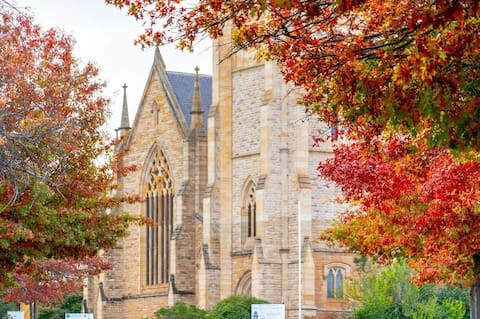
| Goulburn CBD | The central business district of Goulburn offers a mix of historical attractions and contemporary conveniences. It attracts tourists looking for historical experiences, dining, and shopping. | Goulburn Historic Water Tower, St. Saviour’s Cathedral, Goulburn Railway Station, Belmore Park, Goulburn Carriage & Pioneer Museum |
| Goulburn Mulwaree Regional Park | This area provides beautiful natural landscapes and opportunities for outdoor activities. It's perfect for nature lovers and adventure seekers looking for a relaxing getaway. | Goulburn Mulwaree Regional Park, Murray River, bushwalking trails, picnic areas, wildlife spotting |
| Lake Bathurst | A picturesque location known for fishing and water sports. Ideal for families and those looking for a tranquil retreat by the water. | Lake Bathurst, fishing, picnicking, water activities, wildlife observation |
| Goulburn Waterworks | A popular historical tourist attraction that draws visitors interested in heritage and education, offering a unique experience on water management history. | Goulburn Waterworks, water slides, playgrounds, education tours, heritage exhibits |
| Mullion Creek | A scenic rural area near Goulburn, perfect for those seeking a country experience with farm stays and rural attractions. | rural landscapes, farm activities, nature walks, local produce, scenic drives |
| Bungonia National Park | Known for its stunning landscapes, caves, and outdoor activities, it's a must-visit for adventure seekers and nature enthusiasts. | Bungonia Caves, hiking trails, beautiful scenery, camping areas, wildlife observation |
| Tarago | A charming small town nearby that offers a country experience and is a base for exploring the surrounding region. | local shops, cafes, historic sites, scenic countryside, vintage markets |
| Canberra Day Trips | Goulburn's proximity to Canberra makes it a great base for those looking to visit the capital while enjoying a quieter, laid-back atmosphere. | Canberra attractions, Australian War Memorial, Parliament House, National Gallery, Lake Burley Griffin |
Understanding Airbnb License Requirements & STR Laws in Goulburn (2025)
Yes, Goulburn, New South Wales, Australia enforces high STR regulations. Obtaining a license and ensuring compliance is almost certainly required according to current 2025 STR laws. Always verify the latest short term rental regulations and Airbnb license requirements directly with local government authorities for Goulburn to ensure full compliance before hosting.
(Source: AirROI data, 2025, based on 91% licensed listings)
Top Performing Airbnb Properties in Goulburn (2025)
Benchmark your potential! Explore examples of top-performing Airbnb properties in Goulburnbased on Trailing Twelve Month (TTM) revenue. Analyze their characteristics, revenue, occupancy rate, and ADR to understand what drives success in this market.
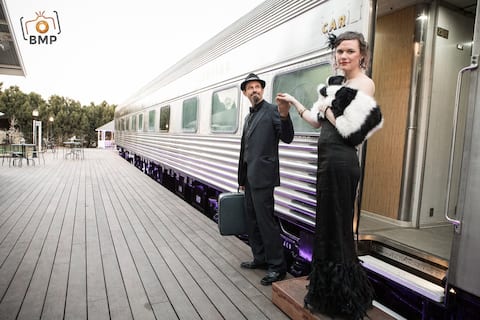
The Historic Railway Barracks
Private Room • 15 bedrooms

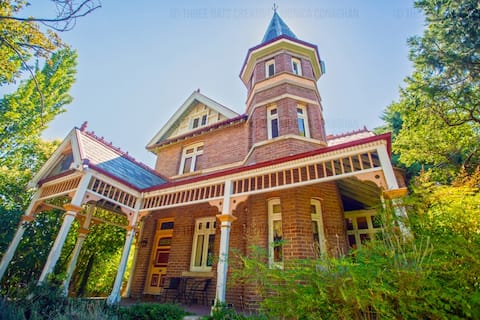
"Clonsilla" Boutique Style Accommodation
Entire Place • 4 bedrooms
‘Toriana’ Boutique Accommodation on Church Street
Entire Place • 4 bedrooms
Wilmslow House
Entire Place • 5 bedrooms
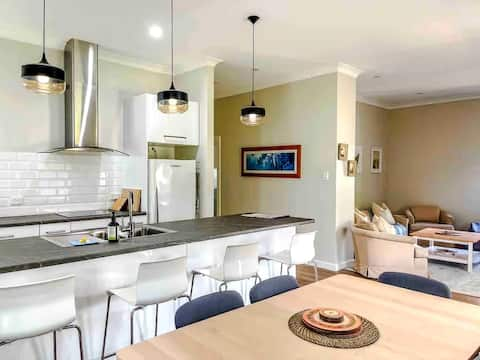
Quiet, convenient, spacious comfort in Goulburn
Entire Place • 3 bedrooms
Wattledale Goulburn Settlers Cottage | Old but New
Entire Place • 3 bedrooms
Note: Performance varies based on location, size, amenities, seasonality, and management quality. Data reflects the past 12 months.
Top Performing Airbnb Hosts in Goulburn (2025)
Learn from the best! This table showcases top-performing Airbnb hosts in Goulburn based on the number of properties managed and estimated total revenue over the past year. Analyze their scale and performance metrics.
| Host Name | Properties | Grossing Revenue | Stay Reviews | Avg Rating |
|---|---|---|---|---|
| Mark | 1 | $96,909 | 3 | 5.00/5.0 |
| Vicki | 7 | $87,470 | 484 | 4.66/5.0 |
| Megan | 3 | $67,020 | 305 | 4.82/5.0 |
| Nicola | 1 | $65,931 | 39 | 4.97/5.0 |
| Lauren | 2 | $60,088 | 163 | 4.96/5.0 |
| Kate | 1 | $54,368 | 7 | 4.57/5.0 |
| Daniel | 2 | $48,605 | 612 | 4.65/5.0 |
| Michelle | 3 | $46,287 | 339 | 4.93/5.0 |
| Terri | 1 | $38,854 | 181 | 4.93/5.0 |
| Rachael | 1 | $38,008 | 32 | 4.97/5.0 |
Analyzing the strategies of top hosts, such as their property selection, pricing, and guest communication, can offer valuable lessons for optimizing your own Airbnb operations in Goulburn.
Dive Deeper: Advanced Goulburn STR Market Data (2025)
Ready to unlock more insights? AirROI provides access to advanced metrics and comprehensive Airbnb data for Goulburn. Explore detailed analytics beyond this report to refine your investment strategy, optimize pricing, and maximize your vacation rental profits.
Explore Advanced MetricsGoulburn Short-Term Rental Market Composition (2025): Property & Room Types
Room Type Distribution
Property Type Distribution
Market Composition Insights for Goulburn
- The Goulburn Airbnb market composition is heavily skewed towards Entire Home/Apt listings, which make up 86.7% of the 45 active rentals. This indicates strong guest preference for privacy and space.
- Looking at the property type distribution in Goulburn, House properties are the most common (60%), reflecting the local real estate landscape.
- Houses represent a significant 60% portion, catering likely to families or larger groups.
- The presence of 17.8% Hotel/Boutique listings indicates integration with traditional hospitality.
- Smaller segments like outdoor/unique, unique stays (combined 4.4%) offer potential for unique stay experiences.
Goulburn Airbnb Room Capacity Analysis (2025): Bedroom Distribution
Distribution of Listings by Number of Bedrooms
Room Capacity Insights for Goulburn
- The dominant room capacity in Goulburn is 1 bedroom listings, making up 28.9% of the market. This suggests a strong demand for properties suitable for couples or solo travelers.
- Together, 1 bedroom and 3 bedrooms properties represent 53.3% of the active Airbnb listings in Goulburn, indicating a high concentration in these sizes.
- A significant 46.6% of listings offer 3+ bedrooms, catering to larger groups and families seeking more space in Goulburn.
Goulburn Vacation Rental Guest Capacity Trends (2025)
Distribution of Listings by Guest Capacity
Guest Capacity Insights for Goulburn
- The most common guest capacity trend in Goulburn vacation rentals is listings accommodating 2 guests (28.9%). This suggests the primary traveler segment is likely couples or solo travelers.
- Properties designed for 2 guests and 6 guests dominate the Goulburn STR market, accounting for 48.9% of listings.
- 42.3% of properties accommodate 6+ guests, serving the market segment for larger families or group travel in Goulburn.
- On average, properties in Goulburn are equipped to host 4.4 guests.
Goulburn Airbnb Booking Patterns (2025): Available vs. Booked Days
Available Days Distribution
Booked Days Distribution
Booking Pattern Insights for Goulburn
- The most common availability pattern in Goulburn falls within the 271-366 days range, representing 33.3% of listings. This suggests many properties have significant open periods on their calendars.
- Approximately 60.0% of listings show high availability (181+ days open annually), indicating potential for increased bookings or specific owner usage patterns.
- For booked days, the 181-270 days range is most frequent in Goulburn (33.3%), reflecting common guest stay durations or potential owner blocking patterns.
- A notable 42.2% of properties secure long booking periods (181+ days booked per year), highlighting successful long-term rental strategies or significant owner usage.
Goulburn Airbnb Minimum Stay Requirements Analysis
Distribution of Listings by Minimum Night Requirement
1 Night
17 listings
41.5% of total
2 Nights
19 listings
46.3% of total
3 Nights
1 listings
2.4% of total
30+ Nights
4 listings
9.8% of total
Key Insights
- The most prevalent minimum stay requirement in Goulburn is 2 Nights, adopted by 46.3% of listings. This highlights the market's preference for shorter, flexible bookings.
- A strong majority (87.8%) of the Goulburn Airbnb data shows acceptance of very short stays (1-2 nights), indicating a dynamic, high-turnover market.
Recommendations
- Align with the market by considering a 2 Nights minimum stay, as 46.3% of Goulburn hosts use this setting.
- Explore offering discounts for stays of 30+ nights to attract the 9.8% of the market seeking extended stays.
- Adjust minimum nights based on seasonality – potentially shorter during low season and longer during peak demand periods in Goulburn.
Goulburn Airbnb Cancellation Policy Trends Analysis (2025)
Flexible
19 listings
44.2% of total
Moderate
13 listings
30.2% of total
Firm
6 listings
14% of total
Strict
5 listings
11.6% of total
Cancellation Policy Insights for Goulburn
- The prevailing Airbnb cancellation policy trend in Goulburn is Flexible, used by 44.2% of listings.
- The market strongly favors guest-friendly terms, with 74.4% of listings offering Flexible or Moderate policies. This suggests guests in Goulburn may expect booking flexibility.
Recommendations for Hosts
- Consider adopting a Flexible policy to align with the 44.2% market standard in Goulburn.
- Using a Strict policy might deter some guests, as only 11.6% of listings use it. Evaluate if potential revenue protection outweighs possible lower booking rates.
- Regularly review your cancellation policy against competitors and market demand shifts in Goulburn.
Goulburn STR Booking Lead Time Analysis (2025)
Average Booking Lead Time by Month
Booking Lead Time Insights for Goulburn
- The overall average booking lead time for vacation rentals in Goulburn is 44 days.
- Guests book furthest in advance for stays during June (average 63 days), likely coinciding with peak travel demand or local events.
- The shortest booking windows occur for stays in July (average 26 days), indicating more last-minute travel plans during this time.
- Seasonally, Fall (50 days avg.) sees the longest lead times, while Winter (38 days avg.) has the shortest, reflecting typical travel planning cycles.
Recommendations for Hosts
- Use the overall average lead time (44 days) as a baseline for your pricing and availability strategy in Goulburn.
- For June stays, consider implementing length-of-stay discounts or slightly higher rates for bookings made less than 63 days out to capitalize on advance planning.
- Target marketing efforts for the Fall season well in advance (at least 50 days) to capture early planners.
- Monitor your own booking lead times against these Goulburn averages to identify opportunities for dynamic pricing adjustments.
Popular & Essential Airbnb Amenities in Goulburn (2025)
Amenity Prevalence
Amenity Insights for Goulburn
- Essential amenities in Goulburn that guests expect include: Wifi, Smoke alarm, Heating, TV. Lacking these (any) could significantly impact bookings.
- Popular amenities like Hot water, Refrigerator, Kitchen are common but not universal. Offering these can provide a competitive edge.
Recommendations for Hosts
- Ensure your listing includes all essential amenities for Goulburn: Wifi, Smoke alarm, Heating, TV.
- Prioritize adding missing essentials: Wifi, Smoke alarm, Heating, TV.
- Consider adding popular differentiators like Hot water or Refrigerator to increase appeal.
- Highlight unique or less common amenities you offer (e.g., hot tub, dedicated workspace, EV charger) in your listing description and photos.
- Regularly check competitor amenities in Goulburn to stay competitive.
Goulburn Airbnb Guest Demographics & Profile Analysis (2025)
Guest Profile Summary for Goulburn
- The typical guest profile for Airbnb in Goulburn consists of primarily domestic travelers (96%), often arriving from nearby Sydney, typically belonging to the Post-2000s (Gen Z/Alpha) group (50%), primarily speaking English or Chinese.
- Domestic travelers account for 95.8% of guests.
- Key international markets include Australia (95.8%) and New Zealand (0.9%).
- Top languages spoken are English (75.6%) followed by Chinese (5.4%).
- A significant demographic segment is the Post-2000s (Gen Z/Alpha) group, representing 50% of guests.
Recommendations for Hosts
- Target domestic marketing efforts towards travelers from Sydney and New South Wales.
- Tailor amenities and listing descriptions to appeal to the dominant Post-2000s (Gen Z/Alpha) demographic (e.g., highlight fast WiFi, smart home features, local guides).
- Highlight unique local experiences or amenities relevant to the primary guest profile.
- Consider seasonal promotions aligned with peak travel times for key origin markets.
Nearby Short-Term Rental Market Comparison
How does the Goulburn Airbnb market stack up against its neighbors? Compare key performance metrics like average monthly revenue, ADR, and occupancy rates in surrounding areas to understand the broader regional STR landscape.
| Market | Active Properties | Monthly Revenue | Daily Rate | Avg. Occupancy |
|---|---|---|---|---|
| Penrose | 12 | $6,349 | $600.00 | 42% |
| Berry | 115 | $6,185 | $540.04 | 41% |
| Jaspers Brush | 13 | $5,600 | $510.06 | 37% |
| Burrawang | 11 | $5,005 | $523.75 | 43% |
| Berrima | 44 | $4,756 | $426.34 | 42% |
| Braidwood | 20 | $4,708 | $443.62 | 40% |
| Robertson | 44 | $4,655 | $375.71 | 40% |
| Bombo | 10 | $4,613 | $503.00 | 39% |
| Exeter | 30 | $4,595 | $519.08 | 38% |
| Gerringong | 121 | $4,483 | $486.76 | 37% |