Glen Innes Severn Council Airbnb Market Analysis 2025: Short Term Rental Data & Vacation Rental Statistics in New South Wales, Australia
Is Airbnb profitable in Glen Innes Severn Council in 2025? Explore comprehensive Airbnb analytics for Glen Innes Severn Council, New South Wales, Australia to uncover income potential. This 2025 STR market report for Glen Innes Severn Council, based on AirROI data from April 2024 to March 2025, reveals key trends in the niche market of 19 active listings.
Whether you're considering an Airbnb investment in Glen Innes Severn Council, optimizing your existing vacation rental, or exploring rental arbitrage opportunities, understanding the Glen Innes Severn Council Airbnb data is crucial. Navigating the high regulation landscape is key to maximizing your short term rental income potential. Let's dive into the specifics.
Key Glen Innes Severn Council Airbnb Performance Metrics Overview
Monthly Airbnb Revenue Variations & Income Potential in Glen Innes Severn Council (2025)
Understanding the monthly revenue variations for Airbnb listings in Glen Innes Severn Council is key to maximizing your short term rental income potential. Seasonality significantly impacts earnings. Our analysis, based on data from the past 12 months, shows that the peak revenue month for STRs in Glen Innes Severn Council is typically June, while February often presents the lowest earnings, highlighting opportunities for strategic pricing adjustments during shoulder and low seasons. Explore the typical Airbnb income in Glen Innes Severn Council across different performance tiers:
- Best-in-class properties (Top 10%) achieve $4,216+ monthly, often utilizing dynamic pricing and superior guest experiences.
- Strong performing properties (Top 25%) earn $2,791 or more, indicating effective management and desirable locations/amenities.
- Typical properties (Median) generate around $1,638 per month, representing the average market performance.
- Entry-level properties (Bottom 25%) see earnings around $849, often with potential for optimization.
Average Monthly Airbnb Earnings Trend in Glen Innes Severn Council
Glen Innes Severn Council Airbnb Occupancy Rate Trends (2025)
Maximize your bookings by understanding the Glen Innes Severn Council STR occupancy trends. Seasonal demand shifts significantly influence how often properties are booked. Typically, Decembersees the highest demand (peak season occupancy), while March experiences the lowest (low season). Effective strategies, like adjusting minimum stays or offering promotions, can boost occupancy during slower periods. Here's how different property tiers perform in Glen Innes Severn Council:
- Best-in-class properties (Top 10%) achieve 61%+ occupancy, indicating high desirability and potentially optimized availability.
- Strong performing properties (Top 25%) maintain 42% or higher occupancy, suggesting good market fit and guest satisfaction.
- Typical properties (Median) have an occupancy rate around 22%.
- Entry-level properties (Bottom 25%) average 12% occupancy, potentially facing higher vacancy.
Average Monthly Occupancy Rate Trend in Glen Innes Severn Council
Average Daily Rate (ADR) Airbnb Trends in Glen Innes Severn Council (2025)
Effective short term rental pricing strategy in Glen Innes Severn Council involves understanding monthly ADR fluctuations. The Average Daily Rate (ADR) for Airbnb in Glen Innes Severn Council typically peaks in November and dips lowest during July. Leveraging Airbnb dynamic pricing tools or strategies based on this seasonality can significantly boost revenue. Here's a look at the typical nightly rates achieved:
- Best-in-class properties (Top 10%) command rates of $314+ per night, often due to premium features or locations.
- Strong performing properties (Top 25%) achieve nightly rates of $251 or more.
- Typical properties (Median) charge around $160 per night.
- Entry-level properties (Bottom 25%) earn around $99 per night.
Average Daily Rate (ADR) Trend by Month in Glen Innes Severn Council
Get Live Glen Innes Severn Council Market Intelligence 👇

Explore Real-time Analytics
Airbnb Seasonality Analysis & Trends in Glen Innes Severn Council (2025)
Peak Season (June, July, April)
- Revenue averages $2,581 per month
- Occupancy rates average 33.2%
- Daily rates average $211
Shoulder Season
- Revenue averages $2,089 per month
- Occupancy maintains around 31.1%
- Daily rates hold near $221
Low Season (February, September, November)
- Revenue drops to average $1,595 per month
- Occupancy decreases to average 24.2%
- Daily rates adjust to average $225
Seasonality Insights for Glen Innes Severn Council
- The Airbnb seasonality in Glen Innes Severn Council shows moderate seasonality with distinct peak and low periods. While the sections above show seasonal averages, it's also insightful to look at the extremes:
- During the high season, the absolute peak month showcases Glen Innes Severn Council's highest earning potential, with monthly revenues capable of climbing to $2,863, occupancy reaching a high of 38.2%, and ADRs peaking at $235.
- Conversely, the slowest single month of the year, typically falling within the low season, marks the market's lowest point. In this month, revenue might dip to $1,539, occupancy could drop to 22.9%, and ADRs may adjust down to $210.
- Understanding both the seasonal averages and these monthly peaks and troughs in revenue, occupancy, and ADR is crucial for maximizing your Airbnb profit potential in Glen Innes Severn Council.
Seasonal Strategies for Maximizing Profit
- Peak Season: Maximize revenue through premium pricing and potentially longer minimum stays. Ensure high availability.
- Low Season: Offer competitive pricing, special promotions (e.g., extended stay discounts), and flexible cancellation policies. Target off-season travelers like remote workers or budget-conscious guests.
- Shoulder Seasons: Implement dynamic pricing that balances peak and low rates. Target weekend travelers or specific events. Offer slightly more flexible terms than peak season.
- Regularly analyze your own performance against these Glen Innes Severn Council seasonality benchmarks and adjust your pricing and availability strategy accordingly.
Best Areas for Airbnb Investment in Glen Innes Severn Council (2025)
Exploring the top neighborhoods for short-term rentals in Glen Innes Severn Council? This section highlights key areas, outlining why they are attractive for hosts and guests, along with notable local attractions. Consider these locations based on your target guest profile and investment strategy.
| Neighborhood / Area | Why Host Here? (Target Guests & Appeal) | Key Attractions & Landmarks |
|---|---|---|
| Glen Innes | The main town in the region, Glen Innes features rich history and is a gateway to various natural attractions. It's ideal for travelers looking to explore the surrounding national parks and heritage sites. | Glen Innes Cultural Centre, Standing Stones, Glen Innes Showgrounds, Glen Innes Golf Club, Wearne's Land, Cunningham's Gap |
| Emmaville | A small, charming village known for its mining history and peaceful countryside. Attracts visitors seeking a quiet retreat and a chance to experience rural life in Australia. | Emmaville Gem and Mineral Museum, Historical Gold Mines, Wellingrove Nature Reserve, Boorolong Nature Reserve |
| Deepwater | A friendly rural township located near rivers and woodlands, perfect for fishing and outdoor enthusiasts. It is known for its community events and hospitality. | Deepwater Railway Station, Fishing at the Severn River, Historical Sites, Local Parks |
| Stannthorpe | Though technically across the border in Queensland, it’s very close to Glen Innes and is known for wineries and food experiences. Great for tourists looking to enjoy a food and wine getaway. | Stanthorpe Heritage Museum, Wine Tasting at Local Wineries, Girraween National Park, Storm King Dam |
| Wooloolga | Located slightly outside of Glen Innes, this coastal town offers beautiful beaches and a surf culture. Ideal for beachgoers and those wanting a coastal experience. | Wooloolga Beach, Wooloolga Headland, Local Cafes and Restaurants, Surfing Spots |
| Tenterfield | A historic town known for its colonial buildings and outdoor activities. It attracts visitors looking for both history and nature. | Tenterfield Saddler, Tenterfield Railway Station, Bald Rock National Park, Historic Theatres, Local Markets |
| Ashford | Small rustic town surrounded by agriculture and scenic countryside. Attracts visitors looking for farming experiences and rural tourism. | Ashford Dam, Local Farms, Birdwatching, Bushwalking Trails |
| Rappville | A quiet community offering a rural getaway with a strong sense of history and local culture. Great for relaxation and enjoying country life. | Rappville Historical Society, Local Parks, Scenic Drives |
Understanding Airbnb License Requirements & STR Laws in Glen Innes Severn Council (2025)
Yes, Glen Innes Severn Council, New South Wales, Australia enforces high STR regulations. Obtaining a license and ensuring compliance is almost certainly required according to current 2025 STR laws. Always verify the latest short term rental regulations and Airbnb license requirements directly with local government authorities for Glen Innes Severn Council to ensure full compliance before hosting.
(Source: AirROI data, 2025, based on 89% licensed listings)
Top Performing Airbnb Properties in Glen Innes Severn Council (2025)
Benchmark your potential! Explore examples of top-performing Airbnb properties in Glen Innes Severn Councilbased on Trailing Twelve Month (TTM) revenue. Analyze their characteristics, revenue, occupancy rate, and ADR to understand what drives success in this market.

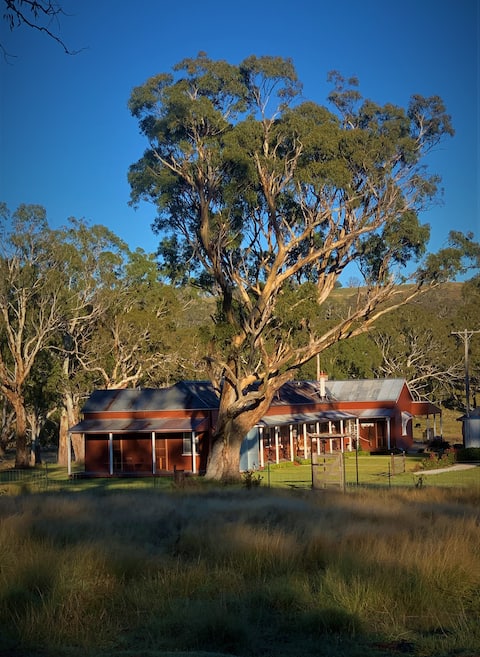
Tui Lodge Modern Eco Friendly Farmstay magic views
Entire Place • 2 bedrooms
Shearers Lodgings
Entire Place • 7 bedrooms
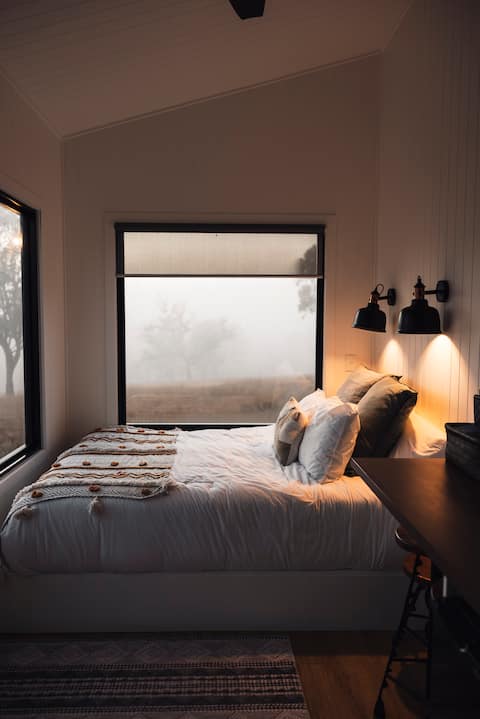
Kingfisher Cabin - AKA Tiny House
Entire Place • N/A

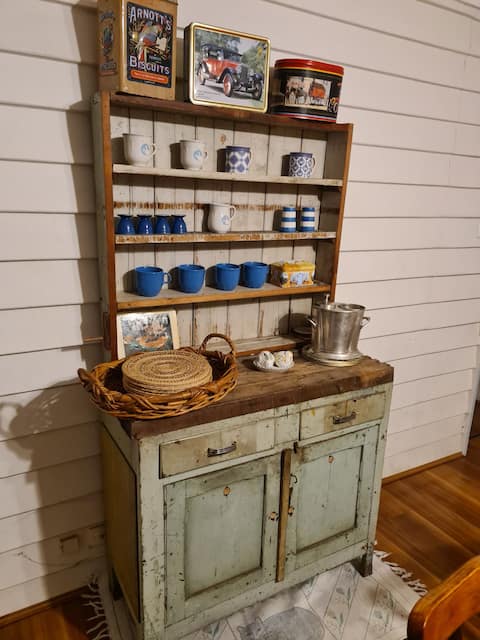
Superb Creek Shack - Off Grid
Entire Place • 1 bedroom
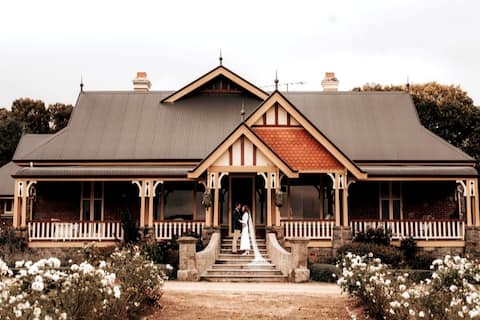
Waterloo Homestead, c. 1903
Entire Place • 6 bedrooms
country cottage
Entire Place • 4 bedrooms
Note: Performance varies based on location, size, amenities, seasonality, and management quality. Data reflects the past 12 months.
Top Performing Airbnb Hosts in Glen Innes Severn Council (2025)
Learn from the best! This table showcases top-performing Airbnb hosts in Glen Innes Severn Council based on the number of properties managed and estimated total revenue over the past year. Analyze their scale and performance metrics.
| Host Name | Properties | Grossing Revenue | Stay Reviews | Avg Rating |
|---|---|---|---|---|
| Deb | 6 | $141,903 | 147 | 4.90/5.0 |
| Diana | 2 | $49,563 | 53 | 4.99/5.0 |
| Sam | 1 | $39,339 | 3 | 5.00/5.0 |
| Host #479035146 | 1 | $27,573 | 1 | 0.00/5.0 |
| Michael | 1 | $22,126 | 38 | 4.89/5.0 |
| Marianna | 1 | $16,713 | 70 | 4.94/5.0 |
| Annabelle&Dave | 1 | $14,592 | 169 | 4.98/5.0 |
| Cathryn | 1 | $6,538 | 52 | 4.96/5.0 |
| Margo | 1 | $4,255 | 28 | 4.57/5.0 |
| Tiny Away | 1 | $3,506 | 7 | 4.86/5.0 |
Analyzing the strategies of top hosts, such as their property selection, pricing, and guest communication, can offer valuable lessons for optimizing your own Airbnb operations in Glen Innes Severn Council.
Dive Deeper: Advanced Glen Innes Severn Council STR Market Data (2025)
Ready to unlock more insights? AirROI provides access to advanced metrics and comprehensive Airbnb data for Glen Innes Severn Council. Explore detailed analytics beyond this report to refine your investment strategy, optimize pricing, and maximize your vacation rental profits.
Explore Advanced MetricsGlen Innes Severn Council Short-Term Rental Market Composition (2025): Property & Room Types
Room Type Distribution
Property Type Distribution
Market Composition Insights for Glen Innes Severn Council
- The Glen Innes Severn Council Airbnb market composition is heavily skewed towards Entire Home/Apt listings, which make up 78.9% of the 19 active rentals. This indicates strong guest preference for privacy and space.
- Looking at the property type distribution in Glen Innes Severn Council, Outdoor/Unique properties are the most common (57.9%), reflecting the local real estate landscape.
- Houses represent a significant 36.8% portion, catering likely to families or larger groups.
Glen Innes Severn Council Airbnb Room Capacity Analysis (2025): Bedroom Distribution
Distribution of Listings by Number of Bedrooms
Room Capacity Insights for Glen Innes Severn Council
- The dominant room capacity in Glen Innes Severn Council is 1 bedroom listings, making up 26.3% of the market. This suggests a strong demand for properties suitable for couples or solo travelers.
- Together, 1 bedroom and 3 bedrooms properties represent 47.4% of the active Airbnb listings in Glen Innes Severn Council, indicating a high concentration in these sizes.
- A significant 42.1% of listings offer 3+ bedrooms, catering to larger groups and families seeking more space in Glen Innes Severn Council.
Glen Innes Severn Council Vacation Rental Guest Capacity Trends (2025)
Distribution of Listings by Guest Capacity
Guest Capacity Insights for Glen Innes Severn Council
- The most common guest capacity trend in Glen Innes Severn Council vacation rentals is listings accommodating 8+ guests (21.1%). This suggests the primary traveler segment is likely larger groups.
- Properties designed for 8+ guests and 2 guests dominate the Glen Innes Severn Council STR market, accounting for 36.9% of listings.
- 36.9% of properties accommodate 6+ guests, serving the market segment for larger families or group travel in Glen Innes Severn Council.
- On average, properties in Glen Innes Severn Council are equipped to host 4.1 guests.
Glen Innes Severn Council Airbnb Booking Patterns (2025): Available vs. Booked Days
Available Days Distribution
Booked Days Distribution
Booking Pattern Insights for Glen Innes Severn Council
- The most common availability pattern in Glen Innes Severn Council falls within the 271-366 days range, representing 73.7% of listings. This suggests many properties have significant open periods on their calendars.
- Approximately 89.5% of listings show high availability (181+ days open annually), indicating potential for increased bookings or specific owner usage patterns.
- For booked days, the 31-90 days range is most frequent in Glen Innes Severn Council (36.8%), reflecting common guest stay durations or potential owner blocking patterns.
- A notable 10.6% of properties secure long booking periods (181+ days booked per year), highlighting successful long-term rental strategies or significant owner usage.
Glen Innes Severn Council Airbnb Minimum Stay Requirements Analysis
Distribution of Listings by Minimum Night Requirement
1 Night
6 listings
33.3% of total
2 Nights
9 listings
50% of total
3 Nights
1 listings
5.6% of total
30+ Nights
2 listings
11.1% of total
Key Insights
- The most prevalent minimum stay requirement in Glen Innes Severn Council is 2 Nights, adopted by 50% of listings. This highlights the market's preference for shorter, flexible bookings.
- A strong majority (83.3%) of the Glen Innes Severn Council Airbnb data shows acceptance of very short stays (1-2 nights), indicating a dynamic, high-turnover market.
- A significant segment (11.1%) caters to monthly stays (30+ nights) in Glen Innes Severn Council, pointing to opportunities in the extended-stay market.
Recommendations
- Align with the market by considering a 2 Nights minimum stay, as 50% of Glen Innes Severn Council hosts use this setting.
- Explore offering discounts for stays of 30+ nights to attract the 11.1% of the market seeking extended stays.
- Adjust minimum nights based on seasonality – potentially shorter during low season and longer during peak demand periods in Glen Innes Severn Council.
Glen Innes Severn Council Airbnb Cancellation Policy Trends Analysis (2025)
Flexible
7 listings
38.9% of total
Moderate
6 listings
33.3% of total
Firm
1 listings
5.6% of total
Strict
4 listings
22.2% of total
Cancellation Policy Insights for Glen Innes Severn Council
- The prevailing Airbnb cancellation policy trend in Glen Innes Severn Council is Flexible, used by 38.9% of listings.
- The market strongly favors guest-friendly terms, with 72.2% of listings offering Flexible or Moderate policies. This suggests guests in Glen Innes Severn Council may expect booking flexibility.
Recommendations for Hosts
- Consider adopting a Flexible policy to align with the 38.9% market standard in Glen Innes Severn Council.
- Regularly review your cancellation policy against competitors and market demand shifts in Glen Innes Severn Council.
Glen Innes Severn Council STR Booking Lead Time Analysis (2025)
Average Booking Lead Time by Month
Booking Lead Time Insights for Glen Innes Severn Council
- The overall average booking lead time for vacation rentals in Glen Innes Severn Council is 72 days.
- Guests book furthest in advance for stays during May (average 136 days), likely coinciding with peak travel demand or local events.
- The shortest booking windows occur for stays in February (average 33 days), indicating more last-minute travel plans during this time.
- Seasonally, Spring (76 days avg.) sees the longest lead times, while Winter (51 days avg.) has the shortest, reflecting typical travel planning cycles.
Recommendations for Hosts
- Use the overall average lead time (72 days) as a baseline for your pricing and availability strategy in Glen Innes Severn Council.
- For May stays, consider implementing length-of-stay discounts or slightly higher rates for bookings made less than 136 days out to capitalize on advance planning.
- Target marketing efforts for the Spring season well in advance (at least 76 days) to capture early planners.
- Monitor your own booking lead times against these Glen Innes Severn Council averages to identify opportunities for dynamic pricing adjustments.
Popular & Essential Airbnb Amenities in Glen Innes Severn Council (2025)
Amenity Prevalence
Amenity Insights for Glen Innes Severn Council
- Essential amenities in Glen Innes Severn Council that guests expect include: Free parking on premises. Lacking these (this) could significantly impact bookings.
- Popular amenities like Hot water, Dishes and silverware, Essentials are common but not universal. Offering these can provide a competitive edge.
Recommendations for Hosts
- Ensure your listing includes all essential amenities for Glen Innes Severn Council: Free parking on premises.
- Consider adding popular differentiators like Hot water or Dishes and silverware to increase appeal.
- Highlight unique or less common amenities you offer (e.g., hot tub, dedicated workspace, EV charger) in your listing description and photos.
- Regularly check competitor amenities in Glen Innes Severn Council to stay competitive.
Glen Innes Severn Council Airbnb Guest Demographics & Profile Analysis (2025)
Guest Profile Summary for Glen Innes Severn Council
- The typical guest profile for Airbnb in Glen Innes Severn Council consists of primarily domestic travelers (96%), often arriving from nearby Brisbane, typically belonging to the Post-2000s (Gen Z/Alpha) group (50%), primarily speaking English or French.
- Domestic travelers account for 96.4% of guests.
- Key international markets include Australia (96.4%) and United States (2.4%).
- Top languages spoken are English (88.5%) followed by French (3.8%).
- A significant demographic segment is the Post-2000s (Gen Z/Alpha) group, representing 50% of guests.
Recommendations for Hosts
- Target domestic marketing efforts towards travelers from Brisbane and Queensland.
- Tailor amenities and listing descriptions to appeal to the dominant Post-2000s (Gen Z/Alpha) demographic (e.g., highlight fast WiFi, smart home features, local guides).
- Highlight unique local experiences or amenities relevant to the primary guest profile.
- Consider seasonal promotions aligned with peak travel times for key origin markets.
Nearby Short-Term Rental Market Comparison
How does the Glen Innes Severn Council Airbnb market stack up against its neighbors? Compare key performance metrics like average monthly revenue, ADR, and occupancy rates in surrounding areas to understand the broader regional STR landscape.
| Market | Active Properties | Monthly Revenue | Daily Rate | Avg. Occupancy |
|---|---|---|---|---|
| Tenterfield Shire Council | 10 | $2,863 | $188.34 | 50% |
| Ballandean | 22 | $2,719 | $288.70 | 34% |
| Gleniffer | 35 | $2,650 | $341.78 | 35% |
| Stanthorpe | 70 | $2,575 | $206.85 | 43% |
| Warwick | 28 | $2,541 | $184.46 | 53% |
| Bellingen Shire Council | 12 | $2,501 | $167.38 | 47% |
| Tenterfield | 42 | $2,382 | $194.65 | 40% |
| Gunnedah | 14 | $2,313 | $162.10 | 53% |
| Southern Downs Regional | 91 | $2,288 | $229.21 | 40% |
| Armidale | 83 | $2,217 | $134.83 | 57% |