Forster Airbnb Market Analysis 2025: Short Term Rental Data & Vacation Rental Statistics in New South Wales, Australia
Is Airbnb profitable in Forster in 2025? Explore comprehensive Airbnb analytics for Forster, New South Wales, Australia to uncover income potential. This 2025 STR market report for Forster, based on AirROI data from April 2024 to March 2025, reveals key trends in the market of 360 active listings.
Whether you're considering an Airbnb investment in Forster, optimizing your existing vacation rental, or exploring rental arbitrage opportunities, understanding the Forster Airbnb data is crucial. Navigating the high regulation landscape is key to maximizing your short term rental income potential. Let's dive into the specifics.
Key Forster Airbnb Performance Metrics Overview
Monthly Airbnb Revenue Variations & Income Potential in Forster (2025)
Understanding the monthly revenue variations for Airbnb listings in Forster is key to maximizing your short term rental income potential. Seasonality significantly impacts earnings. Our analysis, based on data from the past 12 months, shows that the peak revenue month for STRs in Forster is typically January, while August often presents the lowest earnings, highlighting opportunities for strategic pricing adjustments during shoulder and low seasons. Explore the typical Airbnb income in Forster across different performance tiers:
- Best-in-class properties (Top 10%) achieve $6,451+ monthly, often utilizing dynamic pricing and superior guest experiences.
- Strong performing properties (Top 25%) earn $4,020 or more, indicating effective management and desirable locations/amenities.
- Typical properties (Median) generate around $2,198 per month, representing the average market performance.
- Entry-level properties (Bottom 25%) see earnings around $1,128, often with potential for optimization.
Average Monthly Airbnb Earnings Trend in Forster
Forster Airbnb Occupancy Rate Trends (2025)
Maximize your bookings by understanding the Forster STR occupancy trends. Seasonal demand shifts significantly influence how often properties are booked. Typically, Januarysees the highest demand (peak season occupancy), while August experiences the lowest (low season). Effective strategies, like adjusting minimum stays or offering promotions, can boost occupancy during slower periods. Here's how different property tiers perform in Forster:
- Best-in-class properties (Top 10%) achieve 70%+ occupancy, indicating high desirability and potentially optimized availability.
- Strong performing properties (Top 25%) maintain 49% or higher occupancy, suggesting good market fit and guest satisfaction.
- Typical properties (Median) have an occupancy rate around 30%.
- Entry-level properties (Bottom 25%) average 15% occupancy, potentially facing higher vacancy.
Average Monthly Occupancy Rate Trend in Forster
Average Daily Rate (ADR) Airbnb Trends in Forster (2025)
Effective short term rental pricing strategy in Forster involves understanding monthly ADR fluctuations. The Average Daily Rate (ADR) for Airbnb in Forster typically peaks in January and dips lowest during September. Leveraging Airbnb dynamic pricing tools or strategies based on this seasonality can significantly boost revenue. Here's a look at the typical nightly rates achieved:
- Best-in-class properties (Top 10%) command rates of $454+ per night, often due to premium features or locations.
- Strong performing properties (Top 25%) achieve nightly rates of $333 or more.
- Typical properties (Median) charge around $247 per night.
- Entry-level properties (Bottom 25%) earn around $185 per night.
Average Daily Rate (ADR) Trend by Month in Forster
Get Live Forster Market Intelligence 👇

Explore Real-time Analytics
Airbnb Seasonality Analysis & Trends in Forster (2025)
Peak Season (January, December, April)
- Revenue averages $4,446 per month
- Occupancy rates average 42.9%
- Daily rates average $318
Shoulder Season
- Revenue averages $2,689 per month
- Occupancy maintains around 33.4%
- Daily rates hold near $265
Low Season (March, August, September)
- Revenue drops to average $1,993 per month
- Occupancy decreases to average 28.3%
- Daily rates adjust to average $257
Seasonality Insights for Forster
- The Airbnb seasonality in Forster shows highly seasonal trends requiring careful strategy. While the sections above show seasonal averages, it's also insightful to look at the extremes:
- During the high season, the absolute peak month showcases Forster's highest earning potential, with monthly revenues capable of climbing to $5,697, occupancy reaching a high of 51.0%, and ADRs peaking at $372.
- Conversely, the slowest single month of the year, typically falling within the low season, marks the market's lowest point. In this month, revenue might dip to $1,771, occupancy could drop to 27.1%, and ADRs may adjust down to $244.
- Understanding both the seasonal averages and these monthly peaks and troughs in revenue, occupancy, and ADR is crucial for maximizing your Airbnb profit potential in Forster.
Seasonal Strategies for Maximizing Profit
- Peak Season: Maximize revenue through premium pricing and potentially longer minimum stays. Ensure high availability.
- Low Season: Offer competitive pricing, special promotions (e.g., extended stay discounts), and flexible cancellation policies. Target off-season travelers like remote workers or budget-conscious guests.
- Shoulder Seasons: Implement dynamic pricing that balances peak and low rates. Target weekend travelers or specific events. Offer slightly more flexible terms than peak season.
- Regularly analyze your own performance against these Forster seasonality benchmarks and adjust your pricing and availability strategy accordingly.
Best Areas for Airbnb Investment in Forster (2025)
Exploring the top neighborhoods for short-term rentals in Forster? This section highlights key areas, outlining why they are attractive for hosts and guests, along with notable local attractions. Consider these locations based on your target guest profile and investment strategy.
| Neighborhood / Area | Why Host Here? (Target Guests & Appeal) | Key Attractions & Landmarks |
|---|---|---|
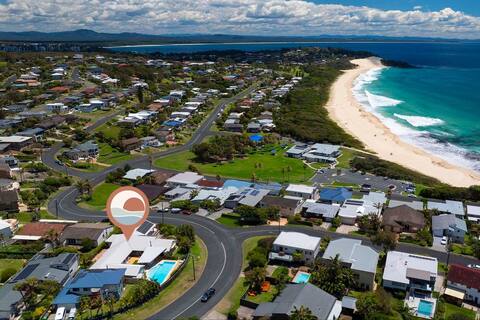
| Forster Main Beach | A popular destination for beach lovers offering golden sands and great surf conditions. Ideal for families and tourists looking for a relaxing beach getaway. | Forster Main Beach, Club Forster, Forster Marina, Dolphin Watch Cruises, Forster Golf Club, Ocean Drive |
| Burgess Beach | A tranquil and picturesque beach perfect for swimming and sunbathing. Attracts those looking for a quieter retreat. | Burgess Beach, Cape Hawke Lookout, Burgess Beach Picnic Area, Wallis Lake, Forster-Tuncurry Golf Club |
| Tuncurry | Adjacent to Forster, offering a blend of scenic views and local charm. Great for visitors wanting to explore both towns. | Tuncurry Rock Pool, Tuncurry Beach, Wallis Lake, Tuncurry Bowling Club, Fisherman's Wharf |
| Elizabeth Beach | A popular spot for surfing and swimming, known for its natural beauty and nearby wildlife. Great destination for outdoor enthusiasts. | Elizabeth Beach, Booti Booti National Park, Surf Life Saving Club, Seven Mile Beach, Wallambah River |
| Cape Hawke | Known for its stunning lookout and hiking trails, attracting nature lovers and adventure seekers. | Cape Hawke Lookout, Booti Booti National Park, Hiking Trails, Wallis Lake, Fishing Spots |
| Green Point | A serene area with stunning views of the lake and direct access to nature trails, attracting those who enjoy outdoor activities. | Green Point Foreshore, Wallis Lake, Bushwalking Tracks, Picnic Areas, Fishing Spots |
| Forster Keys | A unique waterfront location offering access to waterways and a peaceful living environment, ideal for families and retirees. | Forster Keys, Waterfront Parks, Walking Paths, Fishing Areas, Kayaking |
| Wallis Lake | A stunning lake ensuring various water activities, attracting tourists for fishing, boating, and relaxing by the water. | Wallis Lake, Fishing Tours, Kayaking, Boat Hire, Picnic Spots |
Understanding Airbnb License Requirements & STR Laws in Forster (2025)
Yes, Forster, New South Wales, Australia enforces high STR regulations. Obtaining a license and ensuring compliance is almost certainly required according to current 2025 STR laws. Always verify the latest short term rental regulations and Airbnb license requirements directly with local government authorities for Forster to ensure full compliance before hosting.
(Source: AirROI data, 2025, based on 81% licensed listings)
Top Performing Airbnb Properties in Forster (2025)
Benchmark your potential! Explore examples of top-performing Airbnb properties in Forsterbased on Trailing Twelve Month (TTM) revenue. Analyze their characteristics, revenue, occupancy rate, and ADR to understand what drives success in this market.
Resort on Underwood
Entire Place • 6 bedrooms

Home in One Mile Beach Forster
Entire Place • 4 bedrooms

Becker Bliss - 5 bedrooms, ocean views, sleeps 12
Entire Place • 5 bedrooms
12 Cliff Road
Entire Place • 4 bedrooms
Beachfront home, Indulge@Surfriders
Entire Place • 4 bedrooms

Bungayarra
Entire Place • 6 bedrooms
Note: Performance varies based on location, size, amenities, seasonality, and management quality. Data reflects the past 12 months.
Top Performing Airbnb Hosts in Forster (2025)
Learn from the best! This table showcases top-performing Airbnb hosts in Forster based on the number of properties managed and estimated total revenue over the past year. Analyze their scale and performance metrics.
| Host Name | Properties | Grossing Revenue | Stay Reviews | Avg Rating |
|---|---|---|---|---|
| Forster Accommodation | 120 | $2,565,532 | 760 | 3.48/5.0 |
| Forster Holiday Rentals | 56 | $969,461 | 312 | 3.43/5.0 |
| Pacific Coast Holidays | 21 | $539,991 | 94 | 3.13/5.0 |
| Pacific Coast Property | 27 | $466,280 | 336 | 4.05/5.0 |
| Karen | 6 | $256,571 | 263 | 4.96/5.0 |
| Annmaree | 3 | $152,574 | 253 | 4.73/5.0 |
| Bruno | 10 | $149,907 | 1017 | 4.62/5.0 |
| Ann | 2 | $123,064 | 336 | 4.95/5.0 |
| Birte | 1 | $113,314 | 15 | 5.00/5.0 |
| Jo | 3 | $107,776 | 80 | 4.83/5.0 |
Analyzing the strategies of top hosts, such as their property selection, pricing, and guest communication, can offer valuable lessons for optimizing your own Airbnb operations in Forster.
Dive Deeper: Advanced Forster STR Market Data (2025)
Ready to unlock more insights? AirROI provides access to advanced metrics and comprehensive Airbnb data for Forster. Explore detailed analytics beyond this report to refine your investment strategy, optimize pricing, and maximize your vacation rental profits.
Explore Advanced MetricsForster Short-Term Rental Market Composition (2025): Property & Room Types
Room Type Distribution
Property Type Distribution
Market Composition Insights for Forster
- The Forster Airbnb market composition is heavily skewed towards Entire Home/Apt listings, which make up 94.4% of the 360 active rentals. This indicates strong guest preference for privacy and space.
- Looking at the property type distribution in Forster, Apartment/Condo properties are the most common (58.9%), reflecting the local real estate landscape.
- Houses represent a significant 36.4% portion, catering likely to families or larger groups.
- Smaller segments like others, hotel/boutique (combined 4.7%) offer potential for unique stay experiences.
Forster Airbnb Room Capacity Analysis (2025): Bedroom Distribution
Distribution of Listings by Number of Bedrooms
Room Capacity Insights for Forster
- The dominant room capacity in Forster is 2 bedrooms listings, making up 43.3% of the market. This suggests a strong demand for properties suitable for couples or solo travelers.
- Together, 2 bedrooms and 3 bedrooms properties represent 70.8% of the active Airbnb listings in Forster, indicating a high concentration in these sizes.
- A significant 45.3% of listings offer 3+ bedrooms, catering to larger groups and families seeking more space in Forster.
Forster Vacation Rental Guest Capacity Trends (2025)
Distribution of Listings by Guest Capacity
Guest Capacity Insights for Forster
- The most common guest capacity trend in Forster vacation rentals is listings accommodating 4 guests (29.2%). This suggests the primary traveler segment is likely small families or groups.
- Properties designed for 4 guests and 8+ guests dominate the Forster STR market, accounting for 54.2% of listings.
- 51.4% of properties accommodate 6+ guests, serving the market segment for larger families or group travel in Forster.
- On average, properties in Forster are equipped to host 5.4 guests.
Forster Airbnb Booking Patterns (2025): Available vs. Booked Days
Available Days Distribution
Booked Days Distribution
Booking Pattern Insights for Forster
- The most common availability pattern in Forster falls within the 271-366 days range, representing 60.8% of listings. This suggests many properties have significant open periods on their calendars.
- Approximately 85.8% of listings show high availability (181+ days open annually), indicating potential for increased bookings or specific owner usage patterns.
- For booked days, the 31-90 days range is most frequent in Forster (38.9%), reflecting common guest stay durations or potential owner blocking patterns.
- A notable 16.1% of properties secure long booking periods (181+ days booked per year), highlighting successful long-term rental strategies or significant owner usage.
Forster Airbnb Minimum Stay Requirements Analysis
Distribution of Listings by Minimum Night Requirement
1 Night
15 listings
4.3% of total
2 Nights
69 listings
20% of total
3 Nights
108 listings
31.3% of total
4-6 Nights
19 listings
5.5% of total
7-29 Nights
5 listings
1.4% of total
30+ Nights
129 listings
37.4% of total
Key Insights
- The most prevalent minimum stay requirement in Forster is 30+ Nights, adopted by 37.4% of listings. This highlights the market's preference for longer commitments.
- A significant segment (37.4%) caters to monthly stays (30+ nights) in Forster, pointing to opportunities in the extended-stay market.
Recommendations
- Align with the market by considering a 30+ Nights minimum stay, as 37.4% of Forster hosts use this setting.
- If feasible, allowing 1-night stays, especially midweek or during low season, could capture last-minute bookings, as only 4.3% currently do.
- Explore offering discounts for stays of 30+ nights to attract the 37.4% of the market seeking extended stays.
- Adjust minimum nights based on seasonality – potentially shorter during low season and longer during peak demand periods in Forster.
Forster Airbnb Cancellation Policy Trends Analysis (2025)
Super Strict 60 Days
9 listings
2.9% of total
Super Strict 30 Days
78 listings
25.5% of total
Flexible
24 listings
7.8% of total
Moderate
40 listings
13.1% of total
Firm
118 listings
38.6% of total
Strict
37 listings
12.1% of total
Cancellation Policy Insights for Forster
- The prevailing Airbnb cancellation policy trend in Forster is Firm, used by 38.6% of listings.
- A majority (50.7%) of hosts in Forster utilize Firm or Strict policies, indicating a market where hosts prioritize booking security.
Recommendations for Hosts
- Consider adopting a Firm policy to align with the 38.6% market standard in Forster.
- Using a Strict policy might deter some guests, as only 12.1% of listings use it. Evaluate if potential revenue protection outweighs possible lower booking rates.
- Regularly review your cancellation policy against competitors and market demand shifts in Forster.
Forster STR Booking Lead Time Analysis (2025)
Average Booking Lead Time by Month
Booking Lead Time Insights for Forster
- The overall average booking lead time for vacation rentals in Forster is 70 days.
- Guests book furthest in advance for stays during December (average 108 days), likely coinciding with peak travel demand or local events.
- The shortest booking windows occur for stays in August (average 47 days), indicating more last-minute travel plans during this time.
- Seasonally, Winter (93 days avg.) sees the longest lead times, while Summer (49 days avg.) has the shortest, reflecting typical travel planning cycles.
Recommendations for Hosts
- Use the overall average lead time (70 days) as a baseline for your pricing and availability strategy in Forster.
- For December stays, consider implementing length-of-stay discounts or slightly higher rates for bookings made less than 108 days out to capitalize on advance planning.
- Target marketing efforts for the Winter season well in advance (at least 93 days) to capture early planners.
- Monitor your own booking lead times against these Forster averages to identify opportunities for dynamic pricing adjustments.
Popular & Essential Airbnb Amenities in Forster (2025)
Amenity Prevalence
Amenity Insights for Forster
- Essential amenities in Forster that guests expect include: TV, Smoke alarm, Kitchen, Hot water. Lacking these (any) could significantly impact bookings.
- Popular amenities like Refrigerator, Dishes and silverware, Microwave are common but not universal. Offering these can provide a competitive edge.
Recommendations for Hosts
- Ensure your listing includes all essential amenities for Forster: TV, Smoke alarm, Kitchen, Hot water.
- Prioritize adding missing essentials: TV, Smoke alarm, Kitchen, Hot water.
- Consider adding popular differentiators like Refrigerator or Dishes and silverware to increase appeal.
- Highlight unique or less common amenities you offer (e.g., hot tub, dedicated workspace, EV charger) in your listing description and photos.
- Regularly check competitor amenities in Forster to stay competitive.
Forster Airbnb Guest Demographics & Profile Analysis (2025)
Guest Profile Summary for Forster
- The typical guest profile for Airbnb in Forster consists of primarily domestic travelers (94%), often arriving from nearby Sydney, typically belonging to the Post-2000s (Gen Z/Alpha) group (50%), primarily speaking English or Chinese.
- Domestic travelers account for 94.1% of guests.
- Key international markets include Australia (94.1%) and United Kingdom (1.3%).
- Top languages spoken are English (77.2%) followed by Chinese (4.3%).
- A significant demographic segment is the Post-2000s (Gen Z/Alpha) group, representing 50% of guests.
Recommendations for Hosts
- Target domestic marketing efforts towards travelers from Sydney and New South Wales.
- Tailor amenities and listing descriptions to appeal to the dominant Post-2000s (Gen Z/Alpha) demographic (e.g., highlight fast WiFi, smart home features, local guides).
- Highlight unique local experiences or amenities relevant to the primary guest profile.
- Consider seasonal promotions aligned with peak travel times for key origin markets.
Nearby Short-Term Rental Market Comparison
How does the Forster Airbnb market stack up against its neighbors? Compare key performance metrics like average monthly revenue, ADR, and occupancy rates in surrounding areas to understand the broader regional STR landscape.
| Market | Active Properties | Monthly Revenue | Daily Rate | Avg. Occupancy |
|---|---|---|---|---|
| Green Point | 16 | $4,869 | $360.27 | 48% |
| Dora Creek | 17 | $4,613 | $370.02 | 45% |
| Singleton Council | 154 | $4,304 | $517.74 | 32% |
| Nulkaba | 37 | $4,242 | $524.17 | 30% |
| Broke | 58 | $4,084 | $448.99 | 32% |
| Branxton | 17 | $4,019 | $399.77 | 32% |
| Cessnock | 493 | $3,878 | $416.89 | 35% |
| Coomba Park | 31 | $3,858 | $395.11 | 39% |
| Millfield | 29 | $3,809 | $385.13 | 35% |
| Cessnock City Council | 127 | $3,776 | $436.62 | 35% |