Cooma Airbnb Market Analysis 2025: Short Term Rental Data & Vacation Rental Statistics in New South Wales, Australia
Is Airbnb profitable in Cooma in 2025? Explore comprehensive Airbnb analytics for Cooma, New South Wales, Australia to uncover income potential. This 2025 STR market report for Cooma, based on AirROI data from April 2024 to March 2025, reveals key trends in the niche market of 34 active listings.
Whether you're considering an Airbnb investment in Cooma, optimizing your existing vacation rental, or exploring rental arbitrage opportunities, understanding the Cooma Airbnb data is crucial. Navigating the high regulation landscape is key to maximizing your short term rental income potential. Let's dive into the specifics.
Key Cooma Airbnb Performance Metrics Overview
Monthly Airbnb Revenue Variations & Income Potential in Cooma (2025)
Understanding the monthly revenue variations for Airbnb listings in Cooma is key to maximizing your short term rental income potential. Seasonality significantly impacts earnings. Our analysis, based on data from the past 12 months, shows that the peak revenue month for STRs in Cooma is typically July, while March often presents the lowest earnings, highlighting opportunities for strategic pricing adjustments during shoulder and low seasons. Explore the typical Airbnb income in Cooma across different performance tiers:
- Best-in-class properties (Top 10%) achieve $5,150+ monthly, often utilizing dynamic pricing and superior guest experiences.
- Strong performing properties (Top 25%) earn $3,487 or more, indicating effective management and desirable locations/amenities.
- Typical properties (Median) generate around $2,163 per month, representing the average market performance.
- Entry-level properties (Bottom 25%) see earnings around $1,039, often with potential for optimization.
Average Monthly Airbnb Earnings Trend in Cooma
Cooma Airbnb Occupancy Rate Trends (2025)
Maximize your bookings by understanding the Cooma STR occupancy trends. Seasonal demand shifts significantly influence how often properties are booked. Typically, Julysees the highest demand (peak season occupancy), while March experiences the lowest (low season). Effective strategies, like adjusting minimum stays or offering promotions, can boost occupancy during slower periods. Here's how different property tiers perform in Cooma:
- Best-in-class properties (Top 10%) achieve 75%+ occupancy, indicating high desirability and potentially optimized availability.
- Strong performing properties (Top 25%) maintain 62% or higher occupancy, suggesting good market fit and guest satisfaction.
- Typical properties (Median) have an occupancy rate around 46%.
- Entry-level properties (Bottom 25%) average 23% occupancy, potentially facing higher vacancy.
Average Monthly Occupancy Rate Trend in Cooma
Average Daily Rate (ADR) Airbnb Trends in Cooma (2025)
Effective short term rental pricing strategy in Cooma involves understanding monthly ADR fluctuations. The Average Daily Rate (ADR) for Airbnb in Cooma typically peaks in July and dips lowest during March. Leveraging Airbnb dynamic pricing tools or strategies based on this seasonality can significantly boost revenue. Here's a look at the typical nightly rates achieved:
- Best-in-class properties (Top 10%) command rates of $379+ per night, often due to premium features or locations.
- Strong performing properties (Top 25%) achieve nightly rates of $210 or more.
- Typical properties (Median) charge around $145 per night.
- Entry-level properties (Bottom 25%) earn around $105 per night.
Average Daily Rate (ADR) Trend by Month in Cooma
Get Live Cooma Market Intelligence 👇

Explore Real-time Analytics
Airbnb Seasonality Analysis & Trends in Cooma (2025)
Peak Season (July, August, June)
- Revenue averages $3,879 per month
- Occupancy rates average 54.7%
- Daily rates average $215
Shoulder Season
- Revenue averages $2,428 per month
- Occupancy maintains around 41.8%
- Daily rates hold near $188
Low Season (January, February, March)
- Revenue drops to average $1,640 per month
- Occupancy decreases to average 39.0%
- Daily rates adjust to average $156
Seasonality Insights for Cooma
- The Airbnb seasonality in Cooma shows highly seasonal trends requiring careful strategy. While the sections above show seasonal averages, it's also insightful to look at the extremes:
- During the high season, the absolute peak month showcases Cooma's highest earning potential, with monthly revenues capable of climbing to $4,285, occupancy reaching a high of 62.4%, and ADRs peaking at $221.
- Conversely, the slowest single month of the year, typically falling within the low season, marks the market's lowest point. In this month, revenue might dip to $1,585, occupancy could drop to 35.8%, and ADRs may adjust down to $153.
- Understanding both the seasonal averages and these monthly peaks and troughs in revenue, occupancy, and ADR is crucial for maximizing your Airbnb profit potential in Cooma.
Seasonal Strategies for Maximizing Profit
- Peak Season: Maximize revenue through premium pricing and potentially longer minimum stays. Ensure high availability.
- Low Season: Offer competitive pricing, special promotions (e.g., extended stay discounts), and flexible cancellation policies. Target off-season travelers like remote workers or budget-conscious guests.
- Shoulder Seasons: Implement dynamic pricing that balances peak and low rates. Target weekend travelers or specific events. Offer slightly more flexible terms than peak season.
- Regularly analyze your own performance against these Cooma seasonality benchmarks and adjust your pricing and availability strategy accordingly.
Best Areas for Airbnb Investment in Cooma (2025)
Exploring the top neighborhoods for short-term rentals in Cooma? This section highlights key areas, outlining why they are attractive for hosts and guests, along with notable local attractions. Consider these locations based on your target guest profile and investment strategy.
| Neighborhood / Area | Why Host Here? (Target Guests & Appeal) | Key Attractions & Landmarks |
|---|---|---|
| Cooma Town Center | The heart of Cooma, offering access to shops, restaurants, and amenities. Great for tourists looking to explore the region and easy access to ski resorts in winter. | Cooma Visitor Centre, Cooma Monaro Historical Society, Nanny Goat Hill, Cooma Snowy Hydro Discovery Centre |
| Nimmitabel | A quaint rural town with charm, close to nature and hiking trails. Attractive to those seeking a peaceful escape and outdoor adventures. | Nimmitabel Heritage Walk, Hiking trails in nearby areas, Local markets, Historic buildings |
| Berridale | A small village popular among skiers and snowboarders during winter, with proximity to the Snowy Mountains and a growing community of holidaymakers. | Berridale Ski Resort, Thredbo and Perisher nearby, Local cafés and eateries, Fishing in the Snowy River |
| Jindabyne | A popular all-season resort town, ideal for winter sports and summer lake activities, attracting both adventurers and families. | Lake Jindabyne, Kosciuszko National Park, Ski resorts nearby, Snowy Mountains music festival |
| Dalgety | A charming riverside township, perfect for those looking for tranquility and a taste of rural life, near the Snowy River. | Snowy River, Fishing and boating, Historic sites, Local vineyards |
| Adaminaby | Known as the home of the giant trout, this town is popular for fishing and outdoor pursuits, attracting nature lovers and holidaymakers. | Lake Eucumbene, Big Trout, Fishing spots, Snowy Mountains walks |
| Perisher Valley | One of Australia's premier ski destinations, attracting winter athletes and those looking for ski lodge accommodation. | Perisher Ski Resort, Snowboarding, Winter sports, Nearby lodgings and eateries |
| Thredbo | Another iconic ski resort village, popular not just for skiing but also for hiking and mountain biking in summer, appealing to year-round visitors. | Thredbo Alpine Village, Mount Kosciuszko, Cable car rides, Summer festivals and events |
Understanding Airbnb License Requirements & STR Laws in Cooma (2025)
Yes, Cooma, New South Wales, Australia enforces high STR regulations. Obtaining a license and ensuring compliance is almost certainly required according to current 2025 STR laws. Always verify the latest short term rental regulations and Airbnb license requirements directly with local government authorities for Cooma to ensure full compliance before hosting.
(Source: AirROI data, 2025, based on 76% licensed listings)
Top Performing Airbnb Properties in Cooma (2025)
Benchmark your potential! Explore examples of top-performing Airbnb properties in Coomabased on Trailing Twelve Month (TTM) revenue. Analyze their characteristics, revenue, occupancy rate, and ADR to understand what drives success in this market.
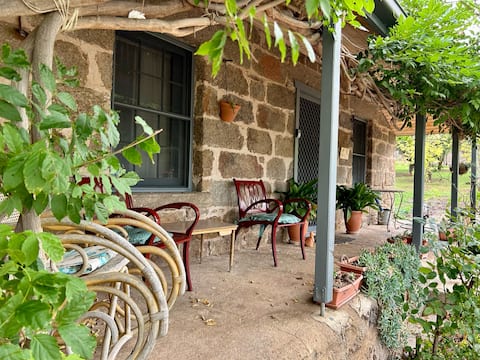
Heritage stone meets Modern Luxe - Terrace 1
Entire Place • 3 bedrooms
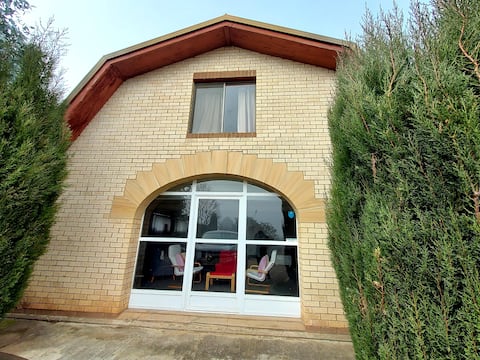
Newly Restored Heritage Stone Terrace
Entire Place • 4 bedrooms
Snowy Mountain Bike Pad
Entire Place • 3 bedrooms
Montague Cottage
Entire Place • 4 bedrooms
Woodvale at Cooma Mini Farmstay
Entire Place • 3 bedrooms
The Castanian Cottage
Entire Place • 3 bedrooms
Note: Performance varies based on location, size, amenities, seasonality, and management quality. Data reflects the past 12 months.
Top Performing Airbnb Hosts in Cooma (2025)
Learn from the best! This table showcases top-performing Airbnb hosts in Cooma based on the number of properties managed and estimated total revenue over the past year. Analyze their scale and performance metrics.
| Host Name | Properties | Grossing Revenue | Stay Reviews | Avg Rating |
|---|---|---|---|---|
| Nest Stays | 2 | $136,357 | 52 | 5.00/5.0 |
| Beau | 1 | $44,223 | 34 | 4.94/5.0 |
| Mark | 1 | $43,691 | 323 | 4.80/5.0 |
| Maria | 1 | $43,274 | 316 | 4.84/5.0 |
| Anna | 1 | $39,087 | 68 | 4.88/5.0 |
| Teagon | 1 | $38,540 | 19 | 4.95/5.0 |
| Erin | 1 | $34,499 | 45 | 5.00/5.0 |
| Host #85976308 | 2 | $34,406 | 95 | 5.00/5.0 |
| Chulee | 1 | $31,887 | 35 | 4.83/5.0 |
| Lorraine | 1 | $30,468 | 285 | 4.78/5.0 |
Analyzing the strategies of top hosts, such as their property selection, pricing, and guest communication, can offer valuable lessons for optimizing your own Airbnb operations in Cooma.
Dive Deeper: Advanced Cooma STR Market Data (2025)
Ready to unlock more insights? AirROI provides access to advanced metrics and comprehensive Airbnb data for Cooma. Explore detailed analytics beyond this report to refine your investment strategy, optimize pricing, and maximize your vacation rental profits.
Explore Advanced MetricsCooma Short-Term Rental Market Composition (2025): Property & Room Types
Room Type Distribution
Property Type Distribution
Market Composition Insights for Cooma
- The Cooma Airbnb market composition is heavily skewed towards Entire Home/Apt listings, which make up 76.5% of the 34 active rentals. This indicates strong guest preference for privacy and space.
- Looking at the property type distribution in Cooma, House properties are the most common (67.6%), reflecting the local real estate landscape.
- Houses represent a significant 67.6% portion, catering likely to families or larger groups.
- The presence of 8.8% Hotel/Boutique listings indicates integration with traditional hospitality.
Cooma Airbnb Room Capacity Analysis (2025): Bedroom Distribution
Distribution of Listings by Number of Bedrooms
Room Capacity Insights for Cooma
- The dominant room capacity in Cooma is 1 bedroom listings, making up 32.4% of the market. This suggests a strong demand for properties suitable for couples or solo travelers.
- Together, 1 bedroom and 3 bedrooms properties represent 55.9% of the active Airbnb listings in Cooma, indicating a high concentration in these sizes.
- A significant 38.2% of listings offer 3+ bedrooms, catering to larger groups and families seeking more space in Cooma.
Cooma Vacation Rental Guest Capacity Trends (2025)
Distribution of Listings by Guest Capacity
Guest Capacity Insights for Cooma
- The most common guest capacity trend in Cooma vacation rentals is listings accommodating 4 guests (29.4%). This suggests the primary traveler segment is likely small families or groups.
- Properties designed for 4 guests and 2 guests dominate the Cooma STR market, accounting for 50.0% of listings.
- 38.2% of properties accommodate 6+ guests, serving the market segment for larger families or group travel in Cooma.
- On average, properties in Cooma are equipped to host 4.4 guests.
Cooma Airbnb Booking Patterns (2025): Available vs. Booked Days
Available Days Distribution
Booked Days Distribution
Booking Pattern Insights for Cooma
- The most common availability pattern in Cooma falls within the 181-270 days range, representing 41.2% of listings. This suggests many properties have significant open periods on their calendars.
- Approximately 73.6% of listings show high availability (181+ days open annually), indicating potential for increased bookings or specific owner usage patterns.
- For booked days, the 91-180 days range is most frequent in Cooma (38.2%), reflecting common guest stay durations or potential owner blocking patterns.
- A notable 29.4% of properties secure long booking periods (181+ days booked per year), highlighting successful long-term rental strategies or significant owner usage.
Cooma Airbnb Minimum Stay Requirements Analysis
Distribution of Listings by Minimum Night Requirement
1 Night
16 listings
50% of total
2 Nights
11 listings
34.4% of total
3 Nights
3 listings
9.4% of total
30+ Nights
2 listings
6.3% of total
Key Insights
- The most prevalent minimum stay requirement in Cooma is 1 Night, adopted by 50% of listings. This highlights the market's preference for shorter, flexible bookings.
- A strong majority (84.4%) of the Cooma Airbnb data shows acceptance of very short stays (1-2 nights), indicating a dynamic, high-turnover market.
Recommendations
- Align with the market by considering a 1 Night minimum stay, as 50% of Cooma hosts use this setting.
- Explore offering discounts for stays of 30+ nights to attract the 6.3% of the market seeking extended stays.
- Adjust minimum nights based on seasonality – potentially shorter during low season and longer during peak demand periods in Cooma.
Cooma Airbnb Cancellation Policy Trends Analysis (2025)
Flexible
5 listings
17.2% of total
Moderate
11 listings
37.9% of total
Firm
8 listings
27.6% of total
Strict
5 listings
17.2% of total
Cancellation Policy Insights for Cooma
- The prevailing Airbnb cancellation policy trend in Cooma is Moderate, used by 37.9% of listings.
- There's a relatively balanced mix between guest-friendly (55.1%) and stricter (44.8%) policies, offering choices for different guest needs.
Recommendations for Hosts
- Consider adopting a Moderate policy to align with the 37.9% market standard in Cooma.
- Regularly review your cancellation policy against competitors and market demand shifts in Cooma.
Cooma STR Booking Lead Time Analysis (2025)
Average Booking Lead Time by Month
Booking Lead Time Insights for Cooma
- The overall average booking lead time for vacation rentals in Cooma is 35 days.
- Guests book furthest in advance for stays during July (average 111 days), likely coinciding with peak travel demand or local events.
- The shortest booking windows occur for stays in February (average 24 days), indicating more last-minute travel plans during this time.
- Seasonally, Summer (78 days avg.) sees the longest lead times, while Winter (34 days avg.) has the shortest, reflecting typical travel planning cycles.
Recommendations for Hosts
- Use the overall average lead time (35 days) as a baseline for your pricing and availability strategy in Cooma.
- For July stays, consider implementing length-of-stay discounts or slightly higher rates for bookings made less than 111 days out to capitalize on advance planning.
- Target marketing efforts for the Summer season well in advance (at least 78 days) to capture early planners.
- Monitor your own booking lead times against these Cooma averages to identify opportunities for dynamic pricing adjustments.
Popular & Essential Airbnb Amenities in Cooma (2025)
Amenity Prevalence
Amenity Insights for Cooma
- Essential amenities in Cooma that guests expect include: Smoke alarm, Hot water, TV. Lacking these (any) could significantly impact bookings.
- Popular amenities like Heating, Kitchen, Essentials are common but not universal. Offering these can provide a competitive edge.
- Warning: Wifi is not universally provided but is considered essential globally. Ensure reliable Wifi is offered.
Recommendations for Hosts
- Ensure your listing includes all essential amenities for Cooma: Smoke alarm, Hot water, TV.
- Prioritize adding missing essentials: TV.
- Consider adding popular differentiators like Heating or Kitchen to increase appeal.
- Highlight unique or less common amenities you offer (e.g., hot tub, dedicated workspace, EV charger) in your listing description and photos.
- Regularly check competitor amenities in Cooma to stay competitive.
Cooma Airbnb Guest Demographics & Profile Analysis (2025)
Guest Profile Summary for Cooma
- The typical guest profile for Airbnb in Cooma consists of primarily domestic travelers (94%), often arriving from nearby Sydney, typically belonging to the Post-2000s (Gen Z/Alpha) group (50%), primarily speaking English or Chinese.
- Domestic travelers account for 94.3% of guests.
- Key international markets include Australia (94.3%) and United States (1%).
- Top languages spoken are English (62.7%) followed by Chinese (6%).
- A significant demographic segment is the Post-2000s (Gen Z/Alpha) group, representing 50% of guests.
Recommendations for Hosts
- Target domestic marketing efforts towards travelers from Sydney and New South Wales.
- Tailor amenities and listing descriptions to appeal to the dominant Post-2000s (Gen Z/Alpha) demographic (e.g., highlight fast WiFi, smart home features, local guides).
- Highlight unique local experiences or amenities relevant to the primary guest profile.
- Consider seasonal promotions aligned with peak travel times for key origin markets.
Nearby Short-Term Rental Market Comparison
How does the Cooma Airbnb market stack up against its neighbors? Compare key performance metrics like average monthly revenue, ADR, and occupancy rates in surrounding areas to understand the broader regional STR landscape.
| Market | Active Properties | Monthly Revenue | Daily Rate | Avg. Occupancy |
|---|---|---|---|---|
| Braidwood | 20 | $4,708 | $443.62 | 40% |
| Callala Beach | 141 | $4,184 | $445.52 | 36% |
| Snowy Monaro Regional Council | 216 | $3,956 | $391.38 | 39% |
| Hyams Beach | 104 | $3,791 | $448.61 | 33% |
| Huskisson | 213 | $3,731 | $333.35 | 40% |
| East Jindabyne | 108 | $3,506 | $389.01 | 40% |
| Bendalong | 29 | $3,471 | $380.53 | 30% |
| Myola | 11 | $3,317 | $414.89 | 31% |
| Shoalhaven City Council | 1,122 | $3,269 | $381.96 | 35% |
| Vincentia | 409 | $3,122 | $351.92 | 36% |