Cabonne Council Airbnb Market Analysis 2025: Short Term Rental Data & Vacation Rental Statistics in New South Wales, Australia
Is Airbnb profitable in Cabonne Council in 2025? Explore comprehensive Airbnb analytics for Cabonne Council, New South Wales, Australia to uncover income potential. This 2025 STR market report for Cabonne Council, based on AirROI data from April 2024 to March 2025, reveals key trends in the niche market of 42 active listings.
Whether you're considering an Airbnb investment in Cabonne Council, optimizing your existing vacation rental, or exploring rental arbitrage opportunities, understanding the Cabonne Council Airbnb data is crucial. Navigating the high regulation landscape is key to maximizing your short term rental income potential. Let's dive into the specifics.
Key Cabonne Council Airbnb Performance Metrics Overview
Monthly Airbnb Revenue Variations & Income Potential in Cabonne Council (2025)
Understanding the monthly revenue variations for Airbnb listings in Cabonne Council is key to maximizing your short term rental income potential. Seasonality significantly impacts earnings. Our analysis, based on data from the past 12 months, shows that the peak revenue month for STRs in Cabonne Council is typically June, while August often presents the lowest earnings, highlighting opportunities for strategic pricing adjustments during shoulder and low seasons. Explore the typical Airbnb income in Cabonne Council across different performance tiers:
- Best-in-class properties (Top 10%) achieve $5,219+ monthly, often utilizing dynamic pricing and superior guest experiences.
- Strong performing properties (Top 25%) earn $3,533 or more, indicating effective management and desirable locations/amenities.
- Typical properties (Median) generate around $2,035 per month, representing the average market performance.
- Entry-level properties (Bottom 25%) see earnings around $995, often with potential for optimization.
Average Monthly Airbnb Earnings Trend in Cabonne Council
Cabonne Council Airbnb Occupancy Rate Trends (2025)
Maximize your bookings by understanding the Cabonne Council STR occupancy trends. Seasonal demand shifts significantly influence how often properties are booked. Typically, Octobersees the highest demand (peak season occupancy), while August experiences the lowest (low season). Effective strategies, like adjusting minimum stays or offering promotions, can boost occupancy during slower periods. Here's how different property tiers perform in Cabonne Council:
- Best-in-class properties (Top 10%) achieve 68%+ occupancy, indicating high desirability and potentially optimized availability.
- Strong performing properties (Top 25%) maintain 47% or higher occupancy, suggesting good market fit and guest satisfaction.
- Typical properties (Median) have an occupancy rate around 30%.
- Entry-level properties (Bottom 25%) average 18% occupancy, potentially facing higher vacancy.
Average Monthly Occupancy Rate Trend in Cabonne Council
Average Daily Rate (ADR) Airbnb Trends in Cabonne Council (2025)
Effective short term rental pricing strategy in Cabonne Council involves understanding monthly ADR fluctuations. The Average Daily Rate (ADR) for Airbnb in Cabonne Council typically peaks in December and dips lowest during February. Leveraging Airbnb dynamic pricing tools or strategies based on this seasonality can significantly boost revenue. Here's a look at the typical nightly rates achieved:
- Best-in-class properties (Top 10%) command rates of $399+ per night, often due to premium features or locations.
- Strong performing properties (Top 25%) achieve nightly rates of $262 or more.
- Typical properties (Median) charge around $194 per night.
- Entry-level properties (Bottom 25%) earn around $144 per night.
Average Daily Rate (ADR) Trend by Month in Cabonne Council
Get Live Cabonne Council Market Intelligence 👇

Explore Real-time Analytics
Airbnb Seasonality Analysis & Trends in Cabonne Council (2025)
Peak Season (June, May, October)
- Revenue averages $3,863 per month
- Occupancy rates average 35.3%
- Daily rates average $235
Shoulder Season
- Revenue averages $2,989 per month
- Occupancy maintains around 36.8%
- Daily rates hold near $236
Low Season (February, August, September)
- Revenue drops to average $1,970 per month
- Occupancy decreases to average 30.2%
- Daily rates adjust to average $227
Seasonality Insights for Cabonne Council
- The Airbnb seasonality in Cabonne Council shows highly seasonal trends requiring careful strategy. While the sections above show seasonal averages, it's also insightful to look at the extremes:
- During the high season, the absolute peak month showcases Cabonne Council's highest earning potential, with monthly revenues capable of climbing to $4,175, occupancy reaching a high of 43.8%, and ADRs peaking at $248.
- Conversely, the slowest single month of the year, typically falling within the low season, marks the market's lowest point. In this month, revenue might dip to $1,476, occupancy could drop to 25.8%, and ADRs may adjust down to $223.
- Understanding both the seasonal averages and these monthly peaks and troughs in revenue, occupancy, and ADR is crucial for maximizing your Airbnb profit potential in Cabonne Council.
Seasonal Strategies for Maximizing Profit
- Peak Season: Maximize revenue through premium pricing and potentially longer minimum stays. Ensure high availability.
- Low Season: Offer competitive pricing, special promotions (e.g., extended stay discounts), and flexible cancellation policies. Target off-season travelers like remote workers or budget-conscious guests.
- Shoulder Seasons: Implement dynamic pricing that balances peak and low rates. Target weekend travelers or specific events. Offer slightly more flexible terms than peak season.
- Regularly analyze your own performance against these Cabonne Council seasonality benchmarks and adjust your pricing and availability strategy accordingly.
Best Areas for Airbnb Investment in Cabonne Council (2025)
Exploring the top neighborhoods for short-term rentals in Cabonne Council? This section highlights key areas, outlining why they are attractive for hosts and guests, along with notable local attractions. Consider these locations based on your target guest profile and investment strategy.
| Neighborhood / Area | Why Host Here? (Target Guests & Appeal) | Key Attractions & Landmarks |
|---|---|---|
| Molong | A charming rural town with rich history and a vibrant community. It's known for its scenic landscapes and proximity to wineries, making it an attractive destination for tourists and short-term stays. | Molong History Museum, Molong Golf Club, Bantry Bay, Wine Tasting Tours, Local Farmers Market |
| Canowindra | Famous for its hot air ballooning and historic buildings, Canowindra is a quaint town that offers unique experiences. Its appeal lies in its rural beauty and outdoor activities. | Canowindra Historical Museum, Hot Air Ballooning, Cowra Olive Plantation, Local Vineyards, Fishing at the Macquarie River |
| Borenore | Close to Orange, Borenore offers a peaceful rural setting with access to local attractions, wineries, and beautiful national parks, making it ideal for guests looking for a relaxing getaway. | Borenore Caves, Local Wineries, Mount Canobolas, Orange Botanic Gardens, Fishing and hiking opportunities |
| Yeoval | A small town known for its scenic beauty and agricultural charm. It's an emerging area for Airbnb with potential for rural tourism and weekend getaways from the city. | Yeoval Cemetery, Yuranigh's Grave, Local Art Galleries, Bushwalking Trails, Community Events |
| Cudal | A picturesque village in a rural setting, Cudal is surrounded by agriculture and natural beauty, offering guests a serene escape from urban life. | Cudal Coal Mine, Local Produce Stores, Walking Trails, Natural Landmarks, Community Festivals |
| Orange | A popular regional center known for its food and wine culture, Orange attracts many visitors looking for gourmet experiences and vibrant local events. | Orange Food and Wine Festival, Local Vineyards, Orange Botanic Gardens, Vintage Markets, Arts and Culture Events |
| Gardendale | Situated near larger towns, Gardendale provides a rural experience with accessibility to modern amenities and is perfect for families looking for a quiet retreat. | Gardendale Homestead, Local Nature Reserves, Walking Trails, Community Shops, Close to larger cities |
| Warner's Bay | A suburb of Lake Macquarie; while not in Cabonne, it's close enough to attract visitors looking for lakeside activities and family-friendly attractions. | Warners Bay Foreshore, Walking and Cycling Tracks, Local Cafés and Restaurants, Lake Macquarie, Family-friendly Parks |
Understanding Airbnb License Requirements & STR Laws in Cabonne Council (2025)
Yes, Cabonne Council, New South Wales, Australia enforces high STR regulations. Obtaining a license and ensuring compliance is almost certainly required according to current 2025 STR laws. Always verify the latest short term rental regulations and Airbnb license requirements directly with local government authorities for Cabonne Council to ensure full compliance before hosting.
(Source: AirROI data, 2025, based on 88% licensed listings)
Top Performing Airbnb Properties in Cabonne Council (2025)
Benchmark your potential! Explore examples of top-performing Airbnb properties in Cabonne Councilbased on Trailing Twelve Month (TTM) revenue. Analyze their characteristics, revenue, occupancy rate, and ADR to understand what drives success in this market.

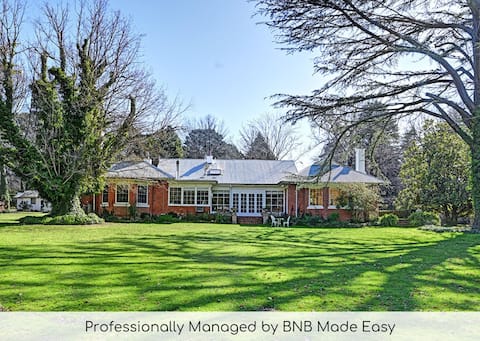
Tremearne Homestead 4 acre garden Highland cows
Entire Place • 6 bedrooms
The Homestead - Mayfield Vineyard Orange
Entire Place • 5 bedrooms
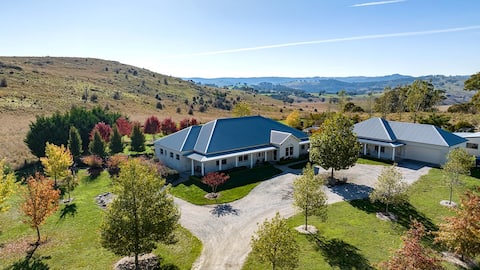
Luxury Countryside Home and Gardens - Orange
Entire Place • 3 bedrooms
Wonderful Windera - Amazing 5 Bedroom Family Home
Entire Place • 5 bedrooms
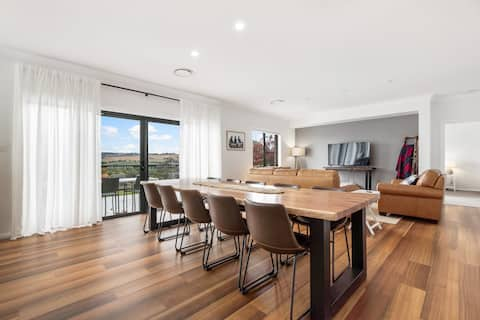
Stylish and modern house, with a Hamptons flair
Entire Place • 4 bedrooms
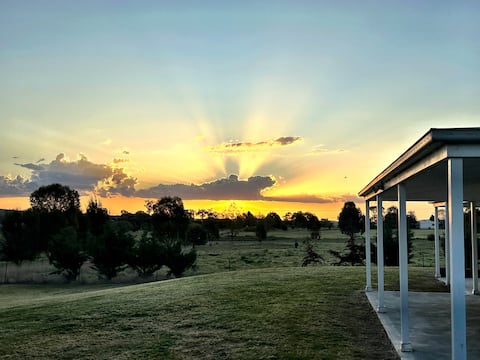
Warruga Shack- Farm Stay Orange - Views & Sunsets
Entire Place • 3 bedrooms
Note: Performance varies based on location, size, amenities, seasonality, and management quality. Data reflects the past 12 months.
Top Performing Airbnb Hosts in Cabonne Council (2025)
Learn from the best! This table showcases top-performing Airbnb hosts in Cabonne Council based on the number of properties managed and estimated total revenue over the past year. Analyze their scale and performance metrics.
| Host Name | Properties | Grossing Revenue | Stay Reviews | Avg Rating |
|---|---|---|---|---|
| BNB Made Easy: Timmy | 9 | $281,029 | 147 | 4.54/5.0 |
| James | 1 | $248,055 | 8 | 5.00/5.0 |
| Tanya & Nick | 2 | $68,237 | 498 | 4.92/5.0 |
| Kate | 1 | $67,781 | 139 | 4.97/5.0 |
| Book Regional | 2 | $57,433 | 12 | 2.50/5.0 |
| YourStay | 2 | $52,772 | 92 | 4.88/5.0 |
| Andrew | 1 | $45,169 | 20 | 5.00/5.0 |
| Susan | 1 | $43,185 | 83 | 4.96/5.0 |
| Andrew | 1 | $39,959 | 86 | 4.97/5.0 |
| Richard | 1 | $36,022 | 44 | 4.91/5.0 |
Analyzing the strategies of top hosts, such as their property selection, pricing, and guest communication, can offer valuable lessons for optimizing your own Airbnb operations in Cabonne Council.
Dive Deeper: Advanced Cabonne Council STR Market Data (2025)
Ready to unlock more insights? AirROI provides access to advanced metrics and comprehensive Airbnb data for Cabonne Council. Explore detailed analytics beyond this report to refine your investment strategy, optimize pricing, and maximize your vacation rental profits.
Explore Advanced MetricsCabonne Council Short-Term Rental Market Composition (2025): Property & Room Types
Room Type Distribution
Property Type Distribution
Market Composition Insights for Cabonne Council
- The Cabonne Council Airbnb market composition is heavily skewed towards Entire Home/Apt listings, which make up 100% of the 42 active rentals. This indicates strong guest preference for privacy and space.
- Looking at the property type distribution in Cabonne Council, House properties are the most common (50%), reflecting the local real estate landscape.
- Houses represent a significant 50% portion, catering likely to families or larger groups.
- The presence of 7.1% Hotel/Boutique listings indicates integration with traditional hospitality.
Cabonne Council Airbnb Room Capacity Analysis (2025): Bedroom Distribution
Distribution of Listings by Number of Bedrooms
Room Capacity Insights for Cabonne Council
- The dominant room capacity in Cabonne Council is 1 bedroom listings, making up 28.6% of the market. This suggests a strong demand for properties suitable for couples or solo travelers.
- Together, 1 bedroom and 3 bedrooms properties represent 50.0% of the active Airbnb listings in Cabonne Council, indicating a high concentration in these sizes.
- A significant 52.4% of listings offer 3+ bedrooms, catering to larger groups and families seeking more space in Cabonne Council.
Cabonne Council Vacation Rental Guest Capacity Trends (2025)
Distribution of Listings by Guest Capacity
Guest Capacity Insights for Cabonne Council
- The most common guest capacity trend in Cabonne Council vacation rentals is listings accommodating 2 guests (33.3%). This suggests the primary traveler segment is likely couples or solo travelers.
- Properties designed for 2 guests and 8+ guests dominate the Cabonne Council STR market, accounting for 64.3% of listings.
- 54.8% of properties accommodate 6+ guests, serving the market segment for larger families or group travel in Cabonne Council.
- On average, properties in Cabonne Council are equipped to host 5.1 guests.
Cabonne Council Airbnb Booking Patterns (2025): Available vs. Booked Days
Available Days Distribution
Booked Days Distribution
Booking Pattern Insights for Cabonne Council
- The most common availability pattern in Cabonne Council falls within the 181-270 days range, representing 40.5% of listings. This suggests many properties have significant open periods on their calendars.
- Approximately 78.6% of listings show high availability (181+ days open annually), indicating potential for increased bookings or specific owner usage patterns.
- For booked days, the 91-180 days range is most frequent in Cabonne Council (38.1%), reflecting common guest stay durations or potential owner blocking patterns.
- A notable 23.8% of properties secure long booking periods (181+ days booked per year), highlighting successful long-term rental strategies or significant owner usage.
Cabonne Council Airbnb Minimum Stay Requirements Analysis
Distribution of Listings by Minimum Night Requirement
1 Night
7 listings
17.9% of total
2 Nights
20 listings
51.3% of total
3 Nights
1 listings
2.6% of total
30+ Nights
11 listings
28.2% of total
Key Insights
- The most prevalent minimum stay requirement in Cabonne Council is 2 Nights, adopted by 51.3% of listings. This highlights the market's preference for shorter, flexible bookings.
- A strong majority (69.2%) of the Cabonne Council Airbnb data shows acceptance of very short stays (1-2 nights), indicating a dynamic, high-turnover market.
- A significant segment (28.2%) caters to monthly stays (30+ nights) in Cabonne Council, pointing to opportunities in the extended-stay market.
Recommendations
- Align with the market by considering a 2 Nights minimum stay, as 51.3% of Cabonne Council hosts use this setting.
- If feasible, allowing 1-night stays, especially midweek or during low season, could capture last-minute bookings, as only 17.9% currently do.
- A 2-night minimum appears standard (51.3%). Consider this for weekends or peak periods.
- Explore offering discounts for stays of 30+ nights to attract the 28.2% of the market seeking extended stays.
- Adjust minimum nights based on seasonality – potentially shorter during low season and longer during peak demand periods in Cabonne Council.
Cabonne Council Airbnb Cancellation Policy Trends Analysis (2025)
Flexible
8 listings
20.5% of total
Moderate
19 listings
48.7% of total
Firm
7 listings
17.9% of total
Strict
5 listings
12.8% of total
Cancellation Policy Insights for Cabonne Council
- The prevailing Airbnb cancellation policy trend in Cabonne Council is Moderate, used by 48.7% of listings.
- There's a relatively balanced mix between guest-friendly (69.2%) and stricter (30.7%) policies, offering choices for different guest needs.
Recommendations for Hosts
- Consider adopting a Moderate policy to align with the 48.7% market standard in Cabonne Council.
- Using a Strict policy might deter some guests, as only 12.8% of listings use it. Evaluate if potential revenue protection outweighs possible lower booking rates.
- Regularly review your cancellation policy against competitors and market demand shifts in Cabonne Council.
Cabonne Council STR Booking Lead Time Analysis (2025)
Average Booking Lead Time by Month
Booking Lead Time Insights for Cabonne Council
- The overall average booking lead time for vacation rentals in Cabonne Council is 45 days.
- Guests book furthest in advance for stays during April (average 65 days), likely coinciding with peak travel demand or local events.
- The shortest booking windows occur for stays in August (average 32 days), indicating more last-minute travel plans during this time.
- Seasonally, Winter (56 days avg.) sees the longest lead times, while Summer (38 days avg.) has the shortest, reflecting typical travel planning cycles.
Recommendations for Hosts
- Use the overall average lead time (45 days) as a baseline for your pricing and availability strategy in Cabonne Council.
- For April stays, consider implementing length-of-stay discounts or slightly higher rates for bookings made less than 65 days out to capitalize on advance planning.
- Target marketing efforts for the Winter season well in advance (at least 56 days) to capture early planners.
- Monitor your own booking lead times against these Cabonne Council averages to identify opportunities for dynamic pricing adjustments.
Popular & Essential Airbnb Amenities in Cabonne Council (2025)
Amenity Prevalence
Amenity Insights for Cabonne Council
- Essential amenities in Cabonne Council that guests expect include: Free parking on premises, Hot water, Smoke alarm, Heating. Lacking these (any) could significantly impact bookings.
- Popular amenities like Hangers, Dishes and silverware, Kitchen are common but not universal. Offering these can provide a competitive edge.
Recommendations for Hosts
- Ensure your listing includes all essential amenities for Cabonne Council: Free parking on premises, Hot water, Smoke alarm, Heating.
- Prioritize adding missing essentials: Hot water, Smoke alarm, Heating.
- Consider adding popular differentiators like Hangers or Dishes and silverware to increase appeal.
- Highlight unique or less common amenities you offer (e.g., hot tub, dedicated workspace, EV charger) in your listing description and photos.
- Regularly check competitor amenities in Cabonne Council to stay competitive.
Cabonne Council Airbnb Guest Demographics & Profile Analysis (2025)
Guest Profile Summary for Cabonne Council
- The typical guest profile for Airbnb in Cabonne Council consists of primarily domestic travelers (97%), often arriving from nearby Sydney, typically belonging to the Post-2000s (Gen Z/Alpha) group (50%), primarily speaking English or French.
- Domestic travelers account for 96.5% of guests.
- Key international markets include Australia (96.5%) and New Zealand (0.6%).
- Top languages spoken are English (72.8%) followed by French (5.1%).
- A significant demographic segment is the Post-2000s (Gen Z/Alpha) group, representing 50% of guests.
Recommendations for Hosts
- Target domestic marketing efforts towards travelers from Sydney and New South Wales.
- Tailor amenities and listing descriptions to appeal to the dominant Post-2000s (Gen Z/Alpha) demographic (e.g., highlight fast WiFi, smart home features, local guides).
- Highlight unique local experiences or amenities relevant to the primary guest profile.
- Consider seasonal promotions aligned with peak travel times for key origin markets.
Nearby Short-Term Rental Market Comparison
How does the Cabonne Council Airbnb market stack up against its neighbors? Compare key performance metrics like average monthly revenue, ADR, and occupancy rates in surrounding areas to understand the broader regional STR landscape.
| Market | Active Properties | Monthly Revenue | Daily Rate | Avg. Occupancy |
|---|---|---|---|---|
| Penrose | 12 | $6,349 | $600.00 | 42% |
| Berry | 115 | $6,185 | $540.04 | 41% |
| Jaspers Brush | 13 | $5,600 | $510.06 | 37% |
| Burrawang | 11 | $5,005 | $523.75 | 43% |
| Berrima | 44 | $4,756 | $426.34 | 42% |
| Robertson | 44 | $4,655 | $375.71 | 40% |
| Bombo | 10 | $4,613 | $503.00 | 39% |
| Exeter | 30 | $4,595 | $519.08 | 38% |
| Gerringong | 121 | $4,483 | $486.76 | 37% |
| Bowral | 170 | $4,412 | $359.45 | 45% |