Byron Bay Airbnb Market Analysis 2025: Short Term Rental Data & Vacation Rental Statistics in New South Wales, Australia
Is Airbnb profitable in Byron Bay in 2025? Explore comprehensive Airbnb analytics for Byron Bay, New South Wales, Australia to uncover income potential. This 2025 STR market report for Byron Bay, based on AirROI data from April 2024 to March 2025, reveals key trends in the market of 952 active listings.
Whether you're considering an Airbnb investment in Byron Bay, optimizing your existing vacation rental, or exploring rental arbitrage opportunities, understanding the Byron Bay Airbnb data is crucial. Navigating the high regulation landscape is key to maximizing your short term rental income potential. Let's dive into the specifics.
Key Byron Bay Airbnb Performance Metrics Overview
Monthly Airbnb Revenue Variations & Income Potential in Byron Bay (2025)
Understanding the monthly revenue variations for Airbnb listings in Byron Bay is key to maximizing your short term rental income potential. Seasonality significantly impacts earnings. Our analysis, based on data from the past 12 months, shows that the peak revenue month for STRs in Byron Bay is typically January, while June often presents the lowest earnings, highlighting opportunities for strategic pricing adjustments during shoulder and low seasons. Explore the typical Airbnb income in Byron Bay across different performance tiers:
- Best-in-class properties (Top 10%) achieve $11,547+ monthly, often utilizing dynamic pricing and superior guest experiences.
- Strong performing properties (Top 25%) earn $7,179 or more, indicating effective management and desirable locations/amenities.
- Typical properties (Median) generate around $3,941 per month, representing the average market performance.
- Entry-level properties (Bottom 25%) see earnings around $1,967, often with potential for optimization.
Average Monthly Airbnb Earnings Trend in Byron Bay
Byron Bay Airbnb Occupancy Rate Trends (2025)
Maximize your bookings by understanding the Byron Bay STR occupancy trends. Seasonal demand shifts significantly influence how often properties are booked. Typically, Januarysees the highest demand (peak season occupancy), while June experiences the lowest (low season). Effective strategies, like adjusting minimum stays or offering promotions, can boost occupancy during slower periods. Here's how different property tiers perform in Byron Bay:
- Best-in-class properties (Top 10%) achieve 83%+ occupancy, indicating high desirability and potentially optimized availability.
- Strong performing properties (Top 25%) maintain 67% or higher occupancy, suggesting good market fit and guest satisfaction.
- Typical properties (Median) have an occupancy rate around 43%.
- Entry-level properties (Bottom 25%) average 21% occupancy, potentially facing higher vacancy.
Average Monthly Occupancy Rate Trend in Byron Bay
Average Daily Rate (ADR) Airbnb Trends in Byron Bay (2025)
Effective short term rental pricing strategy in Byron Bay involves understanding monthly ADR fluctuations. The Average Daily Rate (ADR) for Airbnb in Byron Bay typically peaks in January and dips lowest during August. Leveraging Airbnb dynamic pricing tools or strategies based on this seasonality can significantly boost revenue. Here's a look at the typical nightly rates achieved:
- Best-in-class properties (Top 10%) command rates of $854+ per night, often due to premium features or locations.
- Strong performing properties (Top 25%) achieve nightly rates of $566 or more.
- Typical properties (Median) charge around $345 per night.
- Entry-level properties (Bottom 25%) earn around $203 per night.
Average Daily Rate (ADR) Trend by Month in Byron Bay
Get Live Byron Bay Market Intelligence 👇

Explore Real-time Analytics
Airbnb Seasonality Analysis & Trends in Byron Bay (2025)
Peak Season (January, December, November)
- Revenue averages $7,651 per month
- Occupancy rates average 54.5%
- Daily rates average $494
Shoulder Season
- Revenue averages $5,031 per month
- Occupancy maintains around 43.3%
- Daily rates hold near $436
Low Season (March, June, August)
- Revenue drops to average $4,061 per month
- Occupancy decreases to average 38.0%
- Daily rates adjust to average $419
Seasonality Insights for Byron Bay
- The Airbnb seasonality in Byron Bay shows highly seasonal trends requiring careful strategy. While the sections above show seasonal averages, it's also insightful to look at the extremes:
- During the high season, the absolute peak month showcases Byron Bay's highest earning potential, with monthly revenues capable of climbing to $8,559, occupancy reaching a high of 58.2%, and ADRs peaking at $512.
- Conversely, the slowest single month of the year, typically falling within the low season, marks the market's lowest point. In this month, revenue might dip to $4,030, occupancy could drop to 34.7%, and ADRs may adjust down to $410.
- Understanding both the seasonal averages and these monthly peaks and troughs in revenue, occupancy, and ADR is crucial for maximizing your Airbnb profit potential in Byron Bay.
Seasonal Strategies for Maximizing Profit
- Peak Season: Maximize revenue through premium pricing and potentially longer minimum stays. Ensure high availability.
- Low Season: Offer competitive pricing, special promotions (e.g., extended stay discounts), and flexible cancellation policies. Target off-season travelers like remote workers or budget-conscious guests.
- Shoulder Seasons: Implement dynamic pricing that balances peak and low rates. Target weekend travelers or specific events. Offer slightly more flexible terms than peak season.
- Regularly analyze your own performance against these Byron Bay seasonality benchmarks and adjust your pricing and availability strategy accordingly.
Best Areas for Airbnb Investment in Byron Bay (2025)
Exploring the top neighborhoods for short-term rentals in Byron Bay? This section highlights key areas, outlining why they are attractive for hosts and guests, along with notable local attractions. Consider these locations based on your target guest profile and investment strategy.
| Neighborhood / Area | Why Host Here? (Target Guests & Appeal) | Key Attractions & Landmarks |
|---|---|---|
| Byron Bay Town Centre | The vibrant heart of Byron Bay, offering a mix of shops, cafes, and nightlife. It's perfectly situated for tourists looking for convenience and access to beaches. | Main Beach, The Byron Bay Lighthouse, Byron Bay Markets, Cape Byron State Conservation Area, Watego's Beach |
| Tallows Beach | A quieter, more serene beach location popular with families and those seeking a peaceful getaway. It's a short drive or walk to the town centre but offers a more relaxed beach vibe. | Tallows Beach, Broken Head Nature Reserve, Clarks Beach, Byron Bay Golf Club, Julian Rocks |
| Julian Rocks | A famous diving spot and marine reserve just off the coast of Byron Bay. Attracts nature lovers and adventure seekers for snorkeling and diving experiences. | Julian Rocks Marine Reserve, Snorkeling and diving tours, Whale watching, Surf schools nearby, Nearby beaches |
| North Beach | A more laid-back beach vibe, great for surfers and those looking to escape the busier sections of Byron Bay. Offers a blend of natural beauty and beach culture. | North Byron Parklands, North Beach, Surfing spots, Cape Byron Headland, Cycling paths |
| Belongil Beach | Known for its relaxed atmosphere, Belongil Beach is great for those looking to escape the crowds yet still enjoy the beach access. Popular with younger crowds. | Belongil Beach, Point Lookout, Surf schools, Cafes and beach bars, Nearby walking trails |
| Broken Head | A natural reserve area with stunning beaches and walking trails. It's less developed than Byron Bay town which appeals to nature lovers and campers. | Broken Head Beach, The Broken Head Nature Reserve, Walking trails, Surfing spots, Camping areas |
| Suffolk Park | A family-friendly suburb just south of Byron Bay. It offers both beach access and a peaceful suburban vibe, ideal for families looking for longer stays. | Suffolk Park Beach, Mister Teas Cafe, Nearby parks, Cycling paths, Nature reserves |
| The Pass | Popular surf spot and beautiful beach line which attracts surfers and beachgoers alike. It's close to the Byron Bay town centre, providing convenience with a local feel. | The Pass Surf Break, Main Beach, Cape Byron Lighthouse, Walking tracks, Nearby cafes |
Understanding Airbnb License Requirements & STR Laws in Byron Bay (2025)
Yes, Byron Bay, New South Wales, Australia enforces high STR regulations. Obtaining a license and ensuring compliance is almost certainly required according to current 2025 STR laws. Always verify the latest short term rental regulations and Airbnb license requirements directly with local government authorities for Byron Bay to ensure full compliance before hosting.
(Source: AirROI data, 2025, based on 86% licensed listings)
Top Performing Airbnb Properties in Byron Bay (2025)
Benchmark your potential! Explore examples of top-performing Airbnb properties in Byron Baybased on Trailing Twelve Month (TTM) revenue. Analyze their characteristics, revenue, occupancy rate, and ADR to understand what drives success in this market.
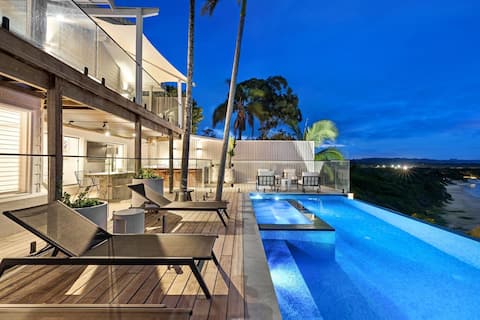
Your Luxury Escape - Sway
Entire Place • 5 bedrooms
Two Luxury Homes in the Heart of Byron Bay
Entire Place • 6 bedrooms
East Coast Escapes | Barbara by Kinsfolk
Entire Place • 5 bedrooms
Beaumonts Beach House and Apartment on Belongil
Entire Place • 6 bedrooms

Luxico's Barefoot Bay Villa - exquisite style
Entire Place • 5 bedrooms
Cooee -Brand new with private pool 350m to beach!
Entire Place • 4 bedrooms
Note: Performance varies based on location, size, amenities, seasonality, and management quality. Data reflects the past 12 months.
Top Performing Airbnb Hosts in Byron Bay (2025)
Learn from the best! This table showcases top-performing Airbnb hosts in Byron Bay based on the number of properties managed and estimated total revenue over the past year. Analyze their scale and performance metrics.
| Host Name | Properties | Grossing Revenue | Stay Reviews | Avg Rating |
|---|---|---|---|---|
| A Perfect Stay | 82 | $4,682,147 | 2469 | 4.02/5.0 |
| East Coast Escapes | 41 | $3,345,909 | 1475 | 4.31/5.0 |
| Beach Houses | 24 | $1,966,323 | 883 | 4.74/5.0 |
| Destination Byron | 30 | $1,845,211 | 2208 | 4.68/5.0 |
| Your Luxury Escape | 23 | $1,687,075 | 303 | 4.00/5.0 |
| Byron Bay Accom | 42 | $1,673,741 | 520 | 4.06/5.0 |
| Temple Retreats | 22 | $1,534,853 | 2849 | 4.61/5.0 |
| Fuller Holidays | 18 | $1,450,755 | 343 | 3.14/5.0 |
| Byron Bay Luxury Homes | 22 | $1,354,298 | 113 | 3.63/5.0 |
| Asta | 15 | $1,197,439 | 1389 | 4.92/5.0 |
Analyzing the strategies of top hosts, such as their property selection, pricing, and guest communication, can offer valuable lessons for optimizing your own Airbnb operations in Byron Bay.
Dive Deeper: Advanced Byron Bay STR Market Data (2025)
Ready to unlock more insights? AirROI provides access to advanced metrics and comprehensive Airbnb data for Byron Bay. Explore detailed analytics beyond this report to refine your investment strategy, optimize pricing, and maximize your vacation rental profits.
Explore Advanced MetricsByron Bay Short-Term Rental Market Composition (2025): Property & Room Types
Room Type Distribution
Property Type Distribution
Market Composition Insights for Byron Bay
- The Byron Bay Airbnb market composition is heavily skewed towards Entire Home/Apt listings, which make up 85.6% of the 952 active rentals. This indicates strong guest preference for privacy and space.
- Looking at the property type distribution in Byron Bay, House properties are the most common (46.1%), reflecting the local real estate landscape.
- Houses represent a significant 46.1% portion, catering likely to families or larger groups.
- The presence of 12.4% Hotel/Boutique listings indicates integration with traditional hospitality.
- Smaller segments like outdoor/unique, unique stays (combined 3.7%) offer potential for unique stay experiences.
Byron Bay Airbnb Room Capacity Analysis (2025): Bedroom Distribution
Distribution of Listings by Number of Bedrooms
Room Capacity Insights for Byron Bay
- The dominant room capacity in Byron Bay is 1 bedroom listings, making up 28.3% of the market. This suggests a strong demand for properties suitable for couples or solo travelers.
- Together, 1 bedroom and 3 bedrooms properties represent 52.6% of the active Airbnb listings in Byron Bay, indicating a high concentration in these sizes.
- A significant 42.4% of listings offer 3+ bedrooms, catering to larger groups and families seeking more space in Byron Bay.
Byron Bay Vacation Rental Guest Capacity Trends (2025)
Distribution of Listings by Guest Capacity
Guest Capacity Insights for Byron Bay
- The most common guest capacity trend in Byron Bay vacation rentals is listings accommodating 2 guests (25.5%). This suggests the primary traveler segment is likely couples or solo travelers.
- Properties designed for 2 guests and 8+ guests dominate the Byron Bay STR market, accounting for 46.3% of listings.
- 43.1% of properties accommodate 6+ guests, serving the market segment for larger families or group travel in Byron Bay.
- On average, properties in Byron Bay are equipped to host 4.6 guests.
Byron Bay Airbnb Booking Patterns (2025): Available vs. Booked Days
Available Days Distribution
Booked Days Distribution
Booking Pattern Insights for Byron Bay
- The most common availability pattern in Byron Bay falls within the 271-366 days range, representing 39.3% of listings. This suggests many properties have significant open periods on their calendars.
- Approximately 70.3% of listings show high availability (181+ days open annually), indicating potential for increased bookings or specific owner usage patterns.
- For booked days, the 91-180 days range is most frequent in Byron Bay (31.8%), reflecting common guest stay durations or potential owner blocking patterns.
- A notable 30.7% of properties secure long booking periods (181+ days booked per year), highlighting successful long-term rental strategies or significant owner usage.
Byron Bay Airbnb Minimum Stay Requirements Analysis
Distribution of Listings by Minimum Night Requirement
1 Night
72 listings
8.1% of total
2 Nights
161 listings
18.1% of total
3 Nights
181 listings
20.3% of total
4-6 Nights
114 listings
12.8% of total
7-29 Nights
27 listings
3% of total
30+ Nights
336 listings
37.7% of total
Key Insights
- The most prevalent minimum stay requirement in Byron Bay is 30+ Nights, adopted by 37.7% of listings. This highlights the market's preference for longer commitments.
- A significant segment (37.7%) caters to monthly stays (30+ nights) in Byron Bay, pointing to opportunities in the extended-stay market.
Recommendations
- Align with the market by considering a 30+ Nights minimum stay, as 37.7% of Byron Bay hosts use this setting.
- If feasible, allowing 1-night stays, especially midweek or during low season, could capture last-minute bookings, as only 8.1% currently do.
- Explore offering discounts for stays of 30+ nights to attract the 37.7% of the market seeking extended stays.
- Adjust minimum nights based on seasonality – potentially shorter during low season and longer during peak demand periods in Byron Bay.
Byron Bay Airbnb Cancellation Policy Trends Analysis (2025)
Super Strict 60 Days
45 listings
5.3% of total
Super Strict 30 Days
49 listings
5.8% of total
Flexible
27 listings
3.2% of total
Moderate
117 listings
13.7% of total
Firm
240 listings
28.2% of total
Strict
373 listings
43.8% of total
Cancellation Policy Insights for Byron Bay
- The prevailing Airbnb cancellation policy trend in Byron Bay is Strict, used by 43.8% of listings.
- A majority (72.0%) of hosts in Byron Bay utilize Firm or Strict policies, indicating a market where hosts prioritize booking security.
Recommendations for Hosts
- Consider adopting a Strict policy to align with the 43.8% market standard in Byron Bay.
- With 43.8% using Strict terms, this is a viable option in Byron Bay, particularly for high-value properties or during peak demand periods.
- Regularly review your cancellation policy against competitors and market demand shifts in Byron Bay.
Byron Bay STR Booking Lead Time Analysis (2025)
Average Booking Lead Time by Month
Booking Lead Time Insights for Byron Bay
- The overall average booking lead time for vacation rentals in Byron Bay is 69 days.
- Guests book furthest in advance for stays during November (average 111 days), likely coinciding with peak travel demand or local events.
- The shortest booking windows occur for stays in June (average 55 days), indicating more last-minute travel plans during this time.
- Seasonally, Fall (83 days avg.) sees the longest lead times, while Summer (57 days avg.) has the shortest, reflecting typical travel planning cycles.
Recommendations for Hosts
- Use the overall average lead time (69 days) as a baseline for your pricing and availability strategy in Byron Bay.
- For November stays, consider implementing length-of-stay discounts or slightly higher rates for bookings made less than 111 days out to capitalize on advance planning.
- Target marketing efforts for the Fall season well in advance (at least 83 days) to capture early planners.
- Monitor your own booking lead times against these Byron Bay averages to identify opportunities for dynamic pricing adjustments.
Popular & Essential Airbnb Amenities in Byron Bay (2025)
Amenity Prevalence
Amenity Insights for Byron Bay
- Essential amenities in Byron Bay that guests expect include: Wifi. Lacking these (this) could significantly impact bookings.
- Popular amenities like Essentials, TV, Smoke alarm are common but not universal. Offering these can provide a competitive edge.
Recommendations for Hosts
- Ensure your listing includes all essential amenities for Byron Bay: Wifi.
- Prioritize adding missing essentials: Wifi.
- Consider adding popular differentiators like Essentials or TV to increase appeal.
- Highlight unique or less common amenities you offer (e.g., hot tub, dedicated workspace, EV charger) in your listing description and photos.
- Regularly check competitor amenities in Byron Bay to stay competitive.
Byron Bay Airbnb Guest Demographics & Profile Analysis (2025)
Guest Profile Summary for Byron Bay
- The typical guest profile for Airbnb in Byron Bay consists of primarily domestic travelers (69%), often arriving from nearby Sydney, typically belonging to the Post-2000s (Gen Z/Alpha) group (50%), primarily speaking English or Spanish.
- Domestic travelers account for 69.0% of guests.
- Key international markets include Australia (69%) and United Kingdom (9.3%).
- Top languages spoken are English (63.8%) followed by Spanish (7.1%).
- A significant demographic segment is the Post-2000s (Gen Z/Alpha) group, representing 50% of guests.
Recommendations for Hosts
- Target domestic marketing efforts towards travelers from Sydney and Brisbane.
- Tailor amenities and listing descriptions to appeal to the dominant Post-2000s (Gen Z/Alpha) demographic (e.g., highlight fast WiFi, smart home features, local guides).
- Highlight unique local experiences or amenities relevant to the primary guest profile.
- Consider seasonal promotions aligned with peak travel times for key origin markets.
Nearby Short-Term Rental Market Comparison
How does the Byron Bay Airbnb market stack up against its neighbors? Compare key performance metrics like average monthly revenue, ADR, and occupancy rates in surrounding areas to understand the broader regional STR landscape.
| Market | Active Properties | Monthly Revenue | Daily Rate | Avg. Occupancy |
|---|---|---|---|---|
| Byron Shire Council | 206 | $3,945 | $428.48 | 42% |
| Ewingsdale | 67 | $3,804 | $487.49 | 37% |
| Kingscliff | 336 | $3,683 | $376.49 | 41% |
| Casuarina Beach | 138 | $3,646 | $407.62 | 42% |
| Clunes | 18 | $3,531 | $285.32 | 41% |
| Uki | 14 | $3,492 | $275.12 | 40% |
| Gold Coast City | 5,526 | $3,362 | $265.25 | 51% |
| Bogangar | 117 | $3,299 | $350.07 | 42% |
| Scenic Rim Regional | 284 | $3,224 | $243.05 | 46% |
| Suffolk Park | 188 | $3,161 | $375.75 | 46% |