Borenore Airbnb Market Analysis 2025: Short Term Rental Data & Vacation Rental Statistics in New South Wales, Australia
Is Airbnb profitable in Borenore in 2025? Explore comprehensive Airbnb analytics for Borenore, New South Wales, Australia to uncover income potential. This 2025 STR market report for Borenore, based on AirROI data from April 2024 to March 2025, reveals key trends in the niche market of 17 active listings.
Whether you're considering an Airbnb investment in Borenore, optimizing your existing vacation rental, or exploring rental arbitrage opportunities, understanding the Borenore Airbnb data is crucial. Navigating the high regulation landscape is key to maximizing your short term rental income potential. Let's dive into the specifics.
Key Borenore Airbnb Performance Metrics Overview
Monthly Airbnb Revenue Variations & Income Potential in Borenore (2025)
Understanding the monthly revenue variations for Airbnb listings in Borenore is key to maximizing your short term rental income potential. Seasonality significantly impacts earnings. Our analysis, based on data from the past 12 months, shows that the peak revenue month for STRs in Borenore is typically July, while February often presents the lowest earnings, highlighting opportunities for strategic pricing adjustments during shoulder and low seasons. Explore the typical Airbnb income in Borenore across different performance tiers:
- Best-in-class properties (Top 10%) achieve $5,670+ monthly, often utilizing dynamic pricing and superior guest experiences.
- Strong performing properties (Top 25%) earn $3,683 or more, indicating effective management and desirable locations/amenities.
- Typical properties (Median) generate around $1,867 per month, representing the average market performance.
- Entry-level properties (Bottom 25%) see earnings around $1,041, often with potential for optimization.
Average Monthly Airbnb Earnings Trend in Borenore
Borenore Airbnb Occupancy Rate Trends (2025)
Maximize your bookings by understanding the Borenore STR occupancy trends. Seasonal demand shifts significantly influence how often properties are booked. Typically, Julysees the highest demand (peak season occupancy), while May experiences the lowest (low season). Effective strategies, like adjusting minimum stays or offering promotions, can boost occupancy during slower periods. Here's how different property tiers perform in Borenore:
- Best-in-class properties (Top 10%) achieve 64%+ occupancy, indicating high desirability and potentially optimized availability.
- Strong performing properties (Top 25%) maintain 49% or higher occupancy, suggesting good market fit and guest satisfaction.
- Typical properties (Median) have an occupancy rate around 32%.
- Entry-level properties (Bottom 25%) average 18% occupancy, potentially facing higher vacancy.
Average Monthly Occupancy Rate Trend in Borenore
Average Daily Rate (ADR) Airbnb Trends in Borenore (2025)
Effective short term rental pricing strategy in Borenore involves understanding monthly ADR fluctuations. The Average Daily Rate (ADR) for Airbnb in Borenore typically peaks in October and dips lowest during February. Leveraging Airbnb dynamic pricing tools or strategies based on this seasonality can significantly boost revenue. Here's a look at the typical nightly rates achieved:
- Best-in-class properties (Top 10%) command rates of $316+ per night, often due to premium features or locations.
- Strong performing properties (Top 25%) achieve nightly rates of $258 or more.
- Typical properties (Median) charge around $199 per night.
- Entry-level properties (Bottom 25%) earn around $149 per night.
Average Daily Rate (ADR) Trend by Month in Borenore
Get Live Borenore Market Intelligence 👇

Explore Real-time Analytics
Airbnb Seasonality Analysis & Trends in Borenore (2025)
Peak Season (July, April, June)
- Revenue averages $3,477 per month
- Occupancy rates average 39.9%
- Daily rates average $209
Shoulder Season
- Revenue averages $2,830 per month
- Occupancy maintains around 37.1%
- Daily rates hold near $211
Low Season (February, March, August)
- Revenue drops to average $1,740 per month
- Occupancy decreases to average 29.2%
- Daily rates adjust to average $204
Seasonality Insights for Borenore
- The Airbnb seasonality in Borenore shows highly seasonal trends requiring careful strategy. While the sections above show seasonal averages, it's also insightful to look at the extremes:
- During the high season, the absolute peak month showcases Borenore's highest earning potential, with monthly revenues capable of climbing to $3,575, occupancy reaching a high of 51.4%, and ADRs peaking at $218.
- Conversely, the slowest single month of the year, typically falling within the low season, marks the market's lowest point. In this month, revenue might dip to $1,186, occupancy could drop to 22.6%, and ADRs may adjust down to $202.
- Understanding both the seasonal averages and these monthly peaks and troughs in revenue, occupancy, and ADR is crucial for maximizing your Airbnb profit potential in Borenore.
Seasonal Strategies for Maximizing Profit
- Peak Season: Maximize revenue through premium pricing and potentially longer minimum stays. Ensure high availability.
- Low Season: Offer competitive pricing, special promotions (e.g., extended stay discounts), and flexible cancellation policies. Target off-season travelers like remote workers or budget-conscious guests.
- Shoulder Seasons: Implement dynamic pricing that balances peak and low rates. Target weekend travelers or specific events. Offer slightly more flexible terms than peak season.
- Regularly analyze your own performance against these Borenore seasonality benchmarks and adjust your pricing and availability strategy accordingly.
Best Areas for Airbnb Investment in Borenore (2025)
Exploring the top neighborhoods for short-term rentals in Borenore? This section highlights key areas, outlining why they are attractive for hosts and guests, along with notable local attractions. Consider these locations based on your target guest profile and investment strategy.
| Neighborhood / Area | Why Host Here? (Target Guests & Appeal) | Key Attractions & Landmarks |
|---|---|---|
| Orange | A charming town known for its wine production and proximity to the stunning Orange Wine Region. Ideal for those who want to experience local vineyards and fine dining. | Rieboldt Wines, Borenore Wines, Lake Canobolas, Orange Botanic Gardens, Orange Farmers Market, Mount Canobolas |
| Cowra | Known for its beautiful gardens and rich history, Cowra attracts tourists interested in history and nature. | Cowra Japanese Garden, Cowra Prisoner of War Camps, Cowra Golf Club, Cowra Art Gallery, Lachlan Valley Railway, Mansfield Park |
| Bathurst | A historic city famous for its motor racing and heritage sites. Offers a mix of adventure and culture for visitors. | Mount Panorama, Australian Fossil and Mineral Museum, Bathurst Gaol, Bathurst Regional Art Gallery, Abercrombie Caves, Chifley Home |
| Mudgee | A popular regional town known for its wine and culinary scene. Attracts food and wine enthusiasts looking for a getaway. | Mudgee Wines, Mudgee Markets, Mudgee Honey Haven, Baker Williams Distillery, Mudgee Golf Club, The Artisanal Kitchen |
| Dubbo | Home to the famous Taronga Western Plains Zoo, Dubbo is a great location for families and wildlife enthusiasts. | Taronga Western Plains Zoo, Dubbo Observatory, Old Dubbo Gaol, Dubbo Regional Botanical Gardens, Western Plains Cultural Centre, Dubbo Markets |
| Parkes | Known for the iconic Dish and its rich agricultural area, Parkes combines technology with rural charm. | Parkes Observatory, Parkes Elvis Festival, Bushman's Hill Reserve, Parkes Railway Station, Parkes Cultural Centre, Parkes Historical Society Museum |
| Wellington | A peaceful town famous for its beautiful landscapes and the nearby Wellington Caves, perfect for nature lovers. | Wellington Caves, The Old Dubbo Gaol, Wellington Soldiers' Memorial, Wellington Golf Club, Wellington Wetlands, Borenore Caves |
| Clare Valley | Renowned for its wine and scenic river landscapes, a prime destination for wine tourism with numerous attractions. | Clare Valley Wine Regions, Clare Valley Heritage Centre, Paulett Wines, Sevenhill Cellars, Krondorf Road, Clare National Park |
Understanding Airbnb License Requirements & STR Laws in Borenore (2025)
Yes, Borenore, New South Wales, Australia enforces high STR regulations. Obtaining a license and ensuring compliance is almost certainly required according to current 2025 STR laws. Always verify the latest short term rental regulations and Airbnb license requirements directly with local government authorities for Borenore to ensure full compliance before hosting.
(Source: AirROI data, 2025, based on 88% licensed listings)
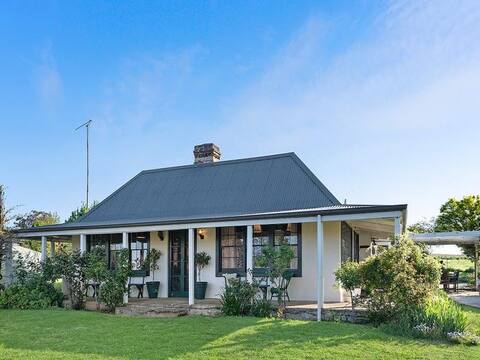
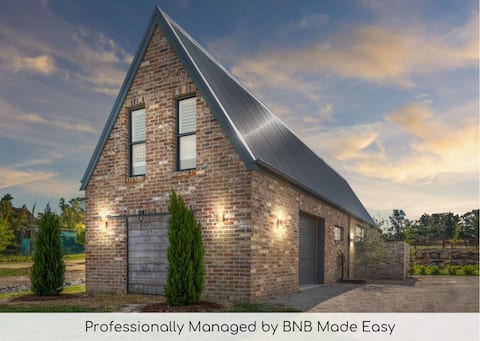
Top Performing Airbnb Properties in Borenore (2025)
Benchmark your potential! Explore examples of top-performing Airbnb properties in Borenorebased on Trailing Twelve Month (TTM) revenue. Analyze their characteristics, revenue, occupancy rate, and ADR to understand what drives success in this market.
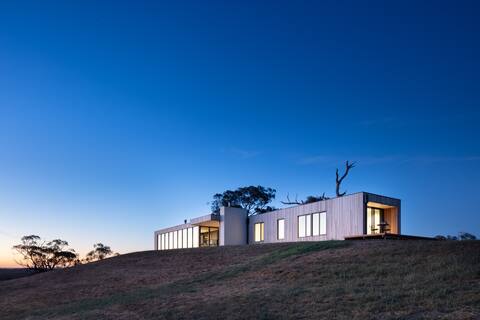
Spectacular Kangaroobie Cabin
Entire Place • 3 bedrooms

The Borenore Inn | Historic Charm, Entertainer
Entire Place • 5 bedrooms
Perfect farm stay near Orange.
Entire Place • 3 bedrooms

Cooinda Cottage - Beautiful Borenore Farm Stay
Entire Place • 3 bedrooms
Loft House - On Heifer Station Vineyard, Firepit
Entire Place • 2 bedrooms

Dragonfly Cottages (Cottage 1)
Entire Place • 1 bedroom
Note: Performance varies based on location, size, amenities, seasonality, and management quality. Data reflects the past 12 months.
Top Performing Airbnb Hosts in Borenore (2025)
Learn from the best! This table showcases top-performing Airbnb hosts in Borenore based on the number of properties managed and estimated total revenue over the past year. Analyze their scale and performance metrics.
| Host Name | Properties | Grossing Revenue | Stay Reviews | Avg Rating |
|---|---|---|---|---|
| BNB Made Easy: Timmy | 3 | $112,004 | 140 | 4.76/5.0 |
| Suzie | 1 | $100,923 | 21 | 5.00/5.0 |
| Nikki | 1 | $50,184 | 11 | 4.91/5.0 |
| Book Regional | 1 | $45,422 | 51 | 4.80/5.0 |
| Andrew | 1 | $27,314 | 97 | 4.97/5.0 |
| Josie | 2 | $20,957 | 241 | 4.99/5.0 |
| Jannene | 1 | $19,008 | 139 | 4.87/5.0 |
| Maggie | 1 | $15,422 | 344 | 4.94/5.0 |
| Lindall | 1 | $14,681 | 81 | 4.98/5.0 |
| Jeremy | 1 | $10,409 | 298 | 4.91/5.0 |
Analyzing the strategies of top hosts, such as their property selection, pricing, and guest communication, can offer valuable lessons for optimizing your own Airbnb operations in Borenore.
Dive Deeper: Advanced Borenore STR Market Data (2025)
Ready to unlock more insights? AirROI provides access to advanced metrics and comprehensive Airbnb data for Borenore. Explore detailed analytics beyond this report to refine your investment strategy, optimize pricing, and maximize your vacation rental profits.
Explore Advanced MetricsBorenore Short-Term Rental Market Composition (2025): Property & Room Types
Room Type Distribution
Property Type Distribution
Market Composition Insights for Borenore
- The Borenore Airbnb market composition is heavily skewed towards Entire Home/Apt listings, which make up 94.1% of the 17 active rentals. This indicates strong guest preference for privacy and space.
- Looking at the property type distribution in Borenore, House properties are the most common (76.5%), reflecting the local real estate landscape.
- Houses represent a significant 76.5% portion, catering likely to families or larger groups.
Borenore Airbnb Room Capacity Analysis (2025): Bedroom Distribution
Distribution of Listings by Number of Bedrooms
Room Capacity Insights for Borenore
- The dominant room capacity in Borenore is 2 bedrooms listings, making up 35.3% of the market. This suggests a strong demand for properties suitable for couples or solo travelers.
- Together, 2 bedrooms and 3 bedrooms properties represent 58.8% of the active Airbnb listings in Borenore, indicating a high concentration in these sizes.
- A significant 47.1% of listings offer 3+ bedrooms, catering to larger groups and families seeking more space in Borenore.
Borenore Vacation Rental Guest Capacity Trends (2025)
Distribution of Listings by Guest Capacity
Guest Capacity Insights for Borenore
- The most common guest capacity trend in Borenore vacation rentals is listings accommodating 4 guests (35.3%). This suggests the primary traveler segment is likely small families or groups.
- Properties designed for 4 guests and 8+ guests dominate the Borenore STR market, accounting for 70.6% of listings.
- 47.1% of properties accommodate 6+ guests, serving the market segment for larger families or group travel in Borenore.
- On average, properties in Borenore are equipped to host 5.2 guests.
Borenore Airbnb Booking Patterns (2025): Available vs. Booked Days
Available Days Distribution
Booked Days Distribution
Booking Pattern Insights for Borenore
- The most common availability pattern in Borenore falls within the 271-366 days range, representing 52.9% of listings. This suggests many properties have significant open periods on their calendars.
- Approximately 76.4% of listings show high availability (181+ days open annually), indicating potential for increased bookings or specific owner usage patterns.
- For booked days, the 31-90 days range is most frequent in Borenore (52.9%), reflecting common guest stay durations or potential owner blocking patterns.
- A notable 23.5% of properties secure long booking periods (181+ days booked per year), highlighting successful long-term rental strategies or significant owner usage.
Borenore Airbnb Minimum Stay Requirements Analysis
Distribution of Listings by Minimum Night Requirement
1 Night
3 listings
18.8% of total
2 Nights
9 listings
56.3% of total
4-6 Nights
1 listings
6.3% of total
30+ Nights
3 listings
18.8% of total
Key Insights
- The most prevalent minimum stay requirement in Borenore is 2 Nights, adopted by 56.3% of listings. This highlights the market's preference for shorter, flexible bookings.
- A strong majority (75.1%) of the Borenore Airbnb data shows acceptance of very short stays (1-2 nights), indicating a dynamic, high-turnover market.
- A significant segment (18.8%) caters to monthly stays (30+ nights) in Borenore, pointing to opportunities in the extended-stay market.
Recommendations
- Align with the market by considering a 2 Nights minimum stay, as 56.3% of Borenore hosts use this setting.
- If feasible, allowing 1-night stays, especially midweek or during low season, could capture last-minute bookings, as only 18.8% currently do.
- A 2-night minimum appears standard (56.3%). Consider this for weekends or peak periods.
- Explore offering discounts for stays of 30+ nights to attract the 18.8% of the market seeking extended stays.
- Adjust minimum nights based on seasonality – potentially shorter during low season and longer during peak demand periods in Borenore.
Borenore Airbnb Cancellation Policy Trends Analysis (2025)
Flexible
4 listings
26.7% of total
Moderate
6 listings
40% of total
Firm
2 listings
13.3% of total
Strict
3 listings
20% of total
Cancellation Policy Insights for Borenore
- The prevailing Airbnb cancellation policy trend in Borenore is Moderate, used by 40% of listings.
- There's a relatively balanced mix between guest-friendly (66.7%) and stricter (33.3%) policies, offering choices for different guest needs.
Recommendations for Hosts
- Consider adopting a Moderate policy to align with the 40% market standard in Borenore.
- Regularly review your cancellation policy against competitors and market demand shifts in Borenore.
Borenore STR Booking Lead Time Analysis (2025)
Average Booking Lead Time by Month
Booking Lead Time Insights for Borenore
- The overall average booking lead time for vacation rentals in Borenore is 45 days.
- Guests book furthest in advance for stays during December (average 81 days), likely coinciding with peak travel demand or local events.
- The shortest booking windows occur for stays in January (average 25 days), indicating more last-minute travel plans during this time.
- Seasonally, Spring (64 days avg.) sees the longest lead times, while Winter (45 days avg.) has the shortest, reflecting typical travel planning cycles.
Recommendations for Hosts
- Use the overall average lead time (45 days) as a baseline for your pricing and availability strategy in Borenore.
- For December stays, consider implementing length-of-stay discounts or slightly higher rates for bookings made less than 81 days out to capitalize on advance planning.
- Target marketing efforts for the Spring season well in advance (at least 64 days) to capture early planners.
- Monitor your own booking lead times against these Borenore averages to identify opportunities for dynamic pricing adjustments.
Popular & Essential Airbnb Amenities in Borenore (2025)
Amenity Prevalence
Amenity Insights for Borenore
- Essential amenities in Borenore that guests expect include: TV, Smoke alarm, Free parking on premises. Lacking these (any) could significantly impact bookings.
- Popular amenities like Kitchen, Air conditioning, Heating are common but not universal. Offering these can provide a competitive edge.
Recommendations for Hosts
- Ensure your listing includes all essential amenities for Borenore: TV, Smoke alarm, Free parking on premises.
- Consider adding popular differentiators like Kitchen or Air conditioning to increase appeal.
- Highlight unique or less common amenities you offer (e.g., hot tub, dedicated workspace, EV charger) in your listing description and photos.
- Regularly check competitor amenities in Borenore to stay competitive.
Borenore Airbnb Guest Demographics & Profile Analysis (2025)
Guest Profile Summary for Borenore
- The typical guest profile for Airbnb in Borenore consists of primarily domestic travelers (97%), often arriving from nearby Sydney, typically belonging to the Post-2000s (Gen Z/Alpha) group (50%), primarily speaking English or German.
- Domestic travelers account for 97.3% of guests.
- Key international markets include Australia (97.3%) and United Kingdom (1.6%).
- Top languages spoken are English (61.6%) followed by German (5.8%).
- A significant demographic segment is the Post-2000s (Gen Z/Alpha) group, representing 50% of guests.
Recommendations for Hosts
- Target domestic marketing efforts towards travelers from Sydney and New South Wales.
- Tailor amenities and listing descriptions to appeal to the dominant Post-2000s (Gen Z/Alpha) demographic (e.g., highlight fast WiFi, smart home features, local guides).
- Highlight unique local experiences or amenities relevant to the primary guest profile.
- Consider seasonal promotions aligned with peak travel times for key origin markets.
Nearby Short-Term Rental Market Comparison
How does the Borenore Airbnb market stack up against its neighbors? Compare key performance metrics like average monthly revenue, ADR, and occupancy rates in surrounding areas to understand the broader regional STR landscape.
| Market | Active Properties | Monthly Revenue | Daily Rate | Avg. Occupancy |
|---|---|---|---|---|
| Mid-Western Regional Council | 201 | $3,155 | $307.03 | 35% |
| Mudgee | 206 | $3,135 | $275.64 | 41% |
| Dubbo | 155 | $2,701 | $207.09 | 45% |
| Yass | 11 | $2,581 | $140.82 | 66% |
| Bathurst | 228 | $2,561 | $266.52 | 39% |
| Bathurst Regional Council | 31 | $2,500 | $241.77 | 35% |
| Orange | 342 | $2,478 | $200.33 | 43% |
| Cabonne Council | 42 | $2,406 | $226.23 | 34% |
| Oberon Council | 29 | $2,390 | $274.09 | 37% |
| Cowra | 11 | $2,384 | $171.53 | 47% |