Blackheath Airbnb Market Analysis 2025: Short Term Rental Data & Vacation Rental Statistics in New South Wales, Australia
Is Airbnb profitable in Blackheath in 2025? Explore comprehensive Airbnb analytics for Blackheath, New South Wales, Australia to uncover income potential. This 2025 STR market report for Blackheath, based on AirROI data from April 2024 to March 2025, reveals key trends in the market of 232 active listings.
Whether you're considering an Airbnb investment in Blackheath, optimizing your existing vacation rental, or exploring rental arbitrage opportunities, understanding the Blackheath Airbnb data is crucial. Navigating the high regulation landscape is key to maximizing your short term rental income potential. Let's dive into the specifics.
Key Blackheath Airbnb Performance Metrics Overview
Monthly Airbnb Revenue Variations & Income Potential in Blackheath (2025)
Understanding the monthly revenue variations for Airbnb listings in Blackheath is key to maximizing your short term rental income potential. Seasonality significantly impacts earnings. Our analysis, based on data from the past 12 months, shows that the peak revenue month for STRs in Blackheath is typically July, while February often presents the lowest earnings, highlighting opportunities for strategic pricing adjustments during shoulder and low seasons. Explore the typical Airbnb income in Blackheath across different performance tiers:
- Best-in-class properties (Top 10%) achieve $6,636+ monthly, often utilizing dynamic pricing and superior guest experiences.
- Strong performing properties (Top 25%) earn $4,412 or more, indicating effective management and desirable locations/amenities.
- Typical properties (Median) generate around $2,765 per month, representing the average market performance.
- Entry-level properties (Bottom 25%) see earnings around $1,539, often with potential for optimization.
Average Monthly Airbnb Earnings Trend in Blackheath
Blackheath Airbnb Occupancy Rate Trends (2025)
Maximize your bookings by understanding the Blackheath STR occupancy trends. Seasonal demand shifts significantly influence how often properties are booked. Typically, Julysees the highest demand (peak season occupancy), while February experiences the lowest (low season). Effective strategies, like adjusting minimum stays or offering promotions, can boost occupancy during slower periods. Here's how different property tiers perform in Blackheath:
- Best-in-class properties (Top 10%) achieve 79%+ occupancy, indicating high desirability and potentially optimized availability.
- Strong performing properties (Top 25%) maintain 62% or higher occupancy, suggesting good market fit and guest satisfaction.
- Typical properties (Median) have an occupancy rate around 40%.
- Entry-level properties (Bottom 25%) average 24% occupancy, potentially facing higher vacancy.
Average Monthly Occupancy Rate Trend in Blackheath
Average Daily Rate (ADR) Airbnb Trends in Blackheath (2025)
Effective short term rental pricing strategy in Blackheath involves understanding monthly ADR fluctuations. The Average Daily Rate (ADR) for Airbnb in Blackheath typically peaks in January and dips lowest during February. Leveraging Airbnb dynamic pricing tools or strategies based on this seasonality can significantly boost revenue. Here's a look at the typical nightly rates achieved:
- Best-in-class properties (Top 10%) command rates of $433+ per night, often due to premium features or locations.
- Strong performing properties (Top 25%) achieve nightly rates of $288 or more.
- Typical properties (Median) charge around $201 per night.
- Entry-level properties (Bottom 25%) earn around $146 per night.
Average Daily Rate (ADR) Trend by Month in Blackheath
Get Live Blackheath Market Intelligence 👇

Explore Real-time Analytics
Airbnb Seasonality Analysis & Trends in Blackheath (2025)
Peak Season (July, June, April)
- Revenue averages $4,309 per month
- Occupancy rates average 48.8%
- Daily rates average $250
Shoulder Season
- Revenue averages $3,500 per month
- Occupancy maintains around 43.6%
- Daily rates hold near $253
Low Season (February, March, November)
- Revenue drops to average $2,522 per month
- Occupancy decreases to average 37.3%
- Daily rates adjust to average $246
Seasonality Insights for Blackheath
- The Airbnb seasonality in Blackheath shows moderate seasonality with distinct peak and low periods. While the sections above show seasonal averages, it's also insightful to look at the extremes:
- During the high season, the absolute peak month showcases Blackheath's highest earning potential, with monthly revenues capable of climbing to $4,483, occupancy reaching a high of 54.7%, and ADRs peaking at $263.
- Conversely, the slowest single month of the year, typically falling within the low season, marks the market's lowest point. In this month, revenue might dip to $2,079, occupancy could drop to 35.2%, and ADRs may adjust down to $240.
- Understanding both the seasonal averages and these monthly peaks and troughs in revenue, occupancy, and ADR is crucial for maximizing your Airbnb profit potential in Blackheath.
Seasonal Strategies for Maximizing Profit
- Peak Season: Maximize revenue through premium pricing and potentially longer minimum stays. Ensure high availability.
- Low Season: Offer competitive pricing, special promotions (e.g., extended stay discounts), and flexible cancellation policies. Target off-season travelers like remote workers or budget-conscious guests.
- Shoulder Seasons: Implement dynamic pricing that balances peak and low rates. Target weekend travelers or specific events. Offer slightly more flexible terms than peak season.
- Regularly analyze your own performance against these Blackheath seasonality benchmarks and adjust your pricing and availability strategy accordingly.
Best Areas for Airbnb Investment in Blackheath (2025)
Exploring the top neighborhoods for short-term rentals in Blackheath? This section highlights key areas, outlining why they are attractive for hosts and guests, along with notable local attractions. Consider these locations based on your target guest profile and investment strategy.
| Neighborhood / Area | Why Host Here? (Target Guests & Appeal) | Key Attractions & Landmarks |
|---|---|---|
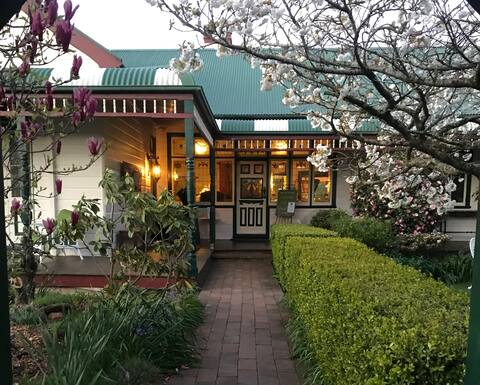
| Blackheath Village | The charming village center offers a variety of cafes, shops, and access to scenic lookouts, attracting visitors looking for a quaint mountain town experience. | Blackheath Grain Store, Govetts Leap Lookout, Blackheath Soldiers Memorial Park, Pulpit Rock Lookout, Blackheath History Forum |
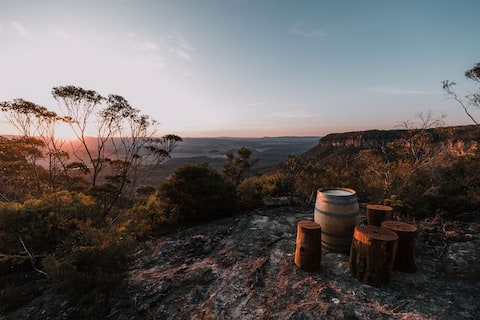
| The Blue Mountains National Park | A UNESCO World Heritage site known for its stunning natural beauty, ideal for nature lovers and hikers. The park attracts tourists year-round for its breathtaking landscapes and outdoor activities. | Three Sisters, Wentworth Falls, Jenolan Caves, Glenbrook National Park, Bimberi Peak |
| Mount Blackheath | Offers breathtaking panoramic views and is a popular destination for outdoor enthusiasts, including mountain biking and bushwalking, making it appealing for active travelers. | Mount Blackheath Lookout, Parks and reserves, Walking trails |
| Govetts Leap | Known for its breathtaking waterfall views and hiking trails, making it a popular spot for tourists and nature lovers seeking immersive experiences in nature. | Govetts Leap Lookout, Closeburn, Cliff View Lookout |
| Hat Hill Road | A scenic road with beautiful views and proximity to nature walks, appealing to those who want a peaceful retreat close to nature. | Nature walks, Scenic lookouts, Local flora and fauna |
| Blackheath Golf Club | Offers leisure and recreational activities for visitors, attracting golf enthusiasts and those looking to relax in a picturesque outdoor setting. | Golf courses, Clubhouse amenities, Social events |
| Blue Mountains Botanic Garden | Located nearby, it features a diverse range of plants and is a popular destination for visitors interested in flora, photography, and leisurely walks. | Botanical gardens, Native plants, Photography spots |
| Cliff Drive | A scenic drive with stunning views of the mountains and valleys, popular among tourists for breathtaking drives and lookout points. | Lookout spots, Picnic areas, Scenic drives |
Understanding Airbnb License Requirements & STR Laws in Blackheath (2025)
Yes, Blackheath, New South Wales, Australia enforces high STR regulations. Obtaining a license and ensuring compliance is almost certainly required according to current 2025 STR laws. Always verify the latest short term rental regulations and Airbnb license requirements directly with local government authorities for Blackheath to ensure full compliance before hosting.
(Source: AirROI data, 2025, based on 92% licensed listings)
Top Performing Airbnb Properties in Blackheath (2025)
Benchmark your potential! Explore examples of top-performing Airbnb properties in Blackheathbased on Trailing Twelve Month (TTM) revenue. Analyze their characteristics, revenue, occupancy rate, and ADR to understand what drives success in this market.
Grand Heritage House in Blackheath sleeps 14 to 30
Entire Place • 15 bedrooms

Historic luxury home with 7 bedrooms & 7 bathrooms
Entire Place • 7 bedrooms
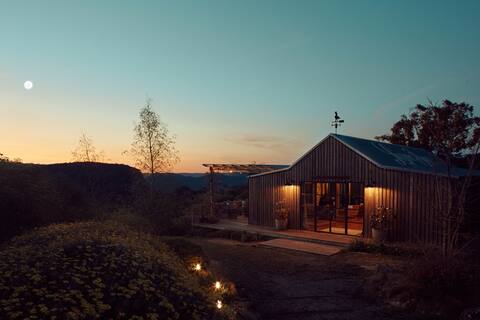
Wildacres 40 Acre Bush Haven & Private Cliffs
Entire Place • 2 bedrooms
A Romantic Orchard Escape in The Blue Mountains
Entire Place • N/A

Megalong Valley Station: Glenbarry
Entire Place • 5 bedrooms
The Heights - entire luxury home.
Entire Place • 4 bedrooms
Note: Performance varies based on location, size, amenities, seasonality, and management quality. Data reflects the past 12 months.
Top Performing Airbnb Hosts in Blackheath (2025)
Learn from the best! This table showcases top-performing Airbnb hosts in Blackheath based on the number of properties managed and estimated total revenue over the past year. Analyze their scale and performance metrics.
| Host Name | Properties | Grossing Revenue | Stay Reviews | Avg Rating |
|---|---|---|---|---|
| BlueMtsEscapes | 29 | $1,036,641 | 701 | 4.57/5.0 |
| Kerrith Offner | 5 | $361,685 | 132 | 4.88/5.0 |
| Peter | 4 | $221,275 | 310 | 4.99/5.0 |
| Margaret And Rowan | 1 | $208,350 | 26 | 5.00/5.0 |
| Brett | 1 | $190,654 | 98 | 4.98/5.0 |
| Patricia | 3 | $170,781 | 376 | 4.97/5.0 |
| Wendy | 5 | $170,130 | 498 | 4.68/5.0 |
| Joel | 8 | $166,177 | 1342 | 4.89/5.0 |
| Kristian | 1 | $161,437 | 34 | 4.97/5.0 |
| Malina | 3 | $145,478 | 209 | 4.89/5.0 |
Analyzing the strategies of top hosts, such as their property selection, pricing, and guest communication, can offer valuable lessons for optimizing your own Airbnb operations in Blackheath.
Dive Deeper: Advanced Blackheath STR Market Data (2025)
Ready to unlock more insights? AirROI provides access to advanced metrics and comprehensive Airbnb data for Blackheath. Explore detailed analytics beyond this report to refine your investment strategy, optimize pricing, and maximize your vacation rental profits.
Explore Advanced MetricsBlackheath Short-Term Rental Market Composition (2025): Property & Room Types
Room Type Distribution
Property Type Distribution
Market Composition Insights for Blackheath
- The Blackheath Airbnb market composition is heavily skewed towards Entire Home/Apt listings, which make up 93.1% of the 232 active rentals. This indicates strong guest preference for privacy and space.
- Looking at the property type distribution in Blackheath, House properties are the most common (78.4%), reflecting the local real estate landscape.
- Houses represent a significant 78.4% portion, catering likely to families or larger groups.
- The presence of 5.2% Hotel/Boutique listings indicates integration with traditional hospitality.
- Smaller segments like apartment/condo (combined 0.9%) offer potential for unique stay experiences.
Blackheath Airbnb Room Capacity Analysis (2025): Bedroom Distribution
Distribution of Listings by Number of Bedrooms
Room Capacity Insights for Blackheath
- The dominant room capacity in Blackheath is 3 bedrooms listings, making up 34.5% of the market. This suggests a strong demand for properties suitable for families or small groups.
- Together, 3 bedrooms and 2 bedrooms properties represent 57.8% of the active Airbnb listings in Blackheath, indicating a high concentration in these sizes.
- A significant 54.3% of listings offer 3+ bedrooms, catering to larger groups and families seeking more space in Blackheath.
Blackheath Vacation Rental Guest Capacity Trends (2025)
Distribution of Listings by Guest Capacity
Guest Capacity Insights for Blackheath
- The most common guest capacity trend in Blackheath vacation rentals is listings accommodating 6 guests (27.6%). This suggests the primary traveler segment is likely larger groups.
- Properties designed for 6 guests and 4 guests dominate the Blackheath STR market, accounting for 50.0% of listings.
- 51.7% of properties accommodate 6+ guests, serving the market segment for larger families or group travel in Blackheath.
- On average, properties in Blackheath are equipped to host 5.1 guests.
Blackheath Airbnb Booking Patterns (2025): Available vs. Booked Days
Available Days Distribution
Booked Days Distribution
Booking Pattern Insights for Blackheath
- The most common availability pattern in Blackheath falls within the 181-270 days range, representing 40.1% of listings. This suggests many properties have significant open periods on their calendars.
- Approximately 67.7% of listings show high availability (181+ days open annually), indicating potential for increased bookings or specific owner usage patterns.
- For booked days, the 91-180 days range is most frequent in Blackheath (39.7%), reflecting common guest stay durations or potential owner blocking patterns.
- A notable 34.9% of properties secure long booking periods (181+ days booked per year), highlighting successful long-term rental strategies or significant owner usage.
Blackheath Airbnb Minimum Stay Requirements Analysis
Distribution of Listings by Minimum Night Requirement
1 Night
23 listings
10.3% of total
2 Nights
126 listings
56.3% of total
3 Nights
5 listings
2.2% of total
4-6 Nights
2 listings
0.9% of total
30+ Nights
68 listings
30.4% of total
Key Insights
- The most prevalent minimum stay requirement in Blackheath is 2 Nights, adopted by 56.3% of listings. This highlights the market's preference for shorter, flexible bookings.
- A strong majority (66.6%) of the Blackheath Airbnb data shows acceptance of very short stays (1-2 nights), indicating a dynamic, high-turnover market.
- A significant segment (30.4%) caters to monthly stays (30+ nights) in Blackheath, pointing to opportunities in the extended-stay market.
Recommendations
- Align with the market by considering a 2 Nights minimum stay, as 56.3% of Blackheath hosts use this setting.
- If feasible, allowing 1-night stays, especially midweek or during low season, could capture last-minute bookings, as only 10.3% currently do.
- A 2-night minimum appears standard (56.3%). Consider this for weekends or peak periods.
- Explore offering discounts for stays of 30+ nights to attract the 30.4% of the market seeking extended stays.
- Adjust minimum nights based on seasonality – potentially shorter during low season and longer during peak demand periods in Blackheath.
Blackheath Airbnb Cancellation Policy Trends Analysis (2025)
Super Strict 30 Days
6 listings
2.7% of total
Super Strict 60 Days
32 listings
14.6% of total
Flexible
18 listings
8.2% of total
Moderate
65 listings
29.7% of total
Firm
58 listings
26.5% of total
Strict
40 listings
18.3% of total
Cancellation Policy Insights for Blackheath
- The prevailing Airbnb cancellation policy trend in Blackheath is Moderate, used by 29.7% of listings.
- There's a relatively balanced mix between guest-friendly (37.9%) and stricter (44.8%) policies, offering choices for different guest needs.
Recommendations for Hosts
- Consider adopting a Moderate policy to align with the 29.7% market standard in Blackheath.
- Regularly review your cancellation policy against competitors and market demand shifts in Blackheath.
Blackheath STR Booking Lead Time Analysis (2025)
Average Booking Lead Time by Month
Booking Lead Time Insights for Blackheath
- The overall average booking lead time for vacation rentals in Blackheath is 52 days.
- Guests book furthest in advance for stays during May (average 91 days), likely coinciding with peak travel demand or local events.
- The shortest booking windows occur for stays in February (average 36 days), indicating more last-minute travel plans during this time.
- Seasonally, Spring (65 days avg.) sees the longest lead times, while Summer (48 days avg.) has the shortest, reflecting typical travel planning cycles.
Recommendations for Hosts
- Use the overall average lead time (52 days) as a baseline for your pricing and availability strategy in Blackheath.
- For May stays, consider implementing length-of-stay discounts or slightly higher rates for bookings made less than 91 days out to capitalize on advance planning.
- Target marketing efforts for the Spring season well in advance (at least 65 days) to capture early planners.
- Monitor your own booking lead times against these Blackheath averages to identify opportunities for dynamic pricing adjustments.
Popular & Essential Airbnb Amenities in Blackheath (2025)
Amenity Prevalence
Amenity Insights for Blackheath
- Essential amenities in Blackheath that guests expect include: Smoke alarm, Heating, Essentials, Hot water. Lacking these (any) could significantly impact bookings.
- Popular amenities like Refrigerator, Free parking on premises, TV are common but not universal. Offering these can provide a competitive edge.
- Warning: Wifi is not universally provided but is considered essential globally. Ensure reliable Wifi is offered.
Recommendations for Hosts
- Ensure your listing includes all essential amenities for Blackheath: Smoke alarm, Heating, Essentials, Hot water.
- Prioritize adding missing essentials: Smoke alarm, Heating, Essentials, Hot water.
- Consider adding popular differentiators like Refrigerator or Free parking on premises to increase appeal.
- Highlight unique or less common amenities you offer (e.g., hot tub, dedicated workspace, EV charger) in your listing description and photos.
- Regularly check competitor amenities in Blackheath to stay competitive.
Blackheath Airbnb Guest Demographics & Profile Analysis (2025)
Guest Profile Summary for Blackheath
- The typical guest profile for Airbnb in Blackheath consists of primarily domestic travelers (87%), often arriving from nearby Sydney, typically belonging to the Post-2000s (Gen Z/Alpha) group (50%), primarily speaking English or French.
- Domestic travelers account for 86.5% of guests.
- Key international markets include Australia (86.5%) and United Kingdom (3.6%).
- Top languages spoken are English (68.1%) followed by French (6.5%).
- A significant demographic segment is the Post-2000s (Gen Z/Alpha) group, representing 50% of guests.
Recommendations for Hosts
- Target domestic marketing efforts towards travelers from Sydney and New South Wales.
- Tailor amenities and listing descriptions to appeal to the dominant Post-2000s (Gen Z/Alpha) demographic (e.g., highlight fast WiFi, smart home features, local guides).
- Highlight unique local experiences or amenities relevant to the primary guest profile.
- Consider seasonal promotions aligned with peak travel times for key origin markets.
Nearby Short-Term Rental Market Comparison
How does the Blackheath Airbnb market stack up against its neighbors? Compare key performance metrics like average monthly revenue, ADR, and occupancy rates in surrounding areas to understand the broader regional STR landscape.
| Market | Active Properties | Monthly Revenue | Daily Rate | Avg. Occupancy |
|---|---|---|---|---|
| Penrose | 12 | $6,349 | $600.00 | 42% |
| Berry | 115 | $6,185 | $540.04 | 41% |
| Jaspers Brush | 13 | $5,600 | $510.06 | 37% |
| Burrawang | 11 | $5,005 | $523.75 | 43% |
| Berrima | 44 | $4,756 | $426.34 | 42% |
| Robertson | 44 | $4,655 | $375.71 | 40% |
| Dora Creek | 17 | $4,613 | $370.02 | 45% |
| Bombo | 10 | $4,613 | $503.00 | 39% |
| Exeter | 30 | $4,595 | $519.08 | 38% |
| Gerringong | 121 | $4,483 | $486.76 | 37% |