Albury Airbnb Market Analysis 2025: Short Term Rental Data & Vacation Rental Statistics in New South Wales, Australia
Is Airbnb profitable in Albury in 2025? Explore comprehensive Airbnb analytics for Albury, New South Wales, Australia to uncover income potential. This 2025 STR market report for Albury, based on AirROI data from April 2024 to March 2025, reveals key trends in the niche market of 193 active listings.
Whether you're considering an Airbnb investment in Albury, optimizing your existing vacation rental, or exploring rental arbitrage opportunities, understanding the Albury Airbnb data is crucial. Navigating the high regulation landscape is key to maximizing your short term rental income potential. Let's dive into the specifics.
Key Albury Airbnb Performance Metrics Overview
Monthly Airbnb Revenue Variations & Income Potential in Albury (2025)
Understanding the monthly revenue variations for Airbnb listings in Albury is key to maximizing your short term rental income potential. Seasonality significantly impacts earnings. Our analysis, based on data from the past 12 months, shows that the peak revenue month for STRs in Albury is typically April, while February often presents the lowest earnings, highlighting opportunities for strategic pricing adjustments during shoulder and low seasons. Explore the typical Airbnb income in Albury across different performance tiers:
- Best-in-class properties (Top 10%) achieve $4,858+ monthly, often utilizing dynamic pricing and superior guest experiences.
- Strong performing properties (Top 25%) earn $3,561 or more, indicating effective management and desirable locations/amenities.
- Typical properties (Median) generate around $2,393 per month, representing the average market performance.
- Entry-level properties (Bottom 25%) see earnings around $1,390, often with potential for optimization.
Average Monthly Airbnb Earnings Trend in Albury
Albury Airbnb Occupancy Rate Trends (2025)
Maximize your bookings by understanding the Albury STR occupancy trends. Seasonal demand shifts significantly influence how often properties are booked. Typically, Decembersees the highest demand (peak season occupancy), while March experiences the lowest (low season). Effective strategies, like adjusting minimum stays or offering promotions, can boost occupancy during slower periods. Here's how different property tiers perform in Albury:
- Best-in-class properties (Top 10%) achieve 87%+ occupancy, indicating high desirability and potentially optimized availability.
- Strong performing properties (Top 25%) maintain 75% or higher occupancy, suggesting good market fit and guest satisfaction.
- Typical properties (Median) have an occupancy rate around 56%.
- Entry-level properties (Bottom 25%) average 32% occupancy, potentially facing higher vacancy.
Average Monthly Occupancy Rate Trend in Albury
Average Daily Rate (ADR) Airbnb Trends in Albury (2025)
Effective short term rental pricing strategy in Albury involves understanding monthly ADR fluctuations. The Average Daily Rate (ADR) for Airbnb in Albury typically peaks in December and dips lowest during May. Leveraging Airbnb dynamic pricing tools or strategies based on this seasonality can significantly boost revenue. Here's a look at the typical nightly rates achieved:
- Best-in-class properties (Top 10%) command rates of $243+ per night, often due to premium features or locations.
- Strong performing properties (Top 25%) achieve nightly rates of $189 or more.
- Typical properties (Median) charge around $142 per night.
- Entry-level properties (Bottom 25%) earn around $107 per night.
Average Daily Rate (ADR) Trend by Month in Albury
Get Live Albury Market Intelligence 👇

Explore Real-time Analytics
Airbnb Seasonality Analysis & Trends in Albury (2025)
Peak Season (April, December, January)
- Revenue averages $3,107 per month
- Occupancy rates average 57.9%
- Daily rates average $165
Shoulder Season
- Revenue averages $2,691 per month
- Occupancy maintains around 53.8%
- Daily rates hold near $156
Low Season (February, March, August)
- Revenue drops to average $2,132 per month
- Occupancy decreases to average 49.3%
- Daily rates adjust to average $156
Seasonality Insights for Albury
- The Airbnb seasonality in Albury shows moderate seasonality with distinct peak and low periods. While the sections above show seasonal averages, it's also insightful to look at the extremes:
- During the high season, the absolute peak month showcases Albury's highest earning potential, with monthly revenues capable of climbing to $3,196, occupancy reaching a high of 59.6%, and ADRs peaking at $171.
- Conversely, the slowest single month of the year, typically falling within the low season, marks the market's lowest point. In this month, revenue might dip to $2,105, occupancy could drop to 48.1%, and ADRs may adjust down to $153.
- Understanding both the seasonal averages and these monthly peaks and troughs in revenue, occupancy, and ADR is crucial for maximizing your Airbnb profit potential in Albury.
Seasonal Strategies for Maximizing Profit
- Peak Season: Maximize revenue through premium pricing and potentially longer minimum stays. Ensure high availability.
- Low Season: Offer competitive pricing, special promotions (e.g., extended stay discounts), and flexible cancellation policies. Target off-season travelers like remote workers or budget-conscious guests.
- Shoulder Seasons: Implement dynamic pricing that balances peak and low rates. Target weekend travelers or specific events. Offer slightly more flexible terms than peak season.
- Regularly analyze your own performance against these Albury seasonality benchmarks and adjust your pricing and availability strategy accordingly.
Best Areas for Airbnb Investment in Albury (2025)
Exploring the top neighborhoods for short-term rentals in Albury? This section highlights key areas, outlining why they are attractive for hosts and guests, along with notable local attractions. Consider these locations based on your target guest profile and investment strategy.
| Neighborhood / Area | Why Host Here? (Target Guests & Appeal) | Key Attractions & Landmarks |
|---|---|---|
| Central Albury | The bustling heart of Albury with shops, cafes, and restaurants. Ideal for travelers wanting to experience local life and easy access to amenities. | Albury Botanic Gardens, MAMA - Murray Art Museum Albury, Albury Railway Station, The Cube Albury, Shopping at Albury Central |
| Albury Riverside | A scenic area along the Murray River offering beautiful views and outdoor activities. Great for nature lovers and families. | Murray River, Noreuil Park, Wonga Wetlands, Albury Sportsgrounds, Walking and cycling paths |
| East Albury | A quiet residential area with easy access to central Albury. Offers a relaxed atmosphere and is popular with families. | Eastern Hill Rotary Lookout, Botanic Gardens, Local parks, Family-friendly cafes, Albury Swim Centre |
| Lavington | A developing suburb of Albury, known for its shopping centers and schools. Attracts visitors looking for suburban comfort and convenience. | Lavington Square, Lavington Sports Ground, Local cafes, Nearby parks, Nearby sporting facilities |
| North Albury | A family-friendly area with parks and schools. Attractive for visitors wanting a peaceful stay close to Albury's amenities. | Kremur Street Park, Lavington Panthers, Local shops, Nearby restaurants, Community events |
| West Albury | Offers a more rural feel but with proximity to the city center. Ideal for those seeking tranquility while still being close to attractions. | Wodonga Place, Local vineyards, Walking tracks along the river, Parks, Community market |
| South Albury | Centrally located, close to many parks and recreational facilities. Popular for its accessibility to the city and recreational spaces. | Albury Showgrounds, Graham Park, Local dining options, Nearby shopping centers, Walking and cycling paths |
| Albury CBD | The commercial center with numerous restaurants, shops, and cultural attractions. No better spot for tourists looking to be in the thick of things. | Albury Entertainment Centre, Local art galleries, Shopping precinct, Dining options, Nearby historical sites |
Understanding Airbnb License Requirements & STR Laws in Albury (2025)
Yes, Albury, New South Wales, Australia enforces high STR regulations. Obtaining a license and ensuring compliance is almost certainly required according to current 2025 STR laws. Always verify the latest short term rental regulations and Airbnb license requirements directly with local government authorities for Albury to ensure full compliance before hosting.
(Source: AirROI data, 2025, based on 90% licensed listings)
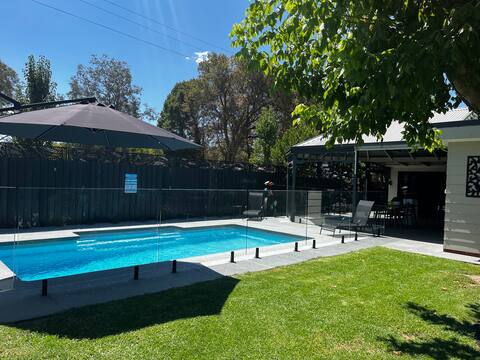
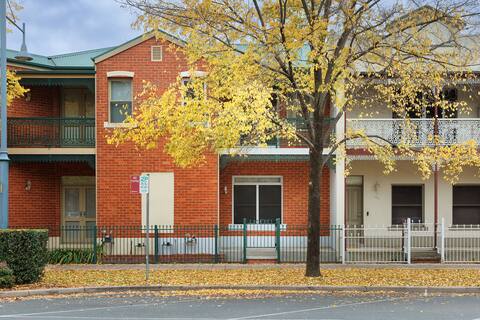
Top Performing Airbnb Properties in Albury (2025)
Benchmark your potential! Explore examples of top-performing Airbnb properties in Alburybased on Trailing Twelve Month (TTM) revenue. Analyze their characteristics, revenue, occupancy rate, and ADR to understand what drives success in this market.
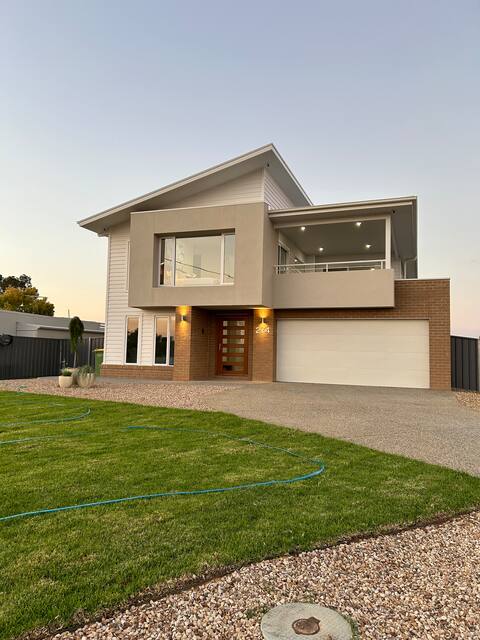
Highview Luxury Escape
Entire Place • 5 bedrooms
Family entertainer
Entire Place • 3 bedrooms
The Gardens Twin Townhouses
Entire Place • 6 bedrooms
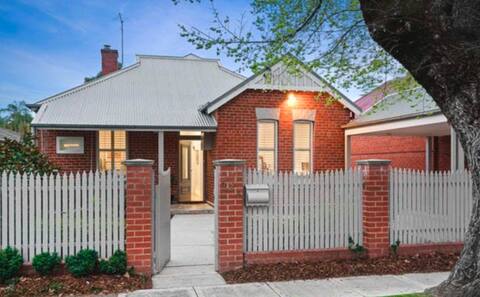
Absolute Central 4 BR 2.5 Bath Red Brick Home
Entire Place • 4 bedrooms

Albury Funk
Entire Place • 4 bedrooms
'Braeside'- Victoria St's Secret
Entire Place • 4 bedrooms
Note: Performance varies based on location, size, amenities, seasonality, and management quality. Data reflects the past 12 months.
Top Performing Airbnb Hosts in Albury (2025)
Learn from the best! This table showcases top-performing Airbnb hosts in Albury based on the number of properties managed and estimated total revenue over the past year. Analyze their scale and performance metrics.
| Host Name | Properties | Grossing Revenue | Stay Reviews | Avg Rating |
|---|---|---|---|---|
| Jane | 24 | $726,900 | 1145 | 4.06/5.0 |
| Terry And Row | 10 | $335,220 | 1445 | 4.93/5.0 |
| Hayley | 9 | $245,190 | 99 | 3.47/5.0 |
| Jack | 4 | $227,810 | 556 | 4.83/5.0 |
| Dan & Amanda | 6 | $194,137 | 550 | 4.90/5.0 |
| Catherine | 5 | $124,910 | 469 | 4.80/5.0 |
| Jake | 2 | $124,652 | 69 | 4.80/5.0 |
| Nicole | 6 | $122,418 | 1183 | 4.68/5.0 |
| Gayle | 5 | $109,707 | 291 | 4.62/5.0 |
| Kerrie | 7 | $104,375 | 209 | 4.03/5.0 |
Analyzing the strategies of top hosts, such as their property selection, pricing, and guest communication, can offer valuable lessons for optimizing your own Airbnb operations in Albury.
Dive Deeper: Advanced Albury STR Market Data (2025)
Ready to unlock more insights? AirROI provides access to advanced metrics and comprehensive Airbnb data for Albury. Explore detailed analytics beyond this report to refine your investment strategy, optimize pricing, and maximize your vacation rental profits.
Explore Advanced MetricsAlbury Short-Term Rental Market Composition (2025): Property & Room Types
Room Type Distribution
Property Type Distribution
Market Composition Insights for Albury
- The Albury Airbnb market composition is heavily skewed towards Entire Home/Apt listings, which make up 91.2% of the 193 active rentals. This indicates strong guest preference for privacy and space.
- Looking at the property type distribution in Albury, House properties are the most common (59.1%), reflecting the local real estate landscape.
- Houses represent a significant 59.1% portion, catering likely to families or larger groups.
- The presence of 8.8% Hotel/Boutique listings indicates integration with traditional hospitality.
- Smaller segments like outdoor/unique (combined 0.5%) offer potential for unique stay experiences.
Albury Airbnb Room Capacity Analysis (2025): Bedroom Distribution
Distribution of Listings by Number of Bedrooms
Room Capacity Insights for Albury
- The dominant room capacity in Albury is 3 bedrooms listings, making up 31.6% of the market. This suggests a strong demand for properties suitable for families or small groups.
- Together, 3 bedrooms and 2 bedrooms properties represent 61.1% of the active Airbnb listings in Albury, indicating a high concentration in these sizes.
- A significant 44.6% of listings offer 3+ bedrooms, catering to larger groups and families seeking more space in Albury.
Albury Vacation Rental Guest Capacity Trends (2025)
Distribution of Listings by Guest Capacity
Guest Capacity Insights for Albury
- The most common guest capacity trend in Albury vacation rentals is listings accommodating 6 guests (26.4%). This suggests the primary traveler segment is likely larger groups.
- Properties designed for 6 guests and 4 guests dominate the Albury STR market, accounting for 52.3% of listings.
- 46.1% of properties accommodate 6+ guests, serving the market segment for larger families or group travel in Albury.
- On average, properties in Albury are equipped to host 4.8 guests.
Albury Airbnb Booking Patterns (2025): Available vs. Booked Days
Available Days Distribution
Booked Days Distribution
Booking Pattern Insights for Albury
- The most common availability pattern in Albury falls within the 91-180 days range, representing 36.3% of listings. This suggests many properties have significant open periods on their calendars.
- Approximately 50.3% of listings show high availability (181+ days open annually), indicating potential for increased bookings or specific owner usage patterns.
- For booked days, the 181-270 days range is most frequent in Albury (36.3%), reflecting common guest stay durations or potential owner blocking patterns.
- A notable 51.8% of properties secure long booking periods (181+ days booked per year), highlighting successful long-term rental strategies or significant owner usage.
Albury Airbnb Minimum Stay Requirements Analysis
Distribution of Listings by Minimum Night Requirement
1 Night
54 listings
29.2% of total
2 Nights
56 listings
30.3% of total
3 Nights
5 listings
2.7% of total
4-6 Nights
8 listings
4.3% of total
7-29 Nights
5 listings
2.7% of total
30+ Nights
57 listings
30.8% of total
Key Insights
- The most prevalent minimum stay requirement in Albury is 30+ Nights, adopted by 30.8% of listings. This highlights the market's preference for longer commitments.
- A significant segment (30.8%) caters to monthly stays (30+ nights) in Albury, pointing to opportunities in the extended-stay market.
Recommendations
- Align with the market by considering a 30+ Nights minimum stay, as 30.8% of Albury hosts use this setting.
- If feasible, allowing 1-night stays, especially midweek or during low season, could capture last-minute bookings, as only 29.2% currently do.
- Explore offering discounts for stays of 30+ nights to attract the 30.8% of the market seeking extended stays.
- Adjust minimum nights based on seasonality – potentially shorter during low season and longer during peak demand periods in Albury.
Albury Airbnb Cancellation Policy Trends Analysis (2025)
Flexible
40 listings
22.7% of total
Moderate
70 listings
39.8% of total
Firm
24 listings
13.6% of total
Strict
42 listings
23.9% of total
Cancellation Policy Insights for Albury
- The prevailing Airbnb cancellation policy trend in Albury is Moderate, used by 39.8% of listings.
- There's a relatively balanced mix between guest-friendly (62.5%) and stricter (37.5%) policies, offering choices for different guest needs.
Recommendations for Hosts
- Consider adopting a Moderate policy to align with the 39.8% market standard in Albury.
- Regularly review your cancellation policy against competitors and market demand shifts in Albury.
Albury STR Booking Lead Time Analysis (2025)
Average Booking Lead Time by Month
Booking Lead Time Insights for Albury
- The overall average booking lead time for vacation rentals in Albury is 49 days.
- Guests book furthest in advance for stays during December (average 63 days), likely coinciding with peak travel demand or local events.
- The shortest booking windows occur for stays in August (average 37 days), indicating more last-minute travel plans during this time.
- Seasonally, Winter (55 days avg.) sees the longest lead times, while Summer (47 days avg.) has the shortest, reflecting typical travel planning cycles.
Recommendations for Hosts
- Use the overall average lead time (49 days) as a baseline for your pricing and availability strategy in Albury.
- For December stays, consider implementing length-of-stay discounts or slightly higher rates for bookings made less than 63 days out to capitalize on advance planning.
- Target marketing efforts for the Winter season well in advance (at least 55 days) to capture early planners.
- Monitor your own booking lead times against these Albury averages to identify opportunities for dynamic pricing adjustments.
Popular & Essential Airbnb Amenities in Albury (2025)
Amenity Prevalence
Amenity Insights for Albury
- Essential amenities in Albury that guests expect include: TV, Air conditioning, Smoke alarm, Washer, Heating, Free parking on premises. Lacking these (any) could significantly impact bookings.
- Popular amenities like Kitchen, Wifi, Essentials are common but not universal. Offering these can provide a competitive edge.
- Warning: Wifi is not universally provided but is considered essential globally. Ensure reliable Wifi is offered.
Recommendations for Hosts
- Ensure your listing includes all essential amenities for Albury: TV, Air conditioning, Smoke alarm, Washer, Heating, Free parking on premises.
- Prioritize adding missing essentials: TV, Air conditioning, Smoke alarm, Washer, Heating, Free parking on premises.
- Consider adding popular differentiators like Kitchen or Wifi to increase appeal.
- Highlight unique or less common amenities you offer (e.g., hot tub, dedicated workspace, EV charger) in your listing description and photos.
- Regularly check competitor amenities in Albury to stay competitive.
Albury Airbnb Guest Demographics & Profile Analysis (2025)
Guest Profile Summary for Albury
- The typical guest profile for Airbnb in Albury consists of primarily domestic travelers (95%), often arriving from nearby Melbourne, typically belonging to the Post-2000s (Gen Z/Alpha) group (50%), primarily speaking English or Chinese.
- Domestic travelers account for 94.9% of guests.
- Key international markets include Australia (94.9%) and United States (0.8%).
- Top languages spoken are English (74.7%) followed by Chinese (5%).
- A significant demographic segment is the Post-2000s (Gen Z/Alpha) group, representing 50% of guests.
Recommendations for Hosts
- Target domestic marketing efforts towards travelers from Melbourne and Sydney.
- Tailor amenities and listing descriptions to appeal to the dominant Post-2000s (Gen Z/Alpha) demographic (e.g., highlight fast WiFi, smart home features, local guides).
- Highlight unique local experiences or amenities relevant to the primary guest profile.
- Consider seasonal promotions aligned with peak travel times for key origin markets.
Nearby Short-Term Rental Market Comparison
How does the Albury Airbnb market stack up against its neighbors? Compare key performance metrics like average monthly revenue, ADR, and occupancy rates in surrounding areas to understand the broader regional STR landscape.
| Market | Active Properties | Monthly Revenue | Daily Rate | Avg. Occupancy |
|---|---|---|---|---|
| Howqua Inlet | 13 | $3,634 | $322.01 | 37% |
| Bright | 474 | $3,468 | $294.34 | 42% |
| Porepunkah | 40 | $3,397 | $328.54 | 37% |
| Nagambie | 33 | $3,381 | $300.42 | 40% |
| Shire of Mansfield | 89 | $3,347 | $392.77 | 34% |
| Shire of Strathbogie | 43 | $3,173 | $314.72 | 37% |
| Jamieson | 37 | $3,138 | $283.80 | 33% |
| Wandiligong | 20 | $3,137 | $271.79 | 41% |
| Shire of Murrindindi | 70 | $3,061 | $268.84 | 40% |
| Beechworth | 110 | $3,056 | $251.89 | 41% |