District of Belconnen Airbnb Market Analysis 2025: Short Term Rental Data & Vacation Rental Statistics in Australian Capital Territory, Australia
Is Airbnb profitable in District of Belconnen in 2025? Explore comprehensive Airbnb analytics for District of Belconnen, Australian Capital Territory, Australia to uncover income potential. This 2025 STR market report for District of Belconnen, based on AirROI data from April 2024 to March 2025, reveals key trends in the market of 202 active listings.
Whether you're considering an Airbnb investment in District of Belconnen, optimizing your existing vacation rental, or exploring rental arbitrage opportunities, understanding the District of Belconnen Airbnb data is crucial. Leveraging the low regulation environment is key to maximizing your short term rental income potential. Let's dive into the specifics.
Key District of Belconnen Airbnb Performance Metrics Overview
Monthly Airbnb Revenue Variations & Income Potential in District of Belconnen (2025)
Understanding the monthly revenue variations for Airbnb listings in District of Belconnen is key to maximizing your short term rental income potential. Seasonality significantly impacts earnings. Our analysis, based on data from the past 12 months, shows that the peak revenue month for STRs in District of Belconnen is typically June, while March often presents the lowest earnings, highlighting opportunities for strategic pricing adjustments during shoulder and low seasons. Explore the typical Airbnb income in District of Belconnen across different performance tiers:
- Best-in-class properties (Top 10%) achieve $4,023+ monthly, often utilizing dynamic pricing and superior guest experiences.
- Strong performing properties (Top 25%) earn $2,928 or more, indicating effective management and desirable locations/amenities.
- Typical properties (Median) generate around $1,952 per month, representing the average market performance.
- Entry-level properties (Bottom 25%) see earnings around $962, often with potential for optimization.
Average Monthly Airbnb Earnings Trend in District of Belconnen
District of Belconnen Airbnb Occupancy Rate Trends (2025)
Maximize your bookings by understanding the District of Belconnen STR occupancy trends. Seasonal demand shifts significantly influence how often properties are booked. Typically, Julysees the highest demand (peak season occupancy), while March experiences the lowest (low season). Effective strategies, like adjusting minimum stays or offering promotions, can boost occupancy during slower periods. Here's how different property tiers perform in District of Belconnen:
- Best-in-class properties (Top 10%) achieve 86%+ occupancy, indicating high desirability and potentially optimized availability.
- Strong performing properties (Top 25%) maintain 73% or higher occupancy, suggesting good market fit and guest satisfaction.
- Typical properties (Median) have an occupancy rate around 54%.
- Entry-level properties (Bottom 25%) average 30% occupancy, potentially facing higher vacancy.
Average Monthly Occupancy Rate Trend in District of Belconnen
Average Daily Rate (ADR) Airbnb Trends in District of Belconnen (2025)
Effective short term rental pricing strategy in District of Belconnen involves understanding monthly ADR fluctuations. The Average Daily Rate (ADR) for Airbnb in District of Belconnen typically peaks in December and dips lowest during February. Leveraging Airbnb dynamic pricing tools or strategies based on this seasonality can significantly boost revenue. Here's a look at the typical nightly rates achieved:
- Best-in-class properties (Top 10%) command rates of $207+ per night, often due to premium features or locations.
- Strong performing properties (Top 25%) achieve nightly rates of $148 or more.
- Typical properties (Median) charge around $109 per night.
- Entry-level properties (Bottom 25%) earn around $71 per night.
Average Daily Rate (ADR) Trend by Month in District of Belconnen
Get Live District of Belconnen Market Intelligence 👇

Explore Real-time Analytics
Airbnb Seasonality Analysis & Trends in District of Belconnen (2025)
Peak Season (June, April, July)
- Revenue averages $2,400 per month
- Occupancy rates average 53.3%
- Daily rates average $127
Shoulder Season
- Revenue averages $2,219 per month
- Occupancy maintains around 53.5%
- Daily rates hold near $127
Low Season (February, March, August)
- Revenue drops to average $1,679 per month
- Occupancy decreases to average 47.4%
- Daily rates adjust to average $121
Seasonality Insights for District of Belconnen
- The Airbnb seasonality in District of Belconnen shows moderate seasonality with distinct peak and low periods. While the sections above show seasonal averages, it's also insightful to look at the extremes:
- During the high season, the absolute peak month showcases District of Belconnen's highest earning potential, with monthly revenues capable of climbing to $2,480, occupancy reaching a high of 60.8%, and ADRs peaking at $132.
- Conversely, the slowest single month of the year, typically falling within the low season, marks the market's lowest point. In this month, revenue might dip to $1,572, occupancy could drop to 43.0%, and ADRs may adjust down to $119.
- Understanding both the seasonal averages and these monthly peaks and troughs in revenue, occupancy, and ADR is crucial for maximizing your Airbnb profit potential in District of Belconnen.
Seasonal Strategies for Maximizing Profit
- Peak Season: Maximize revenue through premium pricing and potentially longer minimum stays. Ensure high availability.
- Low Season: Offer competitive pricing, special promotions (e.g., extended stay discounts), and flexible cancellation policies. Target off-season travelers like remote workers or budget-conscious guests.
- Shoulder Seasons: Implement dynamic pricing that balances peak and low rates. Target weekend travelers or specific events. Offer slightly more flexible terms than peak season.
- Regularly analyze your own performance against these District of Belconnen seasonality benchmarks and adjust your pricing and availability strategy accordingly.
Best Areas for Airbnb Investment in District of Belconnen (2025)
Exploring the top neighborhoods for short-term rentals in District of Belconnen? This section highlights key areas, outlining why they are attractive for hosts and guests, along with notable local attractions. Consider these locations based on your target guest profile and investment strategy.
| Neighborhood / Area | Why Host Here? (Target Guests & Appeal) | Key Attractions & Landmarks |
|---|---|---|
| Belconnen Town Centre | Belconnen Town Centre is the commercial heart of the district, offering a variety of shopping, dining and entertainment options. Its central location attracts both business travelers and tourists looking for convenience and comfort. | Westfield Belconnen, Lake Ginninderra, Belconnen Arts Centre, Canberra International Golf Centre, Markets at the Town Centre |
| Lake Ginninderra | A beautiful recreational area popular with families and outdoor enthusiasts, offering scenic views and walking paths. Ideal for guests looking for relaxation and outdoor activities. | Lake Ginninderra, Ginninderra Drive Walking Trail, Fishing and boating areas, Picnic spots and parks, Cycling paths |
| University of Canberra | Home to a large student population and close to various educational institutions, this area attracts short-term renters including students and academics visiting for conferences. | University of Canberra, Australian Institute of Sport, Canberra Institute of Technology, Sports facilities, Academic conferences |
| Holt | A suburban area known for its family-friendly environment and proximity to shopping facilities, making it ideal for guests wanting a homey atmosphere with easy access to amenities. | Kippax Shopping Centre, Local parks, Nearby nature reserves, Community facilities, Family-friendly dining options |
| Nicholls | A peaceful residential area with a strong sense of community, perfect for travelers looking for a quiet stay while still being close to major attractions in Belconnen. | Gungahlin Drive, Local parks, Nature walking trails, Community events, Nearby amenities |
| Kaleen | Another suburban area that is family-oriented, providing proximity to schools and parks. It's great for families visiting the area or those looking for long-term stays. | Kaleen Shopping Centre, Local schools, Public parks, Community sports facilities, Playgrounds |
| Charnwood | A vibrant suburban neighborhood known for its community spirit and convenience, making it appealing to guests looking for a cozy and friendly atmosphere. | Charnwood Shopping Centre, Local parks, Community events, Nearby schools, Public transport access |
| Evatt | Evatt is known for its accessibility and quiet residential neighborhoods which appeal to guests looking for a peaceful retreat while being close to local amenities and nature. | Evatt Shops, Local parks, Nature reserves, Walking trails, Quiet suburban environment |
Understanding Airbnb License Requirements & STR Laws in District of Belconnen (2025)
While District of Belconnen, Australian Capital Territory, Australia currently shows low STR regulations, specific Airbnb license requirements might still exist or change. Always verify the latest short term rental regulations and Airbnb license requirements directly with local government authorities for District of Belconnen to ensure full compliance before hosting.
(Source: AirROI data, 2025, finding no licensed listings among those analyzed)
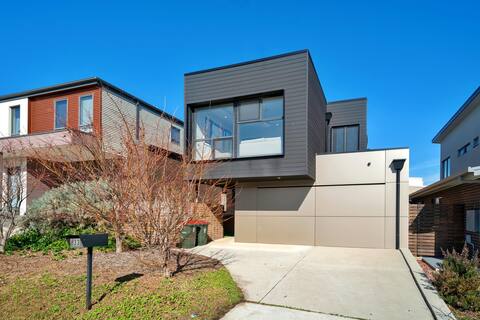
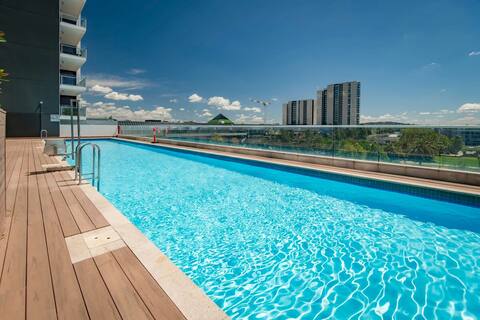
Top Performing Airbnb Properties in District of Belconnen (2025)
Benchmark your potential! Explore examples of top-performing Airbnb properties in District of Belconnenbased on Trailing Twelve Month (TTM) revenue. Analyze their characteristics, revenue, occupancy rate, and ADR to understand what drives success in this market.

A04-Luxe (open listing for all details)
Entire Place • 5 bedrooms
4 BR Modern Stylish House in Lawson
Entire Place • 4 bedrooms
Sensational City Apartment with Lake Views
Entire Place • 2 bedrooms

Warm and Spacious 5BR Home w/WIFI&Multiple Parking
Entire Place • 5 bedrooms

Modern spacious waterfront apartment with pool
Entire Place • 2 bedrooms

Canberra Tallest Tower with Stunning Lake Views
Entire Place • 2 bedrooms
Note: Performance varies based on location, size, amenities, seasonality, and management quality. Data reflects the past 12 months.
Top Performing Airbnb Hosts in District of Belconnen (2025)
Learn from the best! This table showcases top-performing Airbnb hosts in District of Belconnen based on the number of properties managed and estimated total revenue over the past year. Analyze their scale and performance metrics.
| Host Name | Properties | Grossing Revenue | Stay Reviews | Avg Rating |
|---|---|---|---|---|
| Daniel | 8 | $228,362 | 1139 | 4.77/5.0 |
| Mon | 7 | $207,446 | 675 | 4.88/5.0 |
| Admin | 3 | $159,233 | 140 | 4.46/5.0 |
| MadeComfy | 5 | $155,510 | 74 | 4.48/5.0 |
| April | 4 | $152,561 | 1240 | 4.79/5.0 |
| Leo | 4 | $148,047 | 238 | 4.72/5.0 |
| Pancy | 5 | $127,969 | 518 | 4.79/5.0 |
| AirKeeper | 4 | $107,405 | 23 | 2.37/5.0 |
| David | 2 | $96,704 | 71 | 4.93/5.0 |
| Ricky | 3 | $94,110 | 305 | 4.80/5.0 |
Analyzing the strategies of top hosts, such as their property selection, pricing, and guest communication, can offer valuable lessons for optimizing your own Airbnb operations in District of Belconnen.
Dive Deeper: Advanced District of Belconnen STR Market Data (2025)
Ready to unlock more insights? AirROI provides access to advanced metrics and comprehensive Airbnb data for District of Belconnen. Explore detailed analytics beyond this report to refine your investment strategy, optimize pricing, and maximize your vacation rental profits.
Explore Advanced MetricsDistrict of Belconnen Short-Term Rental Market Composition (2025): Property & Room Types
Room Type Distribution
Property Type Distribution
Market Composition Insights for District of Belconnen
- The District of Belconnen Airbnb market composition is heavily skewed towards Entire Home/Apt listings, which make up 80.2% of the 202 active rentals. This indicates strong guest preference for privacy and space.
- Looking at the property type distribution in District of Belconnen, House properties are the most common (56.4%), reflecting the local real estate landscape.
- Houses represent a significant 56.4% portion, catering likely to families or larger groups.
- Smaller segments like others, hotel/boutique (combined 6.5%) offer potential for unique stay experiences.
District of Belconnen Airbnb Room Capacity Analysis (2025): Bedroom Distribution
Distribution of Listings by Number of Bedrooms
Room Capacity Insights for District of Belconnen
- The dominant room capacity in District of Belconnen is 1 bedroom listings, making up 27.7% of the market. This suggests a strong demand for properties suitable for couples or solo travelers.
- Together, 1 bedroom and 2 bedrooms properties represent 54.9% of the active Airbnb listings in District of Belconnen, indicating a high concentration in these sizes.
- A significant 29.2% of listings offer 3+ bedrooms, catering to larger groups and families seeking more space in District of Belconnen.
District of Belconnen Vacation Rental Guest Capacity Trends (2025)
Distribution of Listings by Guest Capacity
Guest Capacity Insights for District of Belconnen
- The most common guest capacity trend in District of Belconnen vacation rentals is listings accommodating 4 guests (22.3%). This suggests the primary traveler segment is likely small families or groups.
- Properties designed for 4 guests and 6 guests dominate the District of Belconnen STR market, accounting for 40.6% of listings.
- 36.1% of properties accommodate 6+ guests, serving the market segment for larger families or group travel in District of Belconnen.
- On average, properties in District of Belconnen are equipped to host 4.1 guests.
District of Belconnen Airbnb Booking Patterns (2025): Available vs. Booked Days
Available Days Distribution
Booked Days Distribution
Booking Pattern Insights for District of Belconnen
- The most common availability pattern in District of Belconnen falls within the 91-180 days range, representing 39.6% of listings. This suggests many properties have significant open periods on their calendars.
- Approximately 48.0% of listings show high availability (181+ days open annually), indicating potential for increased bookings or specific owner usage patterns.
- For booked days, the 181-270 days range is most frequent in District of Belconnen (39.1%), reflecting common guest stay durations or potential owner blocking patterns.
- A notable 52.5% of properties secure long booking periods (181+ days booked per year), highlighting successful long-term rental strategies or significant owner usage.
District of Belconnen Airbnb Minimum Stay Requirements Analysis
Distribution of Listings by Minimum Night Requirement
1 Night
91 listings
48.7% of total
2 Nights
43 listings
23% of total
3 Nights
18 listings
9.6% of total
4-6 Nights
12 listings
6.4% of total
7-29 Nights
5 listings
2.7% of total
30+ Nights
18 listings
9.6% of total
Key Insights
- The most prevalent minimum stay requirement in District of Belconnen is 1 Night, adopted by 48.7% of listings. This highlights the market's preference for shorter, flexible bookings.
- A strong majority (71.7%) of the District of Belconnen Airbnb data shows acceptance of very short stays (1-2 nights), indicating a dynamic, high-turnover market.
Recommendations
- Align with the market by considering a 1 Night minimum stay, as 48.7% of District of Belconnen hosts use this setting.
- Explore offering discounts for stays of 30+ nights to attract the 9.6% of the market seeking extended stays.
- Adjust minimum nights based on seasonality – potentially shorter during low season and longer during peak demand periods in District of Belconnen.
District of Belconnen Airbnb Cancellation Policy Trends Analysis (2025)
Super Strict 30 Days
2 listings
1.1% of total
Flexible
43 listings
23.4% of total
Moderate
75 listings
40.8% of total
Firm
28 listings
15.2% of total
Strict
36 listings
19.6% of total
Cancellation Policy Insights for District of Belconnen
- The prevailing Airbnb cancellation policy trend in District of Belconnen is Moderate, used by 40.8% of listings.
- There's a relatively balanced mix between guest-friendly (64.2%) and stricter (34.8%) policies, offering choices for different guest needs.
Recommendations for Hosts
- Consider adopting a Moderate policy to align with the 40.8% market standard in District of Belconnen.
- Regularly review your cancellation policy against competitors and market demand shifts in District of Belconnen.
District of Belconnen STR Booking Lead Time Analysis (2025)
Average Booking Lead Time by Month
Booking Lead Time Insights for District of Belconnen
- The overall average booking lead time for vacation rentals in District of Belconnen is 36 days.
- Guests book furthest in advance for stays during January (average 49 days), likely coinciding with peak travel demand or local events.
- The shortest booking windows occur for stays in May (average 32 days), indicating more last-minute travel plans during this time.
- Seasonally, Winter (42 days avg.) sees the longest lead times, while Spring (33 days avg.) has the shortest, reflecting typical travel planning cycles.
Recommendations for Hosts
- Use the overall average lead time (36 days) as a baseline for your pricing and availability strategy in District of Belconnen.
- For January stays, consider implementing length-of-stay discounts or slightly higher rates for bookings made less than 49 days out to capitalize on advance planning.
- Target marketing efforts for the Winter season well in advance (at least 42 days) to capture early planners.
- Monitor your own booking lead times against these District of Belconnen averages to identify opportunities for dynamic pricing adjustments.
Popular & Essential Airbnb Amenities in District of Belconnen (2025)
Amenity Prevalence
Amenity Insights for District of Belconnen
- Essential amenities in District of Belconnen that guests expect include: Wifi, TV, Kitchen. Lacking these (any) could significantly impact bookings.
- Popular amenities like Washer, Free parking on premises, Hot water are common but not universal. Offering these can provide a competitive edge.
Recommendations for Hosts
- Ensure your listing includes all essential amenities for District of Belconnen: Wifi, TV, Kitchen.
- Prioritize adding missing essentials: Wifi, TV, Kitchen.
- Consider adding popular differentiators like Washer or Free parking on premises to increase appeal.
- Highlight unique or less common amenities you offer (e.g., hot tub, dedicated workspace, EV charger) in your listing description and photos.
- Regularly check competitor amenities in District of Belconnen to stay competitive.
District of Belconnen Airbnb Guest Demographics & Profile Analysis (2025)
Guest Profile Summary for District of Belconnen
- The typical guest profile for Airbnb in District of Belconnen consists of primarily domestic travelers (91%), often arriving from nearby Sydney, typically belonging to the Post-2000s (Gen Z/Alpha) group (50%), primarily speaking English or Chinese.
- Domestic travelers account for 91.3% of guests.
- Key international markets include Australia (91.3%) and New Zealand (1.3%).
- Top languages spoken are English (68.2%) followed by Chinese (6.5%).
- A significant demographic segment is the Post-2000s (Gen Z/Alpha) group, representing 50% of guests.
Recommendations for Hosts
- Target domestic marketing efforts towards travelers from Sydney and New South Wales.
- Tailor amenities and listing descriptions to appeal to the dominant Post-2000s (Gen Z/Alpha) demographic (e.g., highlight fast WiFi, smart home features, local guides).
- Highlight unique local experiences or amenities relevant to the primary guest profile.
- Consider seasonal promotions aligned with peak travel times for key origin markets.
Nearby Short-Term Rental Market Comparison
How does the District of Belconnen Airbnb market stack up against its neighbors? Compare key performance metrics like average monthly revenue, ADR, and occupancy rates in surrounding areas to understand the broader regional STR landscape.
| Market | Active Properties | Monthly Revenue | Daily Rate | Avg. Occupancy |
|---|---|---|---|---|
| Penrose | 12 | $6,349 | $600.00 | 42% |
| Berry | 115 | $6,185 | $540.04 | 41% |
| Jaspers Brush | 13 | $5,600 | $510.06 | 37% |
| Burrawang | 11 | $5,005 | $523.75 | 43% |
| Berrima | 44 | $4,756 | $426.34 | 42% |
| Braidwood | 20 | $4,708 | $443.62 | 40% |
| Robertson | 44 | $4,655 | $375.71 | 40% |
| Bombo | 10 | $4,613 | $503.00 | 39% |
| Exeter | 30 | $4,595 | $519.08 | 38% |
| Gerringong | 121 | $4,483 | $486.76 | 37% |