John o' Groats Airbnb Market Analysis 2025: Short Term Rental Data & Vacation Rental Statistics in Scotland, United Kingdom
Is Airbnb profitable in John o' Groats in 2025? Explore comprehensive Airbnb analytics for John o' Groats, Scotland, United Kingdom to uncover income potential. This 2025 STR market report for John o' Groats, based on AirROI data from April 2024 to March 2025, reveals key trends in the niche market of 22 active listings.
Whether you're considering an Airbnb investment in John o' Groats, optimizing your existing vacation rental, or exploring rental arbitrage opportunities, understanding the John o' Groats Airbnb data is crucial. Leveraging the low regulation environment is key to maximizing your short term rental income potential. Let's dive into the specifics.
Key John o' Groats Airbnb Performance Metrics Overview
Monthly Airbnb Revenue Variations & Income Potential in John o' Groats (2025)
Understanding the monthly revenue variations for Airbnb listings in John o' Groats is key to maximizing your short term rental income potential. Seasonality significantly impacts earnings. Our analysis, based on data from the past 12 months, shows that the peak revenue month for STRs in John o' Groats is typically August, while March often presents the lowest earnings, highlighting opportunities for strategic pricing adjustments during shoulder and low seasons. Explore the typical Airbnb income in John o' Groats across different performance tiers:
- Best-in-class properties (Top 10%) achieve $3,489+ monthly, often utilizing dynamic pricing and superior guest experiences.
- Strong performing properties (Top 25%) earn $2,293 or more, indicating effective management and desirable locations/amenities.
- Typical properties (Median) generate around $1,339 per month, representing the average market performance.
- Entry-level properties (Bottom 25%) see earnings around $682, often with potential for optimization.
Average Monthly Airbnb Earnings Trend in John o' Groats
John o' Groats Airbnb Occupancy Rate Trends (2025)
Maximize your bookings by understanding the John o' Groats STR occupancy trends. Seasonal demand shifts significantly influence how often properties are booked. Typically, Septembersees the highest demand (peak season occupancy), while March experiences the lowest (low season). Effective strategies, like adjusting minimum stays or offering promotions, can boost occupancy during slower periods. Here's how different property tiers perform in John o' Groats:
- Best-in-class properties (Top 10%) achieve 63%+ occupancy, indicating high desirability and potentially optimized availability.
- Strong performing properties (Top 25%) maintain 50% or higher occupancy, suggesting good market fit and guest satisfaction.
- Typical properties (Median) have an occupancy rate around 25%.
- Entry-level properties (Bottom 25%) average 12% occupancy, potentially facing higher vacancy.
Average Monthly Occupancy Rate Trend in John o' Groats
Average Daily Rate (ADR) Airbnb Trends in John o' Groats (2025)
Effective short term rental pricing strategy in John o' Groats involves understanding monthly ADR fluctuations. The Average Daily Rate (ADR) for Airbnb in John o' Groats typically peaks in February and dips lowest during June. Leveraging Airbnb dynamic pricing tools or strategies based on this seasonality can significantly boost revenue. Here's a look at the typical nightly rates achieved:
- Best-in-class properties (Top 10%) command rates of $533+ per night, often due to premium features or locations.
- Strong performing properties (Top 25%) achieve nightly rates of $475 or more.
- Typical properties (Median) charge around $320 per night.
- Entry-level properties (Bottom 25%) earn around $140 per night.
Average Daily Rate (ADR) Trend by Month in John o' Groats
Get Live John o' Groats Market Intelligence 👇

Explore Real-time Analytics
Airbnb Seasonality Analysis & Trends in John o' Groats (2025)
Peak Season (August, July, May)
- Revenue averages $2,487 per month
- Occupancy rates average 42.3%
- Daily rates average $256
Shoulder Season
- Revenue averages $1,815 per month
- Occupancy maintains around 36.1%
- Daily rates hold near $307
Low Season (January, March, November)
- Revenue drops to average $575 per month
- Occupancy decreases to average 12.8%
- Daily rates adjust to average $408
Seasonality Insights for John o' Groats
- The Airbnb seasonality in John o' Groats shows highly seasonal trends requiring careful strategy. While the sections above show seasonal averages, it's also insightful to look at the extremes:
- During the high season, the absolute peak month showcases John o' Groats's highest earning potential, with monthly revenues capable of climbing to $2,659, occupancy reaching a high of 45.4%, and ADRs peaking at $440.
- Conversely, the slowest single month of the year, typically falling within the low season, marks the market's lowest point. In this month, revenue might dip to $419, occupancy could drop to 9.1%, and ADRs may adjust down to $239.
- Understanding both the seasonal averages and these monthly peaks and troughs in revenue, occupancy, and ADR is crucial for maximizing your Airbnb profit potential in John o' Groats.
Seasonal Strategies for Maximizing Profit
- Peak Season: Maximize revenue through premium pricing and potentially longer minimum stays. Ensure high availability.
- Low Season: Offer competitive pricing, special promotions (e.g., extended stay discounts), and flexible cancellation policies. Target off-season travelers like remote workers or budget-conscious guests.
- Shoulder Seasons: Implement dynamic pricing that balances peak and low rates. Target weekend travelers or specific events. Offer slightly more flexible terms than peak season.
- Regularly analyze your own performance against these John o' Groats seasonality benchmarks and adjust your pricing and availability strategy accordingly.
Best Areas for Airbnb Investment in John o' Groats (2025)
Exploring the top neighborhoods for short-term rentals in John o' Groats? This section highlights key areas, outlining why they are attractive for hosts and guests, along with notable local attractions. Consider these locations based on your target guest profile and investment strategy.
| Neighborhood / Area | Why Host Here? (Target Guests & Appeal) | Key Attractions & Landmarks |
|---|---|---|
| The John o' Groats Village | A quaint coastal village known for its stunning views of the Orkney Islands and famous landmark. Popular with tourists seeking picturesque landscapes and historical sites. | John o' Groats Signpost, The Last House, Orkney Ferries, Wildlife tours, Local pubs and restaurants |
| Dunnet Head | The northernmost point of mainland Scotland offering dramatic cliffs and seabird colonies. Ideal for travelers looking for natural beauty and outdoor adventures. | Dunnet Head Lighthouse, Beaches, Birdwatching, Hiking trails, Historical sites |
| Sutherland | A region known for its rugged coastline and unspoiled nature. Attracts nature lovers and those seeking tranquility away from urban life. | Sutherland Beaches, Nature trails, Historical castles, Scenic viewpoints, Wildlife watching |
| Thurso | Nearby town that provides amenities and services for visitors. A convenient base for exploring John o' Groats and surrounding areas. | Thurso East surf spot, Historic Thurso Castle, Caithness Horizons Museum, Local shops and cafes, Thurso River walks |
| Wick | Another nearby town with rich history and culture, offering additional attractions and dining options to visitors. | Wick Heritage Museum, Old Wick Castle, Pulteney Distillery, Wick River, Local fish restaurants |
| Orkney Islands | Just a ferry ride away, the islands are steeped in history and boast beautiful landscapes. Ideal for adventurous guests looking to explore beyond John o' Groats. | Skara Brae, St. Magnus Cathedral, Ring of Brodgar, Orkney Museum, Scenic coastlines |
| Caithness Coast | Known for its stunning views and rugged terrain, perfect for outdoor activities and marine wildlife. Attracts hikers and nature enthusiasts. | Coastal walking paths, Whale watching, Historic battlefields, Local wildlife, Hidden beaches |
| Duncansby Head | Famous for its sea stacks and dramatic cliffs. This location offers breathtaking views and is popular among photographers and nature lovers. | Duncansby Stacks, Birdwatching, Hiking trails, Scenic viewpoints, Nearby beaches |
Understanding Airbnb License Requirements & STR Laws in John o' Groats (2025)
While John o' Groats, Scotland, United Kingdom currently shows low STR regulations, specific Airbnb license requirements might still exist or change. Always verify the latest short term rental regulations and Airbnb license requirements directly with local government authorities for John o' Groats to ensure full compliance before hosting.
(Source: AirROI data, 2025, finding no licensed listings among those analyzed)
Top Performing Airbnb Properties in John o' Groats (2025)
Benchmark your potential! Explore examples of top-performing Airbnb properties in John o' Groatsbased on Trailing Twelve Month (TTM) revenue. Analyze their characteristics, revenue, occupancy rate, and ADR to understand what drives success in this market.
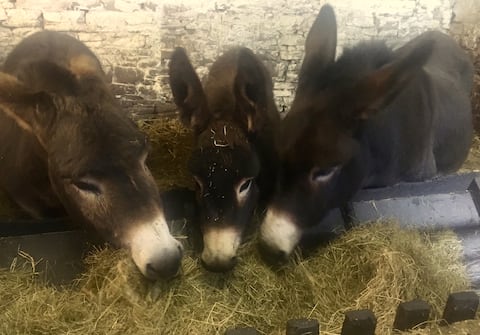
Puffin Cottage - Stay on a Petting Farm!
Entire Place • 2 bedrooms

Mill Cottage
Entire Place • 2 bedrooms
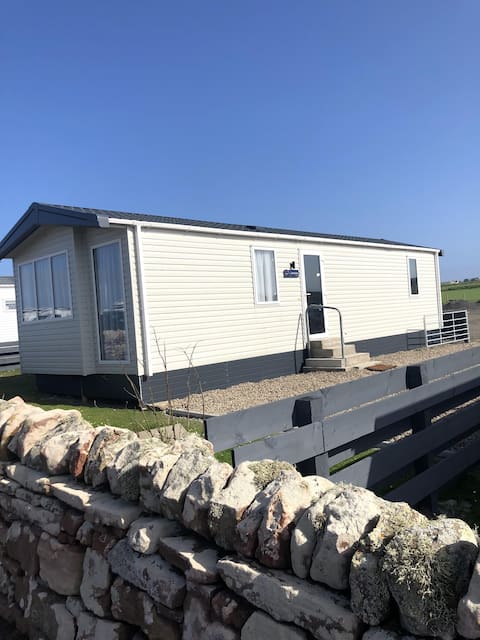
Pentland View Caravans-Victory
Entire Place • 2 bedrooms

Pentland View Caravans, John O Groats, Caithness
Entire Place • 3 bedrooms
Puffin Croft Petting Farm - Double room
Private Room • 2 bedrooms

Haven Gore
Entire Place • 3 bedrooms
Note: Performance varies based on location, size, amenities, seasonality, and management quality. Data reflects the past 12 months.
Top Performing Airbnb Hosts in John o' Groats (2025)
Learn from the best! This table showcases top-performing Airbnb hosts in John o' Groats based on the number of properties managed and estimated total revenue over the past year. Analyze their scale and performance metrics.
| Host Name | Properties | Grossing Revenue | Stay Reviews | Avg Rating |
|---|---|---|---|---|
| Cara | 3 | $77,429 | 112 | 4.89/5.0 |
| Caroline | 2 | $50,782 | 469 | 4.88/5.0 |
| Together Travel | 9 | $41,320 | 89 | 4.81/5.0 |
| Cottages | 1 | $27,878 | 4 | 4.50/5.0 |
| Host #103115815 | 3 | $22,795 | 868 | 4.22/5.0 |
| Wilma | 1 | $17,820 | 286 | 4.87/5.0 |
| Catherine | 1 | $16,373 | 315 | 4.90/5.0 |
| Gordon | 1 | $16,176 | 191 | 4.58/5.0 |
| Matthew | 1 | $15,534 | 76 | 4.99/5.0 |
Analyzing the strategies of top hosts, such as their property selection, pricing, and guest communication, can offer valuable lessons for optimizing your own Airbnb operations in John o' Groats.
Dive Deeper: Advanced John o' Groats STR Market Data (2025)
Ready to unlock more insights? AirROI provides access to advanced metrics and comprehensive Airbnb data for John o' Groats. Explore detailed analytics beyond this report to refine your investment strategy, optimize pricing, and maximize your vacation rental profits.
Explore Advanced MetricsJohn o' Groats Short-Term Rental Market Composition (2025): Property & Room Types
Room Type Distribution
Property Type Distribution
Market Composition Insights for John o' Groats
- The John o' Groats Airbnb market composition is heavily skewed towards Entire Home/Apt listings, which make up 54.5% of the 22 active rentals. This indicates strong guest preference for privacy and space.
- However, a notable 45.5% share for Private Rooms suggests opportunities for budget-conscious travelers or hosts renting out spare rooms.
- Looking at the property type distribution in John o' Groats, Outdoor/Unique properties are the most common (54.5%), reflecting the local real estate landscape.
- Houses represent a significant 27.3% portion, catering likely to families or larger groups.
John o' Groats Airbnb Room Capacity Analysis (2025): Bedroom Distribution
Distribution of Listings by Number of Bedrooms
Room Capacity Insights for John o' Groats
- The dominant room capacity in John o' Groats is 3 bedrooms listings, making up 31.8% of the market. This suggests a strong demand for properties suitable for families or small groups.
- Together, 3 bedrooms and 2 bedrooms properties represent 54.5% of the active Airbnb listings in John o' Groats, indicating a high concentration in these sizes.
- A significant 36.3% of listings offer 3+ bedrooms, catering to larger groups and families seeking more space in John o' Groats.
John o' Groats Vacation Rental Guest Capacity Trends (2025)
Distribution of Listings by Guest Capacity
Guest Capacity Insights for John o' Groats
- The most common guest capacity trend in John o' Groats vacation rentals is listings accommodating 6 guests (45.5%). This suggests the primary traveler segment is likely larger groups.
- Properties designed for 6 guests and 3 guests dominate the John o' Groats STR market, accounting for 59.1% of listings.
- 54.5% of properties accommodate 6+ guests, serving the market segment for larger families or group travel in John o' Groats.
- On average, properties in John o' Groats are equipped to host 4.4 guests.
John o' Groats Airbnb Booking Patterns (2025): Available vs. Booked Days
Available Days Distribution
Booked Days Distribution
Booking Pattern Insights for John o' Groats
- The most common availability pattern in John o' Groats falls within the 271-366 days range, representing 59.1% of listings. This suggests many properties have significant open periods on their calendars.
- Approximately 90.9% of listings show high availability (181+ days open annually), indicating potential for increased bookings or specific owner usage patterns.
- For booked days, the 1-30 days range is most frequent in John o' Groats (36.4%), reflecting common guest stay durations or potential owner blocking patterns.
- A notable 9.1% of properties secure long booking periods (181+ days booked per year), highlighting successful long-term rental strategies or significant owner usage.
John o' Groats Airbnb Minimum Stay Requirements Analysis
Distribution of Listings by Minimum Night Requirement
1 Night
18 listings
90% of total
3 Nights
1 listings
5% of total
4-6 Nights
1 listings
5% of total
Key Insights
- The most prevalent minimum stay requirement in John o' Groats is 1 Night, adopted by 90% of listings. This highlights the market's preference for shorter, flexible bookings.
- A strong majority (90.0%) of the John o' Groats Airbnb data shows acceptance of very short stays (1-2 nights), indicating a dynamic, high-turnover market.
Recommendations
- Align with the market by considering a 1 Night minimum stay, as 90% of John o' Groats hosts use this setting.
- Adjust minimum nights based on seasonality – potentially shorter during low season and longer during peak demand periods in John o' Groats.
John o' Groats Airbnb Cancellation Policy Trends Analysis (2025)
Super Strict 60 Days
1 listings
4.8% of total
Flexible
14 listings
66.7% of total
Moderate
2 listings
9.5% of total
Firm
4 listings
19% of total
Cancellation Policy Insights for John o' Groats
- The prevailing Airbnb cancellation policy trend in John o' Groats is Flexible, used by 66.7% of listings.
- The market strongly favors guest-friendly terms, with 76.2% of listings offering Flexible or Moderate policies. This suggests guests in John o' Groats may expect booking flexibility.
Recommendations for Hosts
- Consider adopting a Flexible policy to align with the 66.7% market standard in John o' Groats.
- Given the high prevalence of Flexible policies (66.7%), offering this can enhance booking appeal, especially during shoulder seasons.
- Regularly review your cancellation policy against competitors and market demand shifts in John o' Groats.
John o' Groats STR Booking Lead Time Analysis (2025)
Average Booking Lead Time by Month
Booking Lead Time Insights for John o' Groats
- The overall average booking lead time for vacation rentals in John o' Groats is 71 days.
- Guests book furthest in advance for stays during December (average 120 days), likely coinciding with peak travel demand or local events.
- The shortest booking windows occur for stays in February (average 12 days), indicating more last-minute travel plans during this time.
- Seasonally, Summer (85 days avg.) sees the longest lead times, while Fall (56 days avg.) has the shortest, reflecting typical travel planning cycles.
Recommendations for Hosts
- Use the overall average lead time (71 days) as a baseline for your pricing and availability strategy in John o' Groats.
- For December stays, consider implementing length-of-stay discounts or slightly higher rates for bookings made less than 120 days out to capitalize on advance planning.
- During February, focus on last-minute booking availability and promotions, as guests book with very short notice (12 days avg.).
- Target marketing efforts for the Summer season well in advance (at least 85 days) to capture early planners.
- Monitor your own booking lead times against these John o' Groats averages to identify opportunities for dynamic pricing adjustments.
Popular & Essential Airbnb Amenities in John o' Groats (2025)
Amenity Prevalence
Amenity Insights for John o' Groats
- Essential amenities in John o' Groats that guests expect include: Free parking on premises. Lacking these (this) could significantly impact bookings.
- Popular amenities like Wifi, TV, Essentials are common but not universal. Offering these can provide a competitive edge.
- Warning: Wifi is not universally provided but is considered essential globally. Ensure reliable Wifi is offered.
Recommendations for Hosts
- Ensure your listing includes all essential amenities for John o' Groats: Free parking on premises.
- Consider adding popular differentiators like Wifi or TV to increase appeal.
- Highlight unique or less common amenities you offer (e.g., hot tub, dedicated workspace, EV charger) in your listing description and photos.
- Regularly check competitor amenities in John o' Groats to stay competitive.
John o' Groats Airbnb Guest Demographics & Profile Analysis (2025)
Guest Profile Summary for John o' Groats
- The typical guest profile for Airbnb in John o' Groats consists of a mix of domestic (59%) and international guests, often arriving from nearby England, typically belonging to the Post-2000s (Gen Z/Alpha) group (50%), primarily speaking English or German.
- Domestic travelers account for 59.1% of guests.
- Key international markets include United Kingdom (59.1%) and United States (9.7%).
- Top languages spoken are English (57.3%) followed by German (8.1%).
- A significant demographic segment is the Post-2000s (Gen Z/Alpha) group, representing 50% of guests.
Recommendations for Hosts
- Balance marketing efforts between domestic and international channels based on the guest mix.
- Tailor amenities and listing descriptions to appeal to the dominant Post-2000s (Gen Z/Alpha) demographic (e.g., highlight fast WiFi, smart home features, local guides).
- Highlight unique local experiences or amenities relevant to the primary guest profile.
- Consider seasonal promotions aligned with peak travel times for key origin markets.
Nearby Short-Term Rental Market Comparison
How does the John o' Groats Airbnb market stack up against its neighbors? Compare key performance metrics like average monthly revenue, ADR, and occupancy rates in surrounding areas to understand the broader regional STR landscape.
| Market | Active Properties | Monthly Revenue | Daily Rate | Avg. Occupancy |
|---|---|---|---|---|
| Kirkhill | 10 | $5,719 | $700.26 | 44% |
| North Kessock | 10 | $5,421 | $380.62 | 58% |
| Foyers | 14 | $5,076 | $274.52 | 64% |
| Whitebridge | 10 | $4,907 | $417.35 | 42% |
| Insh | 14 | $4,473 | $289.96 | 63% |
| Nethy Bridge | 49 | $3,742 | $259.42 | 52% |
| Muir of Ord | 14 | $3,694 | $378.82 | 56% |
| Fochabers | 14 | $3,540 | $310.94 | 48% |
| Fort Augustus | 146 | $3,432 | $354.72 | 42% |
| Dulnain Bridge | 16 | $3,431 | $305.50 | 44% |