Baan Don Sai Airbnb Market Analysis 2025: Short Term Rental Data & Vacation Rental Statistics in Surat Thani Province, Thailand
Is Airbnb profitable in Baan Don Sai in 2025? Explore comprehensive Airbnb analytics for Baan Don Sai, Surat Thani Province, Thailand to uncover income potential. This 2025 STR market report for Baan Don Sai, based on AirROI data from April 2024 to March 2025, reveals key trends in the niche market of 26 active listings.
Whether you're considering an Airbnb investment in Baan Don Sai, optimizing your existing vacation rental, or exploring rental arbitrage opportunities, understanding the Baan Don Sai Airbnb data is crucial. Leveraging the low regulation environment is key to maximizing your short term rental income potential. Let's dive into the specifics.
Key Baan Don Sai Airbnb Performance Metrics Overview
Monthly Airbnb Revenue Variations & Income Potential in Baan Don Sai (2025)
Understanding the monthly revenue variations for Airbnb listings in Baan Don Sai is key to maximizing your short term rental income potential. Seasonality significantly impacts earnings. Our analysis, based on data from the past 12 months, shows that the peak revenue month for STRs in Baan Don Sai is typically January, while October often presents the lowest earnings, highlighting opportunities for strategic pricing adjustments during shoulder and low seasons. Explore the typical Airbnb income in Baan Don Sai across different performance tiers:
- Best-in-class properties (Top 10%) achieve $2,117+ monthly, often utilizing dynamic pricing and superior guest experiences.
- Strong performing properties (Top 25%) earn $1,116 or more, indicating effective management and desirable locations/amenities.
- Typical properties (Median) generate around $584 per month, representing the average market performance.
- Entry-level properties (Bottom 25%) see earnings around $271, often with potential for optimization.
Average Monthly Airbnb Earnings Trend in Baan Don Sai
Baan Don Sai Airbnb Occupancy Rate Trends (2025)
Maximize your bookings by understanding the Baan Don Sai STR occupancy trends. Seasonal demand shifts significantly influence how often properties are booked. Typically, Februarysees the highest demand (peak season occupancy), while October experiences the lowest (low season). Effective strategies, like adjusting minimum stays or offering promotions, can boost occupancy during slower periods. Here's how different property tiers perform in Baan Don Sai:
- Best-in-class properties (Top 10%) achieve 83%+ occupancy, indicating high desirability and potentially optimized availability.
- Strong performing properties (Top 25%) maintain 65% or higher occupancy, suggesting good market fit and guest satisfaction.
- Typical properties (Median) have an occupancy rate around 47%.
- Entry-level properties (Bottom 25%) average 25% occupancy, potentially facing higher vacancy.
Average Monthly Occupancy Rate Trend in Baan Don Sai
Average Daily Rate (ADR) Airbnb Trends in Baan Don Sai (2025)
Effective short term rental pricing strategy in Baan Don Sai involves understanding monthly ADR fluctuations. The Average Daily Rate (ADR) for Airbnb in Baan Don Sai typically peaks in January and dips lowest during October. Leveraging Airbnb dynamic pricing tools or strategies based on this seasonality can significantly boost revenue. Here's a look at the typical nightly rates achieved:
- Best-in-class properties (Top 10%) command rates of $104+ per night, often due to premium features or locations.
- Strong performing properties (Top 25%) achieve nightly rates of $58 or more.
- Typical properties (Median) charge around $39 per night.
- Entry-level properties (Bottom 25%) earn around $21 per night.
Average Daily Rate (ADR) Trend by Month in Baan Don Sai
Get Live Baan Don Sai Market Intelligence 👇

Explore Real-time Analytics
Airbnb Seasonality Analysis & Trends in Baan Don Sai (2025)
Peak Season (January, February, May)
- Revenue averages $1,535 per month
- Occupancy rates average 66.8%
- Daily rates average $66
Shoulder Season
- Revenue averages $1,063 per month
- Occupancy maintains around 45.0%
- Daily rates hold near $53
Low Season (August, September, October)
- Revenue drops to average $561 per month
- Occupancy decreases to average 37.7%
- Daily rates adjust to average $41
Seasonality Insights for Baan Don Sai
- The Airbnb seasonality in Baan Don Sai shows highly seasonal trends requiring careful strategy. While the sections above show seasonal averages, it's also insightful to look at the extremes:
- During the high season, the absolute peak month showcases Baan Don Sai's highest earning potential, with monthly revenues capable of climbing to $1,764, occupancy reaching a high of 73.7%, and ADRs peaking at $79.
- Conversely, the slowest single month of the year, typically falling within the low season, marks the market's lowest point. In this month, revenue might dip to $478, occupancy could drop to 34.1%, and ADRs may adjust down to $40.
- Understanding both the seasonal averages and these monthly peaks and troughs in revenue, occupancy, and ADR is crucial for maximizing your Airbnb profit potential in Baan Don Sai.
Seasonal Strategies for Maximizing Profit
- Peak Season: Maximize revenue through premium pricing and potentially longer minimum stays. Ensure high availability.
- Low Season: Offer competitive pricing, special promotions (e.g., extended stay discounts), and flexible cancellation policies. Target off-season travelers like remote workers or budget-conscious guests.
- Shoulder Seasons: Implement dynamic pricing that balances peak and low rates. Target weekend travelers or specific events. Offer slightly more flexible terms than peak season.
- Regularly analyze your own performance against these Baan Don Sai seasonality benchmarks and adjust your pricing and availability strategy accordingly.
Best Areas for Airbnb Investment in Baan Don Sai (2025)
Exploring the top neighborhoods for short-term rentals in Baan Don Sai? This section highlights key areas, outlining why they are attractive for hosts and guests, along with notable local attractions. Consider these locations based on your target guest profile and investment strategy.
| Neighborhood / Area | Why Host Here? (Target Guests & Appeal) | Key Attractions & Landmarks |
|---|---|---|
| Koh Samui | A popular island destination known for its palm-fringed beaches, luxurious resorts, and vibrant nightlife. Attracts both families and party-goers looking for sun and relaxation. | Chaweng Beach, Lamai Beach, Fisherman's Village, Big Buddha, Hin Ta and Hin Yai Rocks |
| Koh Phangan | Famous for the Full Moon Party and stunning beaches, Koh Phangan is a hotspot for backpackers and travelers seeking a lively atmosphere and natural beauty. | Haad Rin Beach, Thong Nai Pan Noi, Bottle Beach, Phaeng Waterfall, Amsterdam Bar |
| Surat Thani City | The gateway to the islands and national parks, Surat Thani City offers a local experience with affordable accommodation and access to various attractions in the region. | Surat Thani Night Market, Tapee River, Wat Phothawas, Raja Ferry Port |
| Khao Sok National Park | A beautiful national park known for its stunning jungle, wildlife, and Cheow Lan Lake, attracting eco-tourists and adventurers. | Cheow Lan Lake, Khao Sok jungle treks, Wildlife spotting, Floating bungalows |
| Samui Airport | Close to beaches and resort areas, this area is convenient for travel and has various rental opportunities for tourists flying in and out. | Shopping at Samui Airport, Dining options, Proximity to beaches |
| Nakhon Si Thammarat | A nearby city with historical attractions and local culture, attracting visitors who wish to explore authentic Southern Thai experiences. | Nakhon Si Thammarat National Museum, Wat Phra Mahathat, Nang Talung (shadow puppet) shows |
| Than Sadet National Park | Known for its pristine beaches and national park trails, this area is great for nature lovers and those looking for tranquility away from crowds. | Than Sadet Beach, Nature trails, Wildlife observation |
| Taling Ngam | A quieter area in Koh Samui known for its stunning sunset views and luxury villas, ideal for travelers looking for relaxation and peace. | Taling Ngam Beach, Nikki Beach, Wat Khao Chedi |
Understanding Airbnb License Requirements & STR Laws in Baan Don Sai (2025)
While Baan Don Sai, Surat Thani Province, Thailand currently shows low STR regulations, specific Airbnb license requirements might still exist or change. Always verify the latest short term rental regulations and Airbnb license requirements directly with local government authorities for Baan Don Sai to ensure full compliance before hosting.
(Source: AirROI data, 2025, finding no licensed listings among those analyzed)
Top Performing Airbnb Properties in Baan Don Sai (2025)
Benchmark your potential! Explore examples of top-performing Airbnb properties in Baan Don Saibased on Trailing Twelve Month (TTM) revenue. Analyze their characteristics, revenue, occupancy rate, and ADR to understand what drives success in this market.
Villa Douce
Entire Place • 4 bedrooms
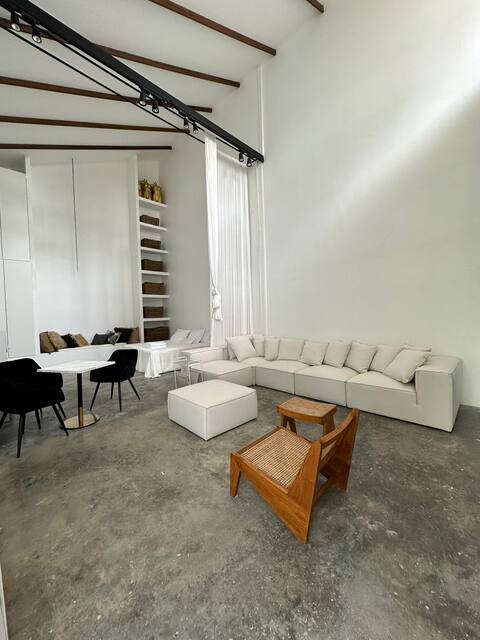
The White Loft - Bantai
Entire Place • 1 bedroom
BaiToey Room
Private Room • 1 bedroom

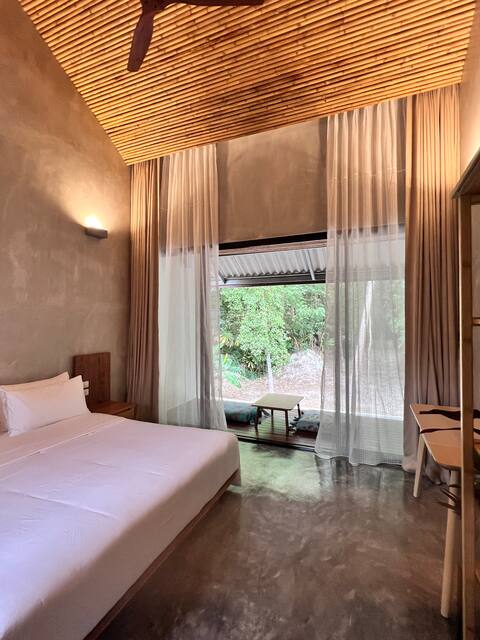
Modern Tropical Design Mezzanine Studio
Entire Place • 1 bedroom
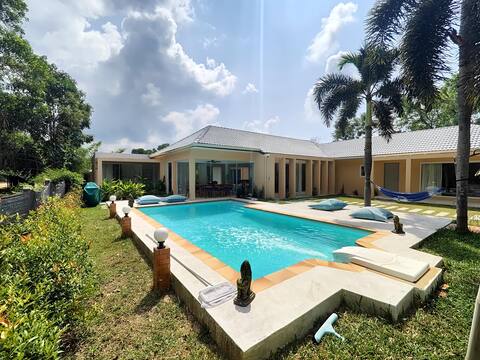
New House with Pool & Garden
Entire Place • 2 bedrooms
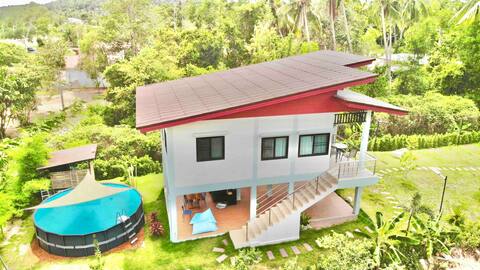
2-rooms cozy house in Thongsala Wi-Fi 500 Mbps #2
Entire Place • 2 bedrooms
Note: Performance varies based on location, size, amenities, seasonality, and management quality. Data reflects the past 12 months.
Top Performing Airbnb Hosts in Baan Don Sai (2025)
Learn from the best! This table showcases top-performing Airbnb hosts in Baan Don Sai based on the number of properties managed and estimated total revenue over the past year. Analyze their scale and performance metrics.
| Host Name | Properties | Grossing Revenue | Stay Reviews | Avg Rating |
|---|---|---|---|---|
| Seashine | 1 | $86,425 | 12 | 4.92/5.0 |
| Jan | 2 | $48,395 | 45 | 4.89/5.0 |
| Evgeniy | 13 | $45,668 | 249 | 4.40/5.0 |
| Mariia | 5 | $41,292 | 54 | 4.80/5.0 |
| Jidapha | 2 | $24,189 | 41 | 4.93/5.0 |
| Host #32667911 | 1 | $11,543 | 0 | 0.00/5.0 |
| Inna | 1 | $6,892 | 58 | 4.98/5.0 |
| Reuben | 1 | $854 | 5 | 4.40/5.0 |
Analyzing the strategies of top hosts, such as their property selection, pricing, and guest communication, can offer valuable lessons for optimizing your own Airbnb operations in Baan Don Sai.
Dive Deeper: Advanced Baan Don Sai STR Market Data (2025)
Ready to unlock more insights? AirROI provides access to advanced metrics and comprehensive Airbnb data for Baan Don Sai. Explore detailed analytics beyond this report to refine your investment strategy, optimize pricing, and maximize your vacation rental profits.
Explore Advanced MetricsBaan Don Sai Short-Term Rental Market Composition (2025): Property & Room Types
Room Type Distribution
Property Type Distribution
Market Composition Insights for Baan Don Sai
- The Baan Don Sai Airbnb market composition is heavily skewed towards Private Room listings, which make up 57.7% of the 26 active rentals. This indicates strong guest preference for privacy and space.
- Looking at the property type distribution in Baan Don Sai, House properties are the most common (42.3%), reflecting the local real estate landscape.
- Houses represent a significant 42.3% portion, catering likely to families or larger groups.
- The presence of 26.9% Hotel/Boutique listings indicates integration with traditional hospitality.
Baan Don Sai Airbnb Room Capacity Analysis (2025): Bedroom Distribution
Distribution of Listings by Number of Bedrooms
Room Capacity Insights for Baan Don Sai
- The dominant room capacity in Baan Don Sai is 1 bedroom listings, making up 69.2% of the market. This suggests a strong demand for properties suitable for couples or solo travelers.
- Together, 1 bedroom and 2 bedrooms properties represent 88.4% of the active Airbnb listings in Baan Don Sai, indicating a high concentration in these sizes.
- With over half the market (69.2%) consisting of studios or 1-bedroom units, Baan Don Sai is particularly well-suited for individuals or couples.
- Listings with 3+ bedrooms (3.8%) represent a smaller niche, potentially indicating an underserved market for larger group accommodations in Baan Don Sai.
Baan Don Sai Vacation Rental Guest Capacity Trends (2025)
Distribution of Listings by Guest Capacity
Guest Capacity Insights for Baan Don Sai
- The most common guest capacity trend in Baan Don Sai vacation rentals is listings accommodating 2 guests (53.8%). This suggests the primary traveler segment is likely couples or solo travelers.
- Properties designed for 2 guests and 3 guests dominate the Baan Don Sai STR market, accounting for 76.9% of listings.
- A significant 57.6% of listings cater specifically to 1-2 guests, highlighting strong demand from couples and solo travelers in Baan Don Sai.
- Listings for large groups (6+ guests) are relatively rare (3.8%), potentially indicating an opportunity for hosts targeting this segment in Baan Don Sai.
- On average, properties in Baan Don Sai are equipped to host 2.4 guests.
Baan Don Sai Airbnb Booking Patterns (2025): Available vs. Booked Days
Available Days Distribution
Booked Days Distribution
Booking Pattern Insights for Baan Don Sai
- The most common availability pattern in Baan Don Sai falls within the 181-270 days range, representing 42.3% of listings. This suggests many properties have significant open periods on their calendars.
- Approximately 50.0% of listings show high availability (181+ days open annually), indicating potential for increased bookings or specific owner usage patterns.
- For booked days, the 181-270 days range is most frequent in Baan Don Sai (42.3%), reflecting common guest stay durations or potential owner blocking patterns.
- A notable 53.8% of properties secure long booking periods (181+ days booked per year), highlighting successful long-term rental strategies or significant owner usage.
Baan Don Sai Airbnb Minimum Stay Requirements Analysis
Distribution of Listings by Minimum Night Requirement
2 Nights
7 listings
29.2% of total
3 Nights
1 listings
4.2% of total
4-6 Nights
7 listings
29.2% of total
30+ Nights
9 listings
37.5% of total
Key Insights
- The most prevalent minimum stay requirement in Baan Don Sai is 30+ Nights, adopted by 37.5% of listings. This highlights the market's preference for longer commitments.
- A significant segment (37.5%) caters to monthly stays (30+ nights) in Baan Don Sai, pointing to opportunities in the extended-stay market.
Recommendations
- Align with the market by considering a 30+ Nights minimum stay, as 37.5% of Baan Don Sai hosts use this setting.
- Explore offering discounts for stays of 30+ nights to attract the 37.5% of the market seeking extended stays.
- Adjust minimum nights based on seasonality – potentially shorter during low season and longer during peak demand periods in Baan Don Sai.
Baan Don Sai Airbnb Cancellation Policy Trends Analysis (2025)
Flexible
12 listings
54.5% of total
Firm
4 listings
18.2% of total
Strict
6 listings
27.3% of total
Cancellation Policy Insights for Baan Don Sai
- The prevailing Airbnb cancellation policy trend in Baan Don Sai is Flexible, used by 54.5% of listings.
- There's a relatively balanced mix between guest-friendly (54.5%) and stricter (45.5%) policies, offering choices for different guest needs.
Recommendations for Hosts
- Consider adopting a Flexible policy to align with the 54.5% market standard in Baan Don Sai.
- Given the high prevalence of Flexible policies (54.5%), offering this can enhance booking appeal, especially during shoulder seasons.
- Regularly review your cancellation policy against competitors and market demand shifts in Baan Don Sai.
Baan Don Sai STR Booking Lead Time Analysis (2025)
Average Booking Lead Time by Month
Booking Lead Time Insights for Baan Don Sai
- The overall average booking lead time for vacation rentals in Baan Don Sai is 45 days.
- Guests book furthest in advance for stays during April (average 181 days), likely coinciding with peak travel demand or local events.
- The shortest booking windows occur for stays in June (average 10 days), indicating more last-minute travel plans during this time.
- Seasonally, Spring (92 days avg.) sees the longest lead times, while Summer (20 days avg.) has the shortest, reflecting typical travel planning cycles.
Recommendations for Hosts
- Use the overall average lead time (45 days) as a baseline for your pricing and availability strategy in Baan Don Sai.
- For April stays, consider implementing length-of-stay discounts or slightly higher rates for bookings made less than 181 days out to capitalize on advance planning.
- During June, focus on last-minute booking availability and promotions, as guests book with very short notice (10 days avg.).
- Target marketing efforts for the Spring season well in advance (at least 92 days) to capture early planners.
- Monitor your own booking lead times against these Baan Don Sai averages to identify opportunities for dynamic pricing adjustments.
Popular & Essential Airbnb Amenities in Baan Don Sai (2025)
Amenity Prevalence
Amenity Insights for Baan Don Sai
- Essential amenities in Baan Don Sai that guests expect include: Free parking on premises, Air conditioning, Wifi. Lacking these (any) could significantly impact bookings.
- Popular amenities like Cooking basics, Kitchen, Hot water are common but not universal. Offering these can provide a competitive edge.
Recommendations for Hosts
- Ensure your listing includes all essential amenities for Baan Don Sai: Free parking on premises, Air conditioning, Wifi.
- Prioritize adding missing essentials: Wifi.
- Consider adding popular differentiators like Cooking basics or Kitchen to increase appeal.
- Highlight unique or less common amenities you offer (e.g., hot tub, dedicated workspace, EV charger) in your listing description and photos.
- Regularly check competitor amenities in Baan Don Sai to stay competitive.
Baan Don Sai Airbnb Guest Demographics & Profile Analysis (2025)
Guest Profile Summary for Baan Don Sai
- The typical guest profile for Airbnb in Baan Don Sai consists of predominantly international visitors (99%), with top international origins including United Kingdom, typically belonging to the Post-2000s (Gen Z/Alpha) group (50%), primarily speaking English or German.
- Domestic travelers account for 1.1% of guests.
- Key international markets include Germany (33.9%) and United Kingdom (11.1%).
- Top languages spoken are English (44.8%) followed by German (22.2%).
- A significant demographic segment is the Post-2000s (Gen Z/Alpha) group, representing 50% of guests.
Recommendations for Hosts
- Focus marketing internationally, particularly towards travelers from United Kingdom.
- Tailor amenities and listing descriptions to appeal to the dominant Post-2000s (Gen Z/Alpha) demographic (e.g., highlight fast WiFi, smart home features, local guides).
- Highlight unique local experiences or amenities relevant to the primary guest profile.
- Consider seasonal promotions aligned with peak travel times for key origin markets.
Nearby Short-Term Rental Market Comparison
How does the Baan Don Sai Airbnb market stack up against its neighbors? Compare key performance metrics like average monthly revenue, ADR, and occupancy rates in surrounding areas to understand the broader regional STR landscape.
| Market | Active Properties | Monthly Revenue | Daily Rate | Avg. Occupancy |
|---|---|---|---|---|
| Ban Khao Pi Lai | 17 | $8,369 | $2002.90 | 25% |
| Pa Khlok | 62 | $5,400 | $753.98 | 34% |
| Baan Thong Po | 125 | $3,330 | $323.13 | 48% |
| Ban Bang Khao | 44 | $3,247 | $421.06 | 39% |
| Ko Samui | 801 | $2,972 | $349.72 | 45% |
| Baan Chaweng Noi | 311 | $2,867 | $306.84 | 46% |
| Baan Taling Ngam | 22 | $2,767 | $406.97 | 34% |
| Haad Klong Jaak | 35 | $2,685 | $263.02 | 45% |
| Baan Thong Krut | 24 | $2,526 | $303.23 | 46% |
| Baan Plai Laem | 235 | $2,405 | $271.90 | 48% |