Ban Nong Samo Airbnb Market Analysis 2025: Short Term Rental Data & Vacation Rental Statistics in Prachuap Khiri Khan Province, Thailand
Is Airbnb profitable in Ban Nong Samo in 2025? Explore comprehensive Airbnb analytics for Ban Nong Samo, Prachuap Khiri Khan Province, Thailand to uncover income potential. This 2025 STR market report for Ban Nong Samo, based on AirROI data from April 2024 to March 2025, reveals key trends in the niche market of 17 active listings.
Whether you're considering an Airbnb investment in Ban Nong Samo, optimizing your existing vacation rental, or exploring rental arbitrage opportunities, understanding the Ban Nong Samo Airbnb data is crucial. Leveraging the low regulation environment is key to maximizing your short term rental income potential. Let's dive into the specifics.
Key Ban Nong Samo Airbnb Performance Metrics Overview
Monthly Airbnb Revenue Variations & Income Potential in Ban Nong Samo (2025)
Understanding the monthly revenue variations for Airbnb listings in Ban Nong Samo is key to maximizing your short term rental income potential. Seasonality significantly impacts earnings. Our analysis, based on data from the past 12 months, shows that the peak revenue month for STRs in Ban Nong Samo is typically November, while June often presents the lowest earnings, highlighting opportunities for strategic pricing adjustments during shoulder and low seasons. Explore the typical Airbnb income in Ban Nong Samo across different performance tiers:
- Best-in-class properties (Top 10%) achieve $2,168+ monthly, often utilizing dynamic pricing and superior guest experiences.
- Strong performing properties (Top 25%) earn $1,407 or more, indicating effective management and desirable locations/amenities.
- Typical properties (Median) generate around $840 per month, representing the average market performance.
- Entry-level properties (Bottom 25%) see earnings around $497, often with potential for optimization.
Average Monthly Airbnb Earnings Trend in Ban Nong Samo
Ban Nong Samo Airbnb Occupancy Rate Trends (2025)
Maximize your bookings by understanding the Ban Nong Samo STR occupancy trends. Seasonal demand shifts significantly influence how often properties are booked. Typically, Decembersees the highest demand (peak season occupancy), while October experiences the lowest (low season). Effective strategies, like adjusting minimum stays or offering promotions, can boost occupancy during slower periods. Here's how different property tiers perform in Ban Nong Samo:
- Best-in-class properties (Top 10%) achieve 78%+ occupancy, indicating high desirability and potentially optimized availability.
- Strong performing properties (Top 25%) maintain 53% or higher occupancy, suggesting good market fit and guest satisfaction.
- Typical properties (Median) have an occupancy rate around 38%.
- Entry-level properties (Bottom 25%) average 17% occupancy, potentially facing higher vacancy.
Average Monthly Occupancy Rate Trend in Ban Nong Samo
Average Daily Rate (ADR) Airbnb Trends in Ban Nong Samo (2025)
Effective short term rental pricing strategy in Ban Nong Samo involves understanding monthly ADR fluctuations. The Average Daily Rate (ADR) for Airbnb in Ban Nong Samo typically peaks in October and dips lowest during February. Leveraging Airbnb dynamic pricing tools or strategies based on this seasonality can significantly boost revenue. Here's a look at the typical nightly rates achieved:
- Best-in-class properties (Top 10%) command rates of $144+ per night, often due to premium features or locations.
- Strong performing properties (Top 25%) achieve nightly rates of $115 or more.
- Typical properties (Median) charge around $72 per night.
- Entry-level properties (Bottom 25%) earn around $52 per night.
Average Daily Rate (ADR) Trend by Month in Ban Nong Samo
Get Live Ban Nong Samo Market Intelligence 👇

Explore Real-time Analytics
Airbnb Seasonality Analysis & Trends in Ban Nong Samo (2025)
Peak Season (November, December, January)
- Revenue averages $1,504 per month
- Occupancy rates average 55.7%
- Daily rates average $74
Shoulder Season
- Revenue averages $976 per month
- Occupancy maintains around 40.3%
- Daily rates hold near $126
Low Season (June, September, October)
- Revenue drops to average $615 per month
- Occupancy decreases to average 23.5%
- Daily rates adjust to average $153
Seasonality Insights for Ban Nong Samo
- The Airbnb seasonality in Ban Nong Samo shows highly seasonal trends requiring careful strategy. While the sections above show seasonal averages, it's also insightful to look at the extremes:
- During the high season, the absolute peak month showcases Ban Nong Samo's highest earning potential, with monthly revenues capable of climbing to $1,614, occupancy reaching a high of 60.7%, and ADRs peaking at $153.
- Conversely, the slowest single month of the year, typically falling within the low season, marks the market's lowest point. In this month, revenue might dip to $438, occupancy could drop to 16.6%, and ADRs may adjust down to $73.
- Understanding both the seasonal averages and these monthly peaks and troughs in revenue, occupancy, and ADR is crucial for maximizing your Airbnb profit potential in Ban Nong Samo.
Seasonal Strategies for Maximizing Profit
- Peak Season: Maximize revenue through premium pricing and potentially longer minimum stays. Ensure high availability.
- Low Season: Offer competitive pricing, special promotions (e.g., extended stay discounts), and flexible cancellation policies. Target off-season travelers like remote workers or budget-conscious guests.
- Shoulder Seasons: Implement dynamic pricing that balances peak and low rates. Target weekend travelers or specific events. Offer slightly more flexible terms than peak season.
- Regularly analyze your own performance against these Ban Nong Samo seasonality benchmarks and adjust your pricing and availability strategy accordingly.
Best Areas for Airbnb Investment in Ban Nong Samo (2025)
Exploring the top neighborhoods for short-term rentals in Ban Nong Samo? This section highlights key areas, outlining why they are attractive for hosts and guests, along with notable local attractions. Consider these locations based on your target guest profile and investment strategy.
| Neighborhood / Area | Why Host Here? (Target Guests & Appeal) | Key Attractions & Landmarks |
|---|---|---|
| Khao Sam Roi Yot National Park | A stunning natural park known for its mountains, beaches, and wildlife. Great for tourists who love nature and outdoor activities like hiking and camping. | Khao Sam Roi Yot Beach, Phraya Nakhon Cave, Bird Watching, Khao Sam Roi Yot National Park Trails, Ban Pak Nam Pran |
| Hua Hin Beach | Famous for its long stretches of beach and family-friendly resorts, Hua Hin attracts both domestic and international tourists looking for relaxation and leisure activities. | Hua Hin Night Market, Cicada Market, Hua Hin Railway Station, Wat Huay Mongkol, Vana Nava Water Jungle |
| Pranburi | Known for its quieter beaches and natural beauty, Pranburi is ideal for those seeking a laid-back atmosphere away from the hustle and bustle of Hua Hin. | Pak Nam Pran Beach, Pranburi Forest Park, Pak Nam Pran Market, Khao Kalok, Pranburi Beach |
| Baan Krut | A hidden gem beach destination, Baan Krut is perfect for those looking for pristine beaches and a tranquil environment. | Baan Krut Beach, Wat Thammikaram, Nang Rong Waterfall, Baan Krut Fishing Village, Khao Borkai |
| Bang Saphan | This area offers beautiful beaches and a relaxed atmosphere, great for travelers seeking untouched nature and local culture. | Bang Saphan Noi Beach, Sai Khao Beach, Khao Chong Krajub Cave, Thai Seafood Markets, Local Fisherman Villages |
| Ao Manao | A beautiful bay known for its clear waters and scenic views, Ao Manao is close to Prachuap Khiri Khan and offers both relaxation and activities. | Ao Manao Beach, Military History Museum, Promthep Cape, Fishing and Kayaking, Scenic Coastal Paths |
| Koh Talu | An unspoiled island destination, Koh Talu is perfect for snorkeling, diving, and enjoying nature away from the crowded tourist spots. | Snorkeling spots, Koh Talu Beach, Coral reefs, Diving opportunities, Tranquil nature trails |
| Prachuap Khiri Khan Town | The charming provincial town offers a mix of history, culture, and local cuisine, making it perfect for those wanting an authentic Thai experience. | Ao Prachuap Bay, Prachuap Khiri Khan Hill, The Royal Pavilion, Local street markets, Fishery Port |
Understanding Airbnb License Requirements & STR Laws in Ban Nong Samo (2025)
While Ban Nong Samo, Prachuap Khiri Khan Province, Thailand currently shows low STR regulations, specific Airbnb license requirements might still exist or change. Always verify the latest short term rental regulations and Airbnb license requirements directly with local government authorities for Ban Nong Samo to ensure full compliance before hosting.
(Source: AirROI data, 2025, finding no licensed listings among those analyzed)
Top Performing Airbnb Properties in Ban Nong Samo (2025)
Benchmark your potential! Explore examples of top-performing Airbnb properties in Ban Nong Samobased on Trailing Twelve Month (TTM) revenue. Analyze their characteristics, revenue, occupancy rate, and ADR to understand what drives success in this market.
HuaHin/ PaiMai PoolVilla 4BR /Karaoke byน้องมังคุด
Entire Place • 4 bedrooms
Modern Villa Club House Hua Hin-Private Spa Pool Single House
Entire Place • 3 bedrooms
Modern Villa Club House Hua Hin-泳池四合院
Entire Place • 4 bedrooms
modern villa huahin 228/15
Entire Place • 3 bedrooms
Moderne Poolvilla, Hua Hin
Entire Place • 2 bedrooms

Tatami villa
Entire Place • 2 bedrooms
Note: Performance varies based on location, size, amenities, seasonality, and management quality. Data reflects the past 12 months.
Top Performing Airbnb Hosts in Ban Nong Samo (2025)
Learn from the best! This table showcases top-performing Airbnb hosts in Ban Nong Samo based on the number of properties managed and estimated total revenue over the past year. Analyze their scale and performance metrics.
| Host Name | Properties | Grossing Revenue | Stay Reviews | Avg Rating |
|---|---|---|---|---|
| Bing | 3 | $29,042 | 13 | 4.87/5.0 |
| Alex | 1 | $21,646 | 82 | 4.76/5.0 |
| Christina | 4 | $16,449 | 24 | 4.63/5.0 |
| Roland | 1 | $5,943 | 4 | 5.00/5.0 |
| Rassamee | 1 | $3,525 | 32 | 4.69/5.0 |
| Helene Praneet | 1 | $2,873 | 16 | 4.81/5.0 |
| Tina | 3 | $2,806 | 18 | 4.39/5.0 |
| Host #41793440 | 1 | $871 | 0 | 0.00/5.0 |
| Dujdao | 2 | $323 | 17 | 4.69/5.0 |
Analyzing the strategies of top hosts, such as their property selection, pricing, and guest communication, can offer valuable lessons for optimizing your own Airbnb operations in Ban Nong Samo.
Dive Deeper: Advanced Ban Nong Samo STR Market Data (2025)
Ready to unlock more insights? AirROI provides access to advanced metrics and comprehensive Airbnb data for Ban Nong Samo. Explore detailed analytics beyond this report to refine your investment strategy, optimize pricing, and maximize your vacation rental profits.
Explore Advanced MetricsBan Nong Samo Short-Term Rental Market Composition (2025): Property & Room Types
Room Type Distribution
Property Type Distribution
Market Composition Insights for Ban Nong Samo
- The Ban Nong Samo Airbnb market composition is heavily skewed towards Entire Home/Apt listings, which make up 100% of the 17 active rentals. This indicates strong guest preference for privacy and space.
- Looking at the property type distribution in Ban Nong Samo, House properties are the most common (88.2%), reflecting the local real estate landscape.
- Houses represent a significant 88.2% portion, catering likely to families or larger groups.
Ban Nong Samo Airbnb Room Capacity Analysis (2025): Bedroom Distribution
Distribution of Listings by Number of Bedrooms
Room Capacity Insights for Ban Nong Samo
- The dominant room capacity in Ban Nong Samo is 3 bedrooms listings, making up 41.2% of the market. This suggests a strong demand for properties suitable for families or small groups.
- Together, 3 bedrooms and 2 bedrooms properties represent 76.5% of the active Airbnb listings in Ban Nong Samo, indicating a high concentration in these sizes.
- A significant 53.0% of listings offer 3+ bedrooms, catering to larger groups and families seeking more space in Ban Nong Samo.
Ban Nong Samo Vacation Rental Guest Capacity Trends (2025)
Distribution of Listings by Guest Capacity
Guest Capacity Insights for Ban Nong Samo
- The most common guest capacity trend in Ban Nong Samo vacation rentals is listings accommodating 4 guests (35.3%). This suggests the primary traveler segment is likely small families or groups.
- Properties designed for 4 guests and 6 guests dominate the Ban Nong Samo STR market, accounting for 64.7% of listings.
- 47.0% of properties accommodate 6+ guests, serving the market segment for larger families or group travel in Ban Nong Samo.
- On average, properties in Ban Nong Samo are equipped to host 5.1 guests.
Ban Nong Samo Airbnb Booking Patterns (2025): Available vs. Booked Days
Available Days Distribution
Booked Days Distribution
Booking Pattern Insights for Ban Nong Samo
- The most common availability pattern in Ban Nong Samo falls within the 271-366 days range, representing 70.6% of listings. This suggests many properties have significant open periods on their calendars.
- Approximately 94.1% of listings show high availability (181+ days open annually), indicating potential for increased bookings or specific owner usage patterns.
- For booked days, the 1-30 days range is most frequent in Ban Nong Samo (52.9%), reflecting common guest stay durations or potential owner blocking patterns.
- A notable 5.9% of properties secure long booking periods (181+ days booked per year), highlighting successful long-term rental strategies or significant owner usage.
Ban Nong Samo Airbnb Minimum Stay Requirements Analysis
Distribution of Listings by Minimum Night Requirement
1 Night
8 listings
47.1% of total
2 Nights
4 listings
23.5% of total
3 Nights
1 listings
5.9% of total
4-6 Nights
1 listings
5.9% of total
7-29 Nights
2 listings
11.8% of total
30+ Nights
1 listings
5.9% of total
Key Insights
- The most prevalent minimum stay requirement in Ban Nong Samo is 1 Night, adopted by 47.1% of listings. This highlights the market's preference for shorter, flexible bookings.
- A strong majority (70.6%) of the Ban Nong Samo Airbnb data shows acceptance of very short stays (1-2 nights), indicating a dynamic, high-turnover market.
Recommendations
- Align with the market by considering a 1 Night minimum stay, as 47.1% of Ban Nong Samo hosts use this setting.
- Explore offering discounts for stays of 30+ nights to attract the 5.9% of the market seeking extended stays.
- Adjust minimum nights based on seasonality – potentially shorter during low season and longer during peak demand periods in Ban Nong Samo.
Ban Nong Samo Airbnb Cancellation Policy Trends Analysis (2025)
Flexible
5 listings
31.3% of total
Firm
2 listings
12.5% of total
Strict
9 listings
56.3% of total
Cancellation Policy Insights for Ban Nong Samo
- The prevailing Airbnb cancellation policy trend in Ban Nong Samo is Strict, used by 56.3% of listings.
- A majority (68.8%) of hosts in Ban Nong Samo utilize Firm or Strict policies, indicating a market where hosts prioritize booking security.
Recommendations for Hosts
- Consider adopting a Strict policy to align with the 56.3% market standard in Ban Nong Samo.
- With 56.3% using Strict terms, this is a viable option in Ban Nong Samo, particularly for high-value properties or during peak demand periods.
- Regularly review your cancellation policy against competitors and market demand shifts in Ban Nong Samo.
Ban Nong Samo STR Booking Lead Time Analysis (2025)
Average Booking Lead Time by Month
Booking Lead Time Insights for Ban Nong Samo
- The overall average booking lead time for vacation rentals in Ban Nong Samo is 58 days.
- Guests book furthest in advance for stays during January (average 113 days), likely coinciding with peak travel demand or local events.
- The shortest booking windows occur for stays in June (average 12 days), indicating more last-minute travel plans during this time.
- Seasonally, Winter (95 days avg.) sees the longest lead times, while Summer (20 days avg.) has the shortest, reflecting typical travel planning cycles.
Recommendations for Hosts
- Use the overall average lead time (58 days) as a baseline for your pricing and availability strategy in Ban Nong Samo.
- For January stays, consider implementing length-of-stay discounts or slightly higher rates for bookings made less than 113 days out to capitalize on advance planning.
- During June, focus on last-minute booking availability and promotions, as guests book with very short notice (12 days avg.).
- Target marketing efforts for the Winter season well in advance (at least 95 days) to capture early planners.
- Monitor your own booking lead times against these Ban Nong Samo averages to identify opportunities for dynamic pricing adjustments.
Popular & Essential Airbnb Amenities in Ban Nong Samo (2025)
Amenity Prevalence
Amenity Insights for Ban Nong Samo
- Essential amenities in Ban Nong Samo that guests expect include: Free parking on premises, TV, Air conditioning. Lacking these (any) could significantly impact bookings.
- Popular amenities like Wifi, Kitchen, Essentials are common but not universal. Offering these can provide a competitive edge.
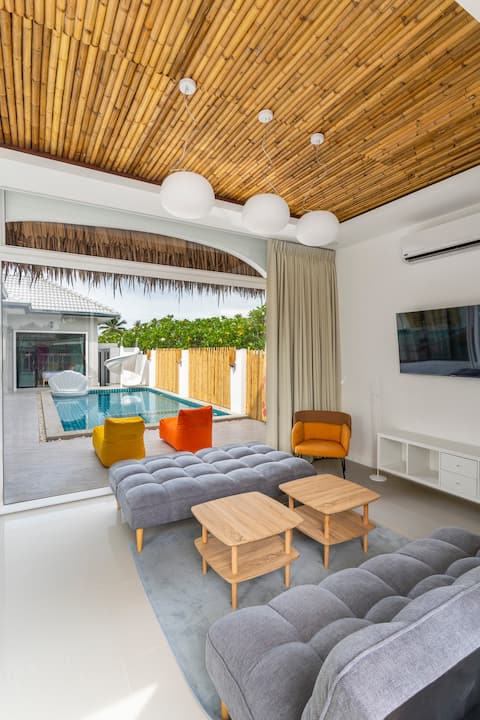
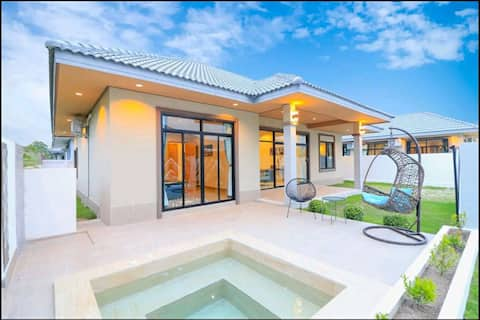
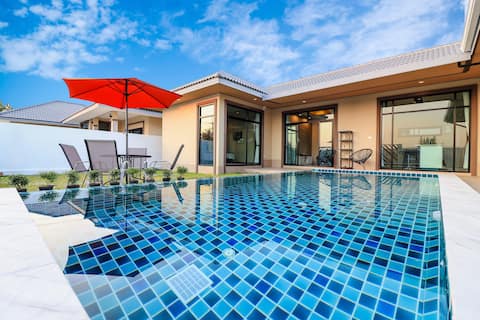
- A pool is a highly desired but not standard amenity, making it a key feature for attracting guests seeking leisure in Ban Nong Samo.
- Warning: Wifi is not universally provided but is considered essential globally. Ensure reliable Wifi is offered.
Recommendations for Hosts
- Ensure your listing includes all essential amenities for Ban Nong Samo: Free parking on premises, TV, Air conditioning.
- Consider adding popular differentiators like Wifi or Kitchen to increase appeal.
- Highlight unique or less common amenities you offer (e.g., hot tub, dedicated workspace, EV charger) in your listing description and photos.
- Regularly check competitor amenities in Ban Nong Samo to stay competitive.
Ban Nong Samo Airbnb Guest Demographics & Profile Analysis (2025)
Guest Profile Summary for Ban Nong Samo
- The typical guest profile for Airbnb in Ban Nong Samo consists of a mix of domestic (37%) and international guests, with top international origins including United States, typically belonging to the Post-2000s (Gen Z/Alpha) group (50%), primarily speaking English or Thai.
- Domestic travelers account for 36.7% of guests.
- Key international markets include Thailand (36.7%) and United States (20%).
- Top languages spoken are English (45.5%) followed by Thai (24.2%).
- A significant demographic segment is the Post-2000s (Gen Z/Alpha) group, representing 50% of guests.
Recommendations for Hosts
- Focus marketing internationally, particularly towards travelers from United States.
- Tailor amenities and listing descriptions to appeal to the dominant Post-2000s (Gen Z/Alpha) demographic (e.g., highlight fast WiFi, smart home features, local guides).
- Highlight unique local experiences or amenities relevant to the primary guest profile.
- Consider seasonal promotions aligned with peak travel times for key origin markets.
Nearby Short-Term Rental Market Comparison
How does the Ban Nong Samo Airbnb market stack up against its neighbors? Compare key performance metrics like average monthly revenue, ADR, and occupancy rates in surrounding areas to understand the broader regional STR landscape.
| Market | Active Properties | Monthly Revenue | Daily Rate | Avg. Occupancy |
|---|---|---|---|---|
| Hat Chao Samran | 14 | $1,981 | $507.96 | 24% |
| Na Chom Thian | 145 | $1,696 | $222.84 | 34% |
| Huai Yai | 24 | $1,599 | $318.51 | 30% |
| Bang Lamung | 16 | $1,586 | $275.95 | 24% |
| Nong Prue | 37 | $1,576 | $276.13 | 31% |
| Ban Nong Bua | 35 | $1,475 | $213.88 | 31% |
| Pattaya | 225 | $1,374 | $249.78 | 33% |
| Tambon Hua Hin | 17 | $1,268 | $182.16 | 37% |
| Ban Nong Hiang | 55 | $1,237 | $208.22 | 36% |
| Nong Pla Lai | 12 | $1,142 | $197.97 | 25% |