Patong Airbnb Market Analysis 2025: Short Term Rental Data & Vacation Rental Statistics in Phuket Province, Thailand
Is Airbnb profitable in Patong in 2025? Explore comprehensive Airbnb analytics for Patong, Phuket Province, Thailand to uncover income potential. This 2025 STR market report for Patong, based on AirROI data from April 2024 to March 2025, reveals key trends in the bustling market of 1,708 active listings.
Whether you're considering an Airbnb investment in Patong, optimizing your existing vacation rental, or exploring rental arbitrage opportunities, understanding the Patong Airbnb data is crucial. Leveraging the low regulation environment is key to maximizing your short term rental income potential. Let's dive into the specifics.
Key Patong Airbnb Performance Metrics Overview
Monthly Airbnb Revenue Variations & Income Potential in Patong (2025)
Understanding the monthly revenue variations for Airbnb listings in Patong is key to maximizing your short term rental income potential. Seasonality significantly impacts earnings. Our analysis, based on data from the past 12 months, shows that the peak revenue month for STRs in Patong is typically January, while September often presents the lowest earnings, highlighting opportunities for strategic pricing adjustments during shoulder and low seasons. Explore the typical Airbnb income in Patong across different performance tiers:
- Best-in-class properties (Top 10%) achieve $5,275+ monthly, often utilizing dynamic pricing and superior guest experiences.
- Strong performing properties (Top 25%) earn $2,474 or more, indicating effective management and desirable locations/amenities.
- Typical properties (Median) generate around $1,144 per month, representing the average market performance.
- Entry-level properties (Bottom 25%) see earnings around $505, often with potential for optimization.
Average Monthly Airbnb Earnings Trend in Patong
Patong Airbnb Occupancy Rate Trends (2025)
Maximize your bookings by understanding the Patong STR occupancy trends. Seasonal demand shifts significantly influence how often properties are booked. Typically, Januarysees the highest demand (peak season occupancy), while June experiences the lowest (low season). Effective strategies, like adjusting minimum stays or offering promotions, can boost occupancy during slower periods. Here's how different property tiers perform in Patong:
- Best-in-class properties (Top 10%) achieve 86%+ occupancy, indicating high desirability and potentially optimized availability.
- Strong performing properties (Top 25%) maintain 72% or higher occupancy, suggesting good market fit and guest satisfaction.
- Typical properties (Median) have an occupancy rate around 43%.
- Entry-level properties (Bottom 25%) average 18% occupancy, potentially facing higher vacancy.
Average Monthly Occupancy Rate Trend in Patong
Average Daily Rate (ADR) Airbnb Trends in Patong (2025)
Effective short term rental pricing strategy in Patong involves understanding monthly ADR fluctuations. The Average Daily Rate (ADR) for Airbnb in Patong typically peaks in January and dips lowest during September. Leveraging Airbnb dynamic pricing tools or strategies based on this seasonality can significantly boost revenue. Here's a look at the typical nightly rates achieved:
- Best-in-class properties (Top 10%) command rates of $335+ per night, often due to premium features or locations.
- Strong performing properties (Top 25%) achieve nightly rates of $159 or more.
- Typical properties (Median) charge around $75 per night.
- Entry-level properties (Bottom 25%) earn around $42 per night.
Average Daily Rate (ADR) Trend by Month in Patong
Get Live Patong Market Intelligence 👇

Explore Real-time Analytics
Airbnb Seasonality Analysis & Trends in Patong (2025)
Peak Season (January, December, February)
- Revenue averages $3,437 per month
- Occupancy rates average 54.9%
- Daily rates average $207
Shoulder Season
- Revenue averages $2,134 per month
- Occupancy maintains around 43.1%
- Daily rates hold near $144
Low Season (August, September, October)
- Revenue drops to average $1,562 per month
- Occupancy decreases to average 40.0%
- Daily rates adjust to average $127
Seasonality Insights for Patong
- The Airbnb seasonality in Patong shows highly seasonal trends requiring careful strategy. While the sections above show seasonal averages, it's also insightful to look at the extremes:
- During the high season, the absolute peak month showcases Patong's highest earning potential, with monthly revenues capable of climbing to $3,907, occupancy reaching a high of 57.4%, and ADRs peaking at $216.
- Conversely, the slowest single month of the year, typically falling within the low season, marks the market's lowest point. In this month, revenue might dip to $1,419, occupancy could drop to 37.5%, and ADRs may adjust down to $125.
- Understanding both the seasonal averages and these monthly peaks and troughs in revenue, occupancy, and ADR is crucial for maximizing your Airbnb profit potential in Patong.
Seasonal Strategies for Maximizing Profit
- Peak Season: Maximize revenue through premium pricing and potentially longer minimum stays. Ensure high availability.
- Low Season: Offer competitive pricing, special promotions (e.g., extended stay discounts), and flexible cancellation policies. Target off-season travelers like remote workers or budget-conscious guests.
- Shoulder Seasons: Implement dynamic pricing that balances peak and low rates. Target weekend travelers or specific events. Offer slightly more flexible terms than peak season.
- Regularly analyze your own performance against these Patong seasonality benchmarks and adjust your pricing and availability strategy accordingly.
Best Areas for Airbnb Investment in Patong (2025)
Exploring the top neighborhoods for short-term rentals in Patong? This section highlights key areas, outlining why they are attractive for hosts and guests, along with notable local attractions. Consider these locations based on your target guest profile and investment strategy.
| Neighborhood / Area | Why Host Here? (Target Guests & Appeal) | Key Attractions & Landmarks |
|---|---|---|
| Patong Beach | The most famous beach in Phuket, known for its vibrant nightlife, water sports, and beach activities. It attracts millions of tourists each year looking for sun and fun. | Patong Beach, Bangla Road, Jungceylon Shopping Mall, Paradise Beach, Simon Cabaret |
| Kalim Beach | Just north of Patong, Kalim Beach offers a quieter alternative with stunning views and a more relaxed atmosphere, ideal for couples and families. | Kalim Beach, Kalim Seafood, Shopping at local markets, Wat Suwan Khiri Wong |
| Tri Trang Beach | A beautiful, tranquil beach area perfect for those seeking a peaceful retreat away from the bustling Patong centre while still being close to attractions. | Tri Trang Beach, Freedom Beach, Siam Niramit Phuket, Sea Kayaking |
| Nanai Road | A bustling street that offers a taste of local life with numerous guesthouses, shops, and restaurants. It's popular among budget travelers who want access to Patong's amenities. | Nanai Road markets, Local restaurants, Massage parlors, Convenience stores |
| Sai Nam Yen | A lesser-known area that offers beautiful views and proximity to Patong but with a more local and authentic living experience. | Local temples, Markets, Views over Patong Bay |
| Baan Khai | An upcoming area that combines local charm with modern convenience, attracting those looking to invest in a more laid back atmosphere close to Patong. | Local cultural spots, Beaches, Phuket Elephant Sanctuary |
| Freedom Beach | Accessed mainly by boat, this stunning beach is a hidden gem attracting visitors looking for a more secluded beach experience. | Freedom Beach, Snorkeling spots, Scenic viewpoints |
| The Marina | A new development area aiming to attract high-end guests with luxury villas and waterfront properties in proximity to the beach and entertainment. | Marina facilities, Water sports, Luxury dining, Boat tours |
Understanding Airbnb License Requirements & STR Laws in Patong (2025)
While Patong, Phuket Province, Thailand currently shows low STR regulations, specific Airbnb license requirements might still exist or change. Always verify the latest short term rental regulations and Airbnb license requirements directly with local government authorities for Patong to ensure full compliance before hosting.
(Source: AirROI data, 2025, based on 0% licensed listings)
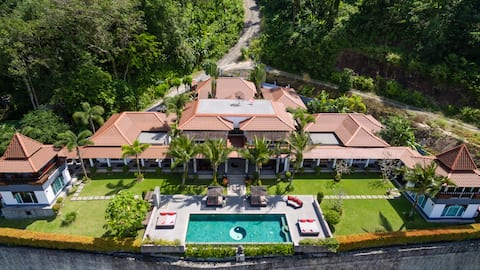
Top Performing Airbnb Properties in Patong (2025)
Benchmark your potential! Explore examples of top-performing Airbnb properties in Patongbased on Trailing Twelve Month (TTM) revenue. Analyze their characteristics, revenue, occupancy rate, and ADR to understand what drives success in this market.
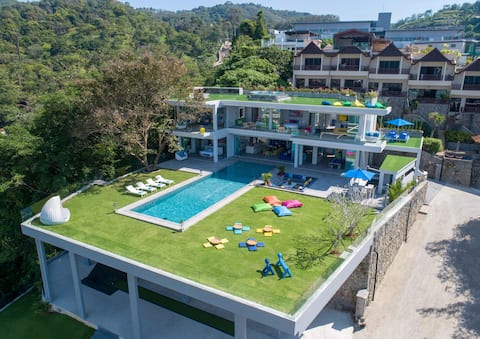
Villa Enjoy - Modern Luxury in Patong
Entire Place • 5 bedrooms
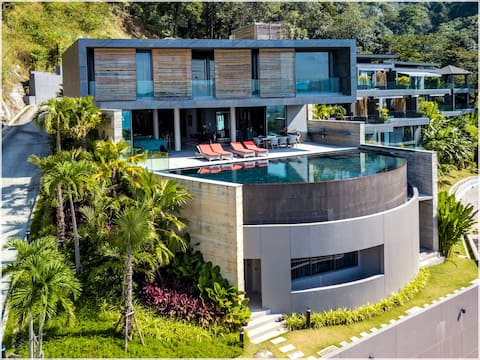
The Cube Ocean View Pool Villa
Entire Place • 4 bedrooms

Kalim Beach House - 7 bed Villa with Beach & Pool
Entire Place • 7 bedrooms
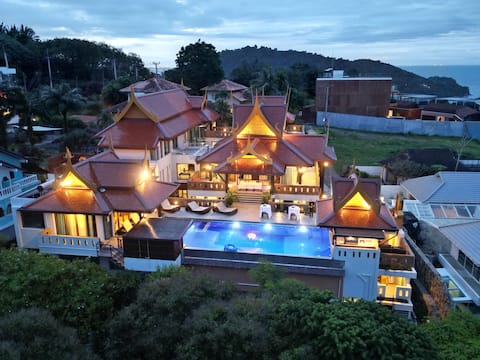
Luxurious & Exclusive 13-bedroom villa in Patong
Entire Place • 13 bedrooms

Luxury Villa in Kamala Beach Villa infinity
Entire Place • 10 bedrooms
Wondrous 8BR Boutique Villa in Patong w/ SEAVIEW
Entire Place • 8 bedrooms
Note: Performance varies based on location, size, amenities, seasonality, and management quality. Data reflects the past 12 months.
Top Performing Airbnb Hosts in Patong (2025)
Learn from the best! This table showcases top-performing Airbnb hosts in Patong based on the number of properties managed and estimated total revenue over the past year. Analyze their scale and performance metrics.
| Host Name | Properties | Grossing Revenue | Stay Reviews | Avg Rating |
|---|---|---|---|---|
| Three Monkeys Villas Patong | 14 | $1,624,804 | 672 | 4.93/5.0 |
| Gilles | 31 | $1,146,140 | 572 | 3.42/5.0 |
| Lofty | 63 | $1,088,603 | 1626 | 3.94/5.0 |
| Prapa | 12 | $767,839 | 534 | 4.79/5.0 |
| Patong Signature Boutique Hote | 33 | $766,908 | 2296 | 4.32/5.0 |
| Cool Places | 49 | $630,763 | 199 | 1.89/5.0 |
| Ira | 26 | $541,874 | 1759 | 4.77/5.0 |
| Dr. Supot | 18 | $466,176 | 1781 | 4.51/5.0 |
| Adrian | 51 | $463,978 | 660 | 4.23/5.0 |
| Jon | 1 | $458,815 | 70 | 5.00/5.0 |
Analyzing the strategies of top hosts, such as their property selection, pricing, and guest communication, can offer valuable lessons for optimizing your own Airbnb operations in Patong.
Dive Deeper: Advanced Patong STR Market Data (2025)
Ready to unlock more insights? AirROI provides access to advanced metrics and comprehensive Airbnb data for Patong. Explore detailed analytics beyond this report to refine your investment strategy, optimize pricing, and maximize your vacation rental profits.
Explore Advanced MetricsPatong Short-Term Rental Market Composition (2025): Property & Room Types
Room Type Distribution
Property Type Distribution
Market Composition Insights for Patong
- The Patong Airbnb market composition is heavily skewed towards Entire Home/Apt listings, which make up 60.4% of the 1,708 active rentals. This indicates strong guest preference for privacy and space.
- However, a notable 34.7% share for Private Rooms suggests opportunities for budget-conscious travelers or hosts renting out spare rooms.
- Looking at the property type distribution in Patong, Apartment/Condo properties are the most common (54.7%), reflecting the local real estate landscape.
- Houses represent a significant 15.4% portion, catering likely to families or larger groups.
- The presence of 29.1% Hotel/Boutique listings indicates integration with traditional hospitality.
- Smaller segments like others, outdoor/unique, unique stays (combined 0.8%) offer potential for unique stay experiences.
Patong Airbnb Room Capacity Analysis (2025): Bedroom Distribution
Distribution of Listings by Number of Bedrooms
Room Capacity Insights for Patong
- The dominant room capacity in Patong is 1 bedroom listings, making up 59.2% of the market. This suggests a strong demand for properties suitable for couples or solo travelers.
- Together, 1 bedroom and 2 bedrooms properties represent 74.4% of the active Airbnb listings in Patong, indicating a high concentration in these sizes.
- With over half the market (59.2%) consisting of studios or 1-bedroom units, Patong is particularly well-suited for individuals or couples.
Patong Vacation Rental Guest Capacity Trends (2025)
Distribution of Listings by Guest Capacity
Guest Capacity Insights for Patong
- The most common guest capacity trend in Patong vacation rentals is listings accommodating 2 guests (47.7%). This suggests the primary traveler segment is likely couples or solo travelers.
- Properties designed for 2 guests and 3 guests dominate the Patong STR market, accounting for 63.6% of listings.
- A significant 48.2% of listings cater specifically to 1-2 guests, highlighting strong demand from couples and solo travelers in Patong.
- 16.3% of properties accommodate 6+ guests, serving the market segment for larger families or group travel in Patong.
- On average, properties in Patong are equipped to host 3.3 guests.
Patong Airbnb Booking Patterns (2025): Available vs. Booked Days
Available Days Distribution
Booked Days Distribution
Booking Pattern Insights for Patong
- The most common availability pattern in Patong falls within the 271-366 days range, representing 53.8% of listings. This suggests many properties have significant open periods on their calendars.
- Approximately 74.3% of listings show high availability (181+ days open annually), indicating potential for increased bookings or specific owner usage patterns.
- For booked days, the 1-30 days range is most frequent in Patong (28.4%), reflecting common guest stay durations or potential owner blocking patterns.
- A notable 26.4% of properties secure long booking periods (181+ days booked per year), highlighting successful long-term rental strategies or significant owner usage.
Patong Airbnb Minimum Stay Requirements Analysis
Distribution of Listings by Minimum Night Requirement
1 Night
774 listings
49.1% of total
2 Nights
165 listings
10.5% of total
3 Nights
164 listings
10.4% of total
4-6 Nights
103 listings
6.5% of total
7-29 Nights
100 listings
6.3% of total
30+ Nights
270 listings
17.1% of total
Key Insights
- The most prevalent minimum stay requirement in Patong is 1 Night, adopted by 49.1% of listings. This highlights the market's preference for shorter, flexible bookings.
- A significant segment (17.1%) caters to monthly stays (30+ nights) in Patong, pointing to opportunities in the extended-stay market.
Recommendations
- Align with the market by considering a 1 Night minimum stay, as 49.1% of Patong hosts use this setting.
- Explore offering discounts for stays of 30+ nights to attract the 17.1% of the market seeking extended stays.
- Adjust minimum nights based on seasonality – potentially shorter during low season and longer during peak demand periods in Patong.
Patong Airbnb Cancellation Policy Trends Analysis (2025)
Super Strict 30 Days
3 listings
0.2% of total
Refundable
2 listings
0.2% of total
Super Strict 60 Days
5 listings
0.4% of total
Flexible
284 listings
22.8% of total
Moderate
192 listings
15.4% of total
Firm
190 listings
15.3% of total
Strict
569 listings
45.7% of total
Cancellation Policy Insights for Patong
- The prevailing Airbnb cancellation policy trend in Patong is Strict, used by 45.7% of listings.
- A majority (61.0%) of hosts in Patong utilize Firm or Strict policies, indicating a market where hosts prioritize booking security.
Recommendations for Hosts
- Consider adopting a Strict policy to align with the 45.7% market standard in Patong.
- With 45.7% using Strict terms, this is a viable option in Patong, particularly for high-value properties or during peak demand periods.
- Regularly review your cancellation policy against competitors and market demand shifts in Patong.
Patong STR Booking Lead Time Analysis (2025)
Average Booking Lead Time by Month
Booking Lead Time Insights for Patong
- The overall average booking lead time for vacation rentals in Patong is 41 days.
- Guests book furthest in advance for stays during January (average 60 days), likely coinciding with peak travel demand or local events.
- The shortest booking windows occur for stays in September (average 30 days), indicating more last-minute travel plans during this time.
- Seasonally, Winter (56 days avg.) sees the longest lead times, while Summer (35 days avg.) has the shortest, reflecting typical travel planning cycles.
Recommendations for Hosts
- Use the overall average lead time (41 days) as a baseline for your pricing and availability strategy in Patong.
- For January stays, consider implementing length-of-stay discounts or slightly higher rates for bookings made less than 60 days out to capitalize on advance planning.
- Target marketing efforts for the Winter season well in advance (at least 56 days) to capture early planners.
- Monitor your own booking lead times against these Patong averages to identify opportunities for dynamic pricing adjustments.
Popular & Essential Airbnb Amenities in Patong (2025)
Amenity Prevalence
Amenity Insights for Patong
- Essential amenities in Patong that guests expect include: Air conditioning, Wifi, TV. Lacking these (any) could significantly impact bookings.
- Popular amenities like Essentials, Hot water, Smoke alarm are common but not universal. Offering these can provide a competitive edge.
Recommendations for Hosts
- Ensure your listing includes all essential amenities for Patong: Air conditioning, Wifi, TV.
- Prioritize adding missing essentials: Air conditioning, Wifi, TV.
- Consider adding popular differentiators like Essentials or Hot water to increase appeal.
- Highlight unique or less common amenities you offer (e.g., hot tub, dedicated workspace, EV charger) in your listing description and photos.
- Regularly check competitor amenities in Patong to stay competitive.
Patong Airbnb Guest Demographics & Profile Analysis (2025)
Guest Profile Summary for Patong
- The typical guest profile for Airbnb in Patong consists of predominantly international visitors (99%), with top international origins including Australia, typically belonging to the Post-2000s (Gen Z/Alpha) group (50%), primarily speaking English or Arabic.
- Domestic travelers account for 1.4% of guests.
- Key international markets include United States (17.2%) and Australia (8.4%).
- Top languages spoken are English (47.8%) followed by Arabic (6.4%).
- A significant demographic segment is the Post-2000s (Gen Z/Alpha) group, representing 50% of guests.
Recommendations for Hosts
- Focus marketing internationally, particularly towards travelers from Australia.
- Tailor amenities and listing descriptions to appeal to the dominant Post-2000s (Gen Z/Alpha) demographic (e.g., highlight fast WiFi, smart home features, local guides).
- Highlight unique local experiences or amenities relevant to the primary guest profile.
- Consider seasonal promotions aligned with peak travel times for key origin markets.
Nearby Short-Term Rental Market Comparison
How does the Patong Airbnb market stack up against its neighbors? Compare key performance metrics like average monthly revenue, ADR, and occupancy rates in surrounding areas to understand the broader regional STR landscape.
| Market | Active Properties | Monthly Revenue | Daily Rate | Avg. Occupancy |
|---|---|---|---|---|
| Ban Khao Pi Lai | 17 | $8,369 | $2002.90 | 25% |
| Pa Khlok | 62 | $5,400 | $753.98 | 34% |
| Haad Klong Jaak | 35 | $2,685 | $263.02 | 45% |
| Kuala Teriang | 13 | $2,554 | $193.86 | 32% |
| Kamala | 869 | $2,499 | $267.11 | 49% |
| Ban Khlong Son | 31 | $2,193 | $230.37 | 38% |
| Krabi Noi | 54 | $2,045 | $185.87 | 39% |
| Tambon Ao Nang | 64 | $1,918 | $171.73 | 43% |
| Choeng Thale | 1,381 | $1,890 | $257.88 | 41% |
| Chong Pli | 50 | $1,843 | $171.71 | 44% |