Ko Kaeo Airbnb Market Analysis 2025: Short Term Rental Data & Vacation Rental Statistics in Phuket Province, Thailand
Is Airbnb profitable in Ko Kaeo in 2025? Explore comprehensive Airbnb analytics for Ko Kaeo, Phuket Province, Thailand to uncover income potential. This 2025 STR market report for Ko Kaeo, based on AirROI data from April 2024 to March 2025, reveals key trends in the niche market of 46 active listings.
Whether you're considering an Airbnb investment in Ko Kaeo, optimizing your existing vacation rental, or exploring rental arbitrage opportunities, understanding the Ko Kaeo Airbnb data is crucial. Leveraging the low regulation environment is key to maximizing your short term rental income potential. Let's dive into the specifics.
Key Ko Kaeo Airbnb Performance Metrics Overview
Monthly Airbnb Revenue Variations & Income Potential in Ko Kaeo (2025)
Understanding the monthly revenue variations for Airbnb listings in Ko Kaeo is key to maximizing your short term rental income potential. Seasonality significantly impacts earnings. Our analysis, based on data from the past 12 months, shows that the peak revenue month for STRs in Ko Kaeo is typically December, while September often presents the lowest earnings, highlighting opportunities for strategic pricing adjustments during shoulder and low seasons. Explore the typical Airbnb income in Ko Kaeo across different performance tiers:
- Best-in-class properties (Top 10%) achieve $6,138+ monthly, often utilizing dynamic pricing and superior guest experiences.
- Strong performing properties (Top 25%) earn $2,597 or more, indicating effective management and desirable locations/amenities.
- Typical properties (Median) generate around $840 per month, representing the average market performance.
- Entry-level properties (Bottom 25%) see earnings around $237, often with potential for optimization.
Average Monthly Airbnb Earnings Trend in Ko Kaeo
Ko Kaeo Airbnb Occupancy Rate Trends (2025)
Maximize your bookings by understanding the Ko Kaeo STR occupancy trends. Seasonal demand shifts significantly influence how often properties are booked. Typically, Februarysees the highest demand (peak season occupancy), while September experiences the lowest (low season). Effective strategies, like adjusting minimum stays or offering promotions, can boost occupancy during slower periods. Here's how different property tiers perform in Ko Kaeo:
- Best-in-class properties (Top 10%) achieve 60%+ occupancy, indicating high desirability and potentially optimized availability.
- Strong performing properties (Top 25%) maintain 41% or higher occupancy, suggesting good market fit and guest satisfaction.
- Typical properties (Median) have an occupancy rate around 17%.
- Entry-level properties (Bottom 25%) average 9% occupancy, potentially facing higher vacancy.
Average Monthly Occupancy Rate Trend in Ko Kaeo
Average Daily Rate (ADR) Airbnb Trends in Ko Kaeo (2025)
Effective short term rental pricing strategy in Ko Kaeo involves understanding monthly ADR fluctuations. The Average Daily Rate (ADR) for Airbnb in Ko Kaeo typically peaks in January and dips lowest during November. Leveraging Airbnb dynamic pricing tools or strategies based on this seasonality can significantly boost revenue. Here's a look at the typical nightly rates achieved:
- Best-in-class properties (Top 10%) command rates of $654+ per night, often due to premium features or locations.
- Strong performing properties (Top 25%) achieve nightly rates of $250 or more.
- Typical properties (Median) charge around $127 per night.
- Entry-level properties (Bottom 25%) earn around $57 per night.
Average Daily Rate (ADR) Trend by Month in Ko Kaeo
Get Live Ko Kaeo Market Intelligence 👇

Explore Real-time Analytics
Airbnb Seasonality Analysis & Trends in Ko Kaeo (2025)
Peak Season (December, July, January)
- Revenue averages $2,873 per month
- Occupancy rates average 34.2%
- Daily rates average $267
Shoulder Season
- Revenue averages $2,201 per month
- Occupancy maintains around 26.9%
- Daily rates hold near $243
Low Season (March, September, October)
- Revenue drops to average $1,096 per month
- Occupancy decreases to average 15.6%
- Daily rates adjust to average $242
Seasonality Insights for Ko Kaeo
- The Airbnb seasonality in Ko Kaeo shows highly seasonal trends requiring careful strategy. While the sections above show seasonal averages, it's also insightful to look at the extremes:
- During the high season, the absolute peak month showcases Ko Kaeo's highest earning potential, with monthly revenues capable of climbing to $3,102, occupancy reaching a high of 39.1%, and ADRs peaking at $289.
- Conversely, the slowest single month of the year, typically falling within the low season, marks the market's lowest point. In this month, revenue might dip to $553, occupancy could drop to 10.0%, and ADRs may adjust down to $234.
- Understanding both the seasonal averages and these monthly peaks and troughs in revenue, occupancy, and ADR is crucial for maximizing your Airbnb profit potential in Ko Kaeo.
Seasonal Strategies for Maximizing Profit
- Peak Season: Maximize revenue through premium pricing and potentially longer minimum stays. Ensure high availability.
- Low Season: Offer competitive pricing, special promotions (e.g., extended stay discounts), and flexible cancellation policies. Target off-season travelers like remote workers or budget-conscious guests.
- Shoulder Seasons: Implement dynamic pricing that balances peak and low rates. Target weekend travelers or specific events. Offer slightly more flexible terms than peak season.
- Regularly analyze your own performance against these Ko Kaeo seasonality benchmarks and adjust your pricing and availability strategy accordingly.
Best Areas for Airbnb Investment in Ko Kaeo (2025)
Exploring the top neighborhoods for short-term rentals in Ko Kaeo? This section highlights key areas, outlining why they are attractive for hosts and guests, along with notable local attractions. Consider these locations based on your target guest profile and investment strategy.
| Neighborhood / Area | Why Host Here? (Target Guests & Appeal) | Key Attractions & Landmarks |
|---|---|---|
| Bang Tao Beach | A stunning beach with a lively atmosphere, Bang Tao is popular among tourists for its water activities and beach clubs. It attracts both families and partygoers looking for relaxation and fun. | Bang Tao Beach, Baba Beach Club, Catch Beach Club, Laguna Phuket Golf Club, Island Safari Tours |
| Surin Beach | Known as 'Millionaire's Row', Surin Beach is famous for its upscale resorts and stunning sunsets, making it a great choice for guests seeking luxury and tranquility. | Surin Beach, The Splash Jungle Water Park, Phuket FantaSea, Laem Singh Viewpoint, Tain Ping Pong |
| Kamala Beach | A peaceful beach atmosphere away from the hustle and bustle, Kamala is excellent for families and those seeking a quieter beach experience. It also has a growing wellness community. | Kamala Beach, Phuket FantaSea, Tsunami Memorial Park, Kamala Village, Laem Singh Viewpoint |
| Old Phuket Town | Rich in history and culture, Old Phuket Town features Sino-Portuguese architecture and a vibrant street art scene, appealing to tourists interested in local culture and history. | Thalang Road, Sino-Portuguese Houses, Buddhist Temples, Phuket Trickeye Museum, Chinatown |
| Kata Beach | Kata Beach is renowned for its beautiful sandy shores and family-friendly vibe, making it a popular location for tourists, especially families with children. | Kata Beach, Kata Noi Beach, Koh Pu Island, Surf House Phuket, Elephant Jungle Sanctuary |
| Patong Beach | The most famous beach in Phuket, Patong is known for its nightlife, shopping, and entertainment, making it a hotspot for younger travelers looking for an exciting vacation. | Patong Beach, Bangla Road, Jungceylon Shopping Mall, Freedom Beach, Simon Cabaret |
| Chalong Bay | Home to the famous Chalong Pier and a variety of water sports, Chalong Bay is ideal for adventure seekers and those looking to explore the surrounding islands. | Chalong Pier, Big Buddha, Wat Chalong, Coral Island, Scuba Diving Adventures |
| Mai Khao Beach | A serene and less crowded beach located in the north of Phuket, Mai Khao is ideal for those seeking peace and natural beauty, making it suitable for relaxation and eco-tourism. | Mai Khao Beach, Sirinat National Park, Splash Jungle Water Park, Blue Canyon Country Club, Phuket Dolphin Show |
Understanding Airbnb License Requirements & STR Laws in Ko Kaeo (2025)
While Ko Kaeo, Phuket Province, Thailand currently shows low STR regulations, specific Airbnb license requirements might still exist or change. Always verify the latest short term rental regulations and Airbnb license requirements directly with local government authorities for Ko Kaeo to ensure full compliance before hosting.
(Source: AirROI data, 2025, finding no licensed listings among those analyzed)
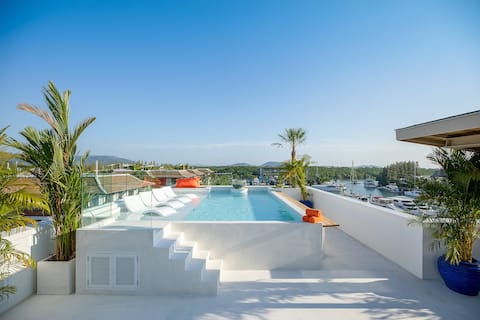
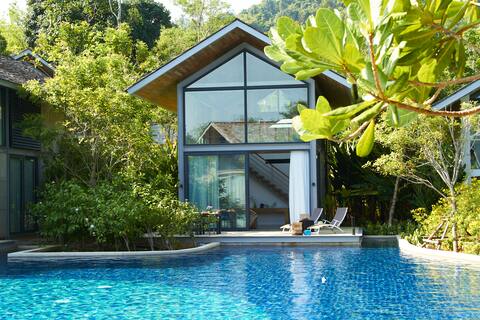
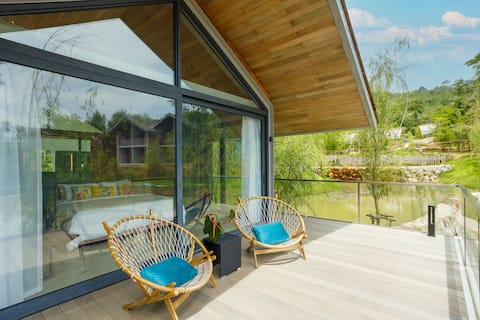
Top Performing Airbnb Properties in Ko Kaeo (2025)
Benchmark your potential! Explore examples of top-performing Airbnb properties in Ko Kaeobased on Trailing Twelve Month (TTM) revenue. Analyze their characteristics, revenue, occupancy rate, and ADR to understand what drives success in this market.
Modern style pier sea view with private pool
Entire Place • 4 bedrooms

Spacious 4 Bedroom Pool Villa with full-time Staff
Entire Place • 4 bedrooms
Island Escape Two-Bedroom Villa Pool Access
Private Room • 2 bedrooms

Royal Marina Penthouse 360° View
Entire Place • 4 bedrooms
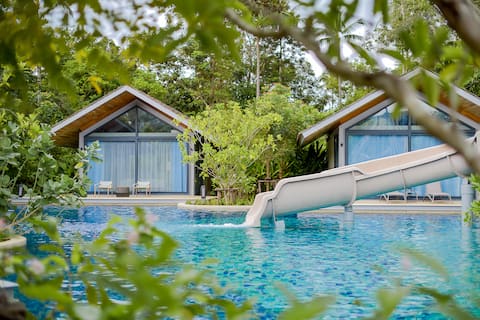
Island Escape One-Bedroom Pool Access
Private Room • 1 bedroom
Island Escape One-Bedroom Lagoon Villa
Private Room • 1 bedroom
Note: Performance varies based on location, size, amenities, seasonality, and management quality. Data reflects the past 12 months.
Top Performing Airbnb Hosts in Ko Kaeo (2025)
Learn from the best! This table showcases top-performing Airbnb hosts in Ko Kaeo based on the number of properties managed and estimated total revenue over the past year. Analyze their scale and performance metrics.
| Host Name | Properties | Grossing Revenue | Stay Reviews | Avg Rating |
|---|---|---|---|---|
| Lingru | 1 | $112,990 | 22 | 4.82/5.0 |
| Host #342305771 | 4 | $97,317 | 0 | 0.00/5.0 |
| Host #96377540 | 1 | $40,248 | 0 | 0.00/5.0 |
| Gilles | 1 | $27,040 | 6 | 5.00/5.0 |
| Natapat | 1 | $23,543 | 42 | 4.95/5.0 |
| Nawa | 11 | $19,147 | 6 | 0.42/5.0 |
| Youssef | 1 | $17,956 | 13 | 4.92/5.0 |
| Noi And JC | 1 | $17,278 | 78 | 4.85/5.0 |
| Host #74568802 | 1 | $13,415 | 1 | 0.00/5.0 |
| Thanaset | 1 | $10,700 | 7 | 5.00/5.0 |
Analyzing the strategies of top hosts, such as their property selection, pricing, and guest communication, can offer valuable lessons for optimizing your own Airbnb operations in Ko Kaeo.
Dive Deeper: Advanced Ko Kaeo STR Market Data (2025)
Ready to unlock more insights? AirROI provides access to advanced metrics and comprehensive Airbnb data for Ko Kaeo. Explore detailed analytics beyond this report to refine your investment strategy, optimize pricing, and maximize your vacation rental profits.
Explore Advanced MetricsKo Kaeo Short-Term Rental Market Composition (2025): Property & Room Types
Room Type Distribution
Property Type Distribution
Market Composition Insights for Ko Kaeo
- The Ko Kaeo Airbnb market composition is heavily skewed towards Private Room listings, which make up 63% of the 46 active rentals. This indicates strong guest preference for privacy and space.
- Looking at the property type distribution in Ko Kaeo, Hotel/Boutique properties are the most common (50%), reflecting the local real estate landscape.
- Houses represent a significant 23.9% portion, catering likely to families or larger groups.
- The presence of 50% Hotel/Boutique listings indicates integration with traditional hospitality.
- Smaller segments like others, outdoor/unique (combined 4.4%) offer potential for unique stay experiences.
Ko Kaeo Airbnb Room Capacity Analysis (2025): Bedroom Distribution
Distribution of Listings by Number of Bedrooms
Room Capacity Insights for Ko Kaeo
- The dominant room capacity in Ko Kaeo is 1 bedroom listings, making up 60.9% of the market. This suggests a strong demand for properties suitable for couples or solo travelers.
- Together, 1 bedroom and 3 bedrooms properties represent 73.9% of the active Airbnb listings in Ko Kaeo, indicating a high concentration in these sizes.
- With over half the market (60.9%) consisting of studios or 1-bedroom units, Ko Kaeo is particularly well-suited for individuals or couples.
- A significant 23.9% of listings offer 3+ bedrooms, catering to larger groups and families seeking more space in Ko Kaeo.
Ko Kaeo Vacation Rental Guest Capacity Trends (2025)
Distribution of Listings by Guest Capacity
Guest Capacity Insights for Ko Kaeo
- The most common guest capacity trend in Ko Kaeo vacation rentals is listings accommodating 2 guests (54.3%). This suggests the primary traveler segment is likely couples or solo travelers.
- Properties designed for 2 guests and 6 guests dominate the Ko Kaeo STR market, accounting for 69.5% of listings.
- A significant 54.3% of listings cater specifically to 1-2 guests, highlighting strong demand from couples and solo travelers in Ko Kaeo.
- 26.1% of properties accommodate 6+ guests, serving the market segment for larger families or group travel in Ko Kaeo.
- On average, properties in Ko Kaeo are equipped to host 3.5 guests.
Ko Kaeo Airbnb Booking Patterns (2025): Available vs. Booked Days
Available Days Distribution
Booked Days Distribution
Booking Pattern Insights for Ko Kaeo
- The most common availability pattern in Ko Kaeo falls within the 271-366 days range, representing 84.8% of listings. This suggests many properties have significant open periods on their calendars.
- Approximately 97.8% of listings show high availability (181+ days open annually), indicating potential for increased bookings or specific owner usage patterns.
- For booked days, the 1-30 days range is most frequent in Ko Kaeo (58.7%), reflecting common guest stay durations or potential owner blocking patterns.
- A notable 2.2% of properties secure long booking periods (181+ days booked per year), highlighting successful long-term rental strategies or significant owner usage.
Ko Kaeo Airbnb Minimum Stay Requirements Analysis
Distribution of Listings by Minimum Night Requirement
1 Night
26 listings
63.4% of total
2 Nights
2 listings
4.9% of total
3 Nights
1 listings
2.4% of total
4-6 Nights
2 listings
4.9% of total
7-29 Nights
2 listings
4.9% of total
30+ Nights
8 listings
19.5% of total
Key Insights
- The most prevalent minimum stay requirement in Ko Kaeo is 1 Night, adopted by 63.4% of listings. This highlights the market's preference for shorter, flexible bookings.
- A strong majority (68.3%) of the Ko Kaeo Airbnb data shows acceptance of very short stays (1-2 nights), indicating a dynamic, high-turnover market.
- A significant segment (19.5%) caters to monthly stays (30+ nights) in Ko Kaeo, pointing to opportunities in the extended-stay market.
Recommendations
- Align with the market by considering a 1 Night minimum stay, as 63.4% of Ko Kaeo hosts use this setting.
- Explore offering discounts for stays of 30+ nights to attract the 19.5% of the market seeking extended stays.
- Adjust minimum nights based on seasonality – potentially shorter during low season and longer during peak demand periods in Ko Kaeo.
Ko Kaeo Airbnb Cancellation Policy Trends Analysis (2025)
Flexible
4 listings
23.5% of total
Moderate
2 listings
11.8% of total
Firm
3 listings
17.6% of total
Strict
8 listings
47.1% of total
Cancellation Policy Insights for Ko Kaeo
- The prevailing Airbnb cancellation policy trend in Ko Kaeo is Strict, used by 47.1% of listings.
- A majority (64.7%) of hosts in Ko Kaeo utilize Firm or Strict policies, indicating a market where hosts prioritize booking security.
Recommendations for Hosts
- Consider adopting a Strict policy to align with the 47.1% market standard in Ko Kaeo.
- With 47.1% using Strict terms, this is a viable option in Ko Kaeo, particularly for high-value properties or during peak demand periods.
- Regularly review your cancellation policy against competitors and market demand shifts in Ko Kaeo.
Ko Kaeo STR Booking Lead Time Analysis (2025)
Average Booking Lead Time by Month
Booking Lead Time Insights for Ko Kaeo
- The overall average booking lead time for vacation rentals in Ko Kaeo is 42 days.
- Guests book furthest in advance for stays during May (average 85 days), likely coinciding with peak travel demand or local events.
- The shortest booking windows occur for stays in September (average 28 days), indicating more last-minute travel plans during this time.
- Seasonally, Spring (72 days avg.) sees the longest lead times, while Winter (37 days avg.) has the shortest, reflecting typical travel planning cycles.
Recommendations for Hosts
- Use the overall average lead time (42 days) as a baseline for your pricing and availability strategy in Ko Kaeo.
- For May stays, consider implementing length-of-stay discounts or slightly higher rates for bookings made less than 85 days out to capitalize on advance planning.
- Target marketing efforts for the Spring season well in advance (at least 72 days) to capture early planners.
- Monitor your own booking lead times against these Ko Kaeo averages to identify opportunities for dynamic pricing adjustments.
Popular & Essential Airbnb Amenities in Ko Kaeo (2025)
Amenity Prevalence
Amenity Insights for Ko Kaeo
- Essential amenities in Ko Kaeo that guests expect include: Air conditioning, Wifi, TV. Lacking these (any) could significantly impact bookings.
- Popular amenities like Essentials, Hot water, Washer are common but not universal. Offering these can provide a competitive edge.
Recommendations for Hosts
- Ensure your listing includes all essential amenities for Ko Kaeo: Air conditioning, Wifi, TV.
- Prioritize adding missing essentials: TV.
- Consider adding popular differentiators like Essentials or Hot water to increase appeal.
- Highlight unique or less common amenities you offer (e.g., hot tub, dedicated workspace, EV charger) in your listing description and photos.
- Regularly check competitor amenities in Ko Kaeo to stay competitive.
Ko Kaeo Airbnb Guest Demographics & Profile Analysis (2025)
Guest Profile Summary for Ko Kaeo
- The typical guest profile for Airbnb in Ko Kaeo consists of predominantly international visitors (82%), with top international origins including United States, typically belonging to the Post-2000s (Gen Z/Alpha) group (50%), primarily speaking English or French.
- Domestic travelers account for 18.2% of guests.
- Key international markets include Thailand (18.2%) and United States (15.9%).
- Top languages spoken are English (49.2%) followed by French (9.8%).
- A significant demographic segment is the Post-2000s (Gen Z/Alpha) group, representing 50% of guests.
Recommendations for Hosts
- Focus marketing internationally, particularly towards travelers from United States.
- Tailor amenities and listing descriptions to appeal to the dominant Post-2000s (Gen Z/Alpha) demographic (e.g., highlight fast WiFi, smart home features, local guides).
- Highlight unique local experiences or amenities relevant to the primary guest profile.
- Consider seasonal promotions aligned with peak travel times for key origin markets.
Nearby Short-Term Rental Market Comparison
How does the Ko Kaeo Airbnb market stack up against its neighbors? Compare key performance metrics like average monthly revenue, ADR, and occupancy rates in surrounding areas to understand the broader regional STR landscape.
| Market | Active Properties | Monthly Revenue | Daily Rate | Avg. Occupancy |
|---|---|---|---|---|
| Ban Khao Pi Lai | 17 | $8,369 | $2002.90 | 25% |
| Pa Khlok | 62 | $5,400 | $753.98 | 34% |
| Haad Klong Jaak | 35 | $2,685 | $263.02 | 45% |
| Kuala Teriang | 13 | $2,554 | $193.86 | 32% |
| Kamala | 869 | $2,499 | $267.11 | 49% |
| Ban Khlong Son | 31 | $2,193 | $230.37 | 38% |
| Krabi Noi | 54 | $2,045 | $185.87 | 39% |
| Tambon Ao Nang | 64 | $1,918 | $171.73 | 43% |
| Choeng Thale | 1,381 | $1,890 | $257.88 | 41% |
| Chong Pli | 50 | $1,843 | $171.71 | 44% |