Sima Mongkhon Airbnb Market Analysis 2025: Short Term Rental Data & Vacation Rental Statistics in Nakhon Ratchasima Province, Thailand
Is Airbnb profitable in Sima Mongkhon in 2025? Explore comprehensive Airbnb analytics for Sima Mongkhon, Nakhon Ratchasima Province, Thailand to uncover income potential. This 2025 STR market report for Sima Mongkhon, based on AirROI data from April 2024 to March 2025, reveals key trends in the niche market of 58 active listings.
Whether you're considering an Airbnb investment in Sima Mongkhon, optimizing your existing vacation rental, or exploring rental arbitrage opportunities, understanding the Sima Mongkhon Airbnb data is crucial. Leveraging the low regulation environment is key to maximizing your short term rental income potential. Let's dive into the specifics.
Key Sima Mongkhon Airbnb Performance Metrics Overview
Monthly Airbnb Revenue Variations & Income Potential in Sima Mongkhon (2025)
Understanding the monthly revenue variations for Airbnb listings in Sima Mongkhon is key to maximizing your short term rental income potential. Seasonality significantly impacts earnings. Our analysis, based on data from the past 12 months, shows that the peak revenue month for STRs in Sima Mongkhon is typically December, while April often presents the lowest earnings, highlighting opportunities for strategic pricing adjustments during shoulder and low seasons. Explore the typical Airbnb income in Sima Mongkhon across different performance tiers:
- Best-in-class properties (Top 10%) achieve $5,066+ monthly, often utilizing dynamic pricing and superior guest experiences.
- Strong performing properties (Top 25%) earn $2,244 or more, indicating effective management and desirable locations/amenities.
- Typical properties (Median) generate around $823 per month, representing the average market performance.
- Entry-level properties (Bottom 25%) see earnings around $380, often with potential for optimization.
Average Monthly Airbnb Earnings Trend in Sima Mongkhon
Sima Mongkhon Airbnb Occupancy Rate Trends (2025)
Maximize your bookings by understanding the Sima Mongkhon STR occupancy trends. Seasonal demand shifts significantly influence how often properties are booked. Typically, Decembersees the highest demand (peak season occupancy), while June experiences the lowest (low season). Effective strategies, like adjusting minimum stays or offering promotions, can boost occupancy during slower periods. Here's how different property tiers perform in Sima Mongkhon:
- Best-in-class properties (Top 10%) achieve 47%+ occupancy, indicating high desirability and potentially optimized availability.
- Strong performing properties (Top 25%) maintain 32% or higher occupancy, suggesting good market fit and guest satisfaction.
- Typical properties (Median) have an occupancy rate around 21%.
- Entry-level properties (Bottom 25%) average 10% occupancy, potentially facing higher vacancy.
Average Monthly Occupancy Rate Trend in Sima Mongkhon
Average Daily Rate (ADR) Airbnb Trends in Sima Mongkhon (2025)
Effective short term rental pricing strategy in Sima Mongkhon involves understanding monthly ADR fluctuations. The Average Daily Rate (ADR) for Airbnb in Sima Mongkhon typically peaks in December and dips lowest during August. Leveraging Airbnb dynamic pricing tools or strategies based on this seasonality can significantly boost revenue. Here's a look at the typical nightly rates achieved:
- Best-in-class properties (Top 10%) command rates of $503+ per night, often due to premium features or locations.
- Strong performing properties (Top 25%) achieve nightly rates of $203 or more.
- Typical properties (Median) charge around $124 per night.
- Entry-level properties (Bottom 25%) earn around $66 per night.
Average Daily Rate (ADR) Trend by Month in Sima Mongkhon
Get Live Sima Mongkhon Market Intelligence 👇

Explore Real-time Analytics
Airbnb Seasonality Analysis & Trends in Sima Mongkhon (2025)
Peak Season (December, June, November)
- Revenue averages $2,375 per month
- Occupancy rates average 26.7%
- Daily rates average $194
Shoulder Season
- Revenue averages $1,796 per month
- Occupancy maintains around 24.5%
- Daily rates hold near $187
Low Season (March, April, May)
- Revenue drops to average $1,266 per month
- Occupancy decreases to average 22.5%
- Daily rates adjust to average $185
Seasonality Insights for Sima Mongkhon
- The Airbnb seasonality in Sima Mongkhon shows highly seasonal trends requiring careful strategy. While the sections above show seasonal averages, it's also insightful to look at the extremes:
- During the high season, the absolute peak month showcases Sima Mongkhon's highest earning potential, with monthly revenues capable of climbing to $2,454, occupancy reaching a high of 36.4%, and ADRs peaking at $207.
- Conversely, the slowest single month of the year, typically falling within the low season, marks the market's lowest point. In this month, revenue might dip to $1,115, occupancy could drop to 15.8%, and ADRs may adjust down to $176.
- Understanding both the seasonal averages and these monthly peaks and troughs in revenue, occupancy, and ADR is crucial for maximizing your Airbnb profit potential in Sima Mongkhon.
Seasonal Strategies for Maximizing Profit
- Peak Season: Maximize revenue through premium pricing and potentially longer minimum stays. Ensure high availability.
- Low Season: Offer competitive pricing, special promotions (e.g., extended stay discounts), and flexible cancellation policies. Target off-season travelers like remote workers or budget-conscious guests.
- Shoulder Seasons: Implement dynamic pricing that balances peak and low rates. Target weekend travelers or specific events. Offer slightly more flexible terms than peak season.
- Regularly analyze your own performance against these Sima Mongkhon seasonality benchmarks and adjust your pricing and availability strategy accordingly.
Best Areas for Airbnb Investment in Sima Mongkhon (2025)
Exploring the top neighborhoods for short-term rentals in Sima Mongkhon? This section highlights key areas, outlining why they are attractive for hosts and guests, along with notable local attractions. Consider these locations based on your target guest profile and investment strategy.
| Neighborhood / Area | Why Host Here? (Target Guests & Appeal) | Key Attractions & Landmarks |
|---|---|---|
| Khao Yai National Park | A UNESCO World Heritage Site known for its stunning landscapes, wildlife, and outdoor activities. A prime location for nature lovers and adventure seekers. | Khao Yai National Park, Haew Narok Waterfall, Khao Yai Wine Region, Pak Chong Night Market, Palio Khao Yai |
| Nakhon Ratchasima City Center | The vibrant heart of the province with shopping, restaurants, and cultural attractions. Ideal for those wanting urban conveniences and local experiences. | Terminal 21 Korat, Phra Narai Maharat Shrine, Korachai Market, Thao Suranaree Monument, Nakhon Ratchasima Zoo |
| Pak Chong | A gateway to Khao Yai National Park with a growing tourism industry. Attracts visitors looking for easy access to nature and local attractions. | Khao Yai Art Museum, Farm Chokchai, PB Valley Khao Yai Winery, Bonanza Khao Yai, Outlet Village Khao Yai |
| Chok Chai | Known for its agricultural products and dairy farms. A unique experience for guests interested in rural tourism and farm stays. | Chok Chai Farm, Chok Chai Water Park, Country Market Chok Chai, Local dairy products tasting, Agricultural Museum |
| Nang Rong | A small town with access to cultural and historical sites, ideal for those interested in the local history of the region. | Prasat Nang Rong, Nong Ki Waterfall, Local temples, Nang Rong Market, Cultural festivals |
| Korat Night Bazaar | A popular shopping and dining destination for both tourists and locals. Offers a unique local experience and vibrant night life. | Nakhon Ratchasima Night Bazaar, Street food stalls, Local artisans, Evening entertainment, Cultural performances |
| Sung Noen | A peaceful district that offers tranquility and rural charm, perfect for travelers seeking a break from the city life. | Sung Noen Market, Local temples and shrines, Rice paddies, Community festivals, Traditional Thai culture |
| Pak Thong Chai | A charming district known for its traditional crafts and local culture. A perfect destination for those interested in authentic Thai experiences. | Pak Thong Chai Cultural Center, Local handicrafts, Community art projects, Parks and recreational areas, Cultural festivals |
Understanding Airbnb License Requirements & STR Laws in Sima Mongkhon (2025)
While Sima Mongkhon, Nakhon Ratchasima Province, Thailand currently shows low STR regulations, specific Airbnb license requirements might still exist or change. Always verify the latest short term rental regulations and Airbnb license requirements directly with local government authorities for Sima Mongkhon to ensure full compliance before hosting.
(Source: AirROI data, 2025, finding no licensed listings among those analyzed)
Top Performing Airbnb Properties in Sima Mongkhon (2025)
Benchmark your potential! Explore examples of top-performing Airbnb properties in Sima Mongkhonbased on Trailing Twelve Month (TTM) revenue. Analyze their characteristics, revenue, occupancy rate, and ADR to understand what drives success in this market.
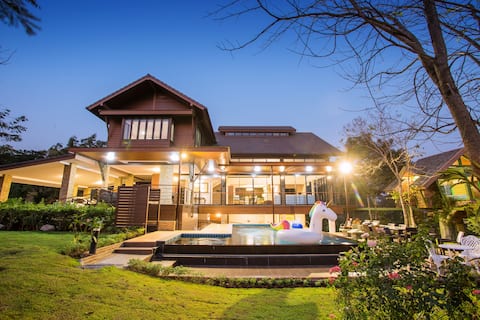
Khaoyai Mountain View Pool Villa เขาใหญ่ พูลวิลล่า
Entire Place • 8 bedrooms

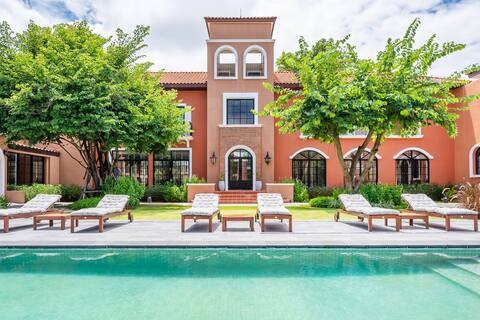
Villa Bianca
Private Room • 4 bedrooms

Floating Mountain Villa
Entire Place • 3 bedrooms
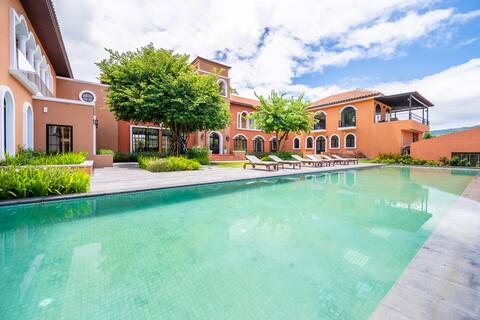
Villa Arancione
Private Room • 3 bedrooms
Villa Verde
Private Room • 3 bedrooms
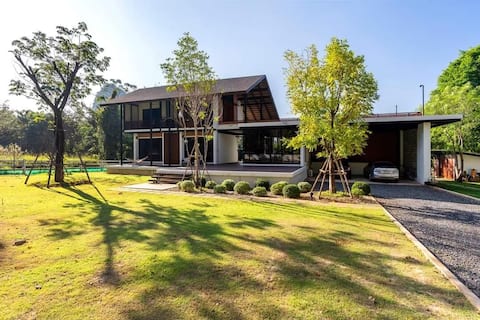
Thai modern House near national park
Entire Place • 3 bedrooms
Note: Performance varies based on location, size, amenities, seasonality, and management quality. Data reflects the past 12 months.
Top Performing Airbnb Hosts in Sima Mongkhon (2025)
Learn from the best! This table showcases top-performing Airbnb hosts in Sima Mongkhon based on the number of properties managed and estimated total revenue over the past year. Analyze their scale and performance metrics.
| Host Name | Properties | Grossing Revenue | Stay Reviews | Avg Rating |
|---|---|---|---|---|
| Host #492084953 | 3 | $159,959 | 2 | 0.00/5.0 |
| Jirat | 1 | $82,511 | 9 | 4.78/5.0 |
| Pongkuna (Praow) | 1 | $61,683 | 78 | 4.94/5.0 |
| Micky | 1 | $37,052 | 22 | 4.95/5.0 |
| Host #225035788 | 1 | $36,943 | 0 | 0.00/5.0 |
| Ataphon | 2 | $28,022 | 69 | 4.98/5.0 |
| Host #498646217 | 1 | $20,719 | 0 | 0.00/5.0 |
| Host #46545053 | 1 | $14,915 | 0 | 0.00/5.0 |
| Narumon | 2 | $12,815 | 41 | 5.00/5.0 |
| Maya | 1 | $12,227 | 16 | 5.00/5.0 |
Analyzing the strategies of top hosts, such as their property selection, pricing, and guest communication, can offer valuable lessons for optimizing your own Airbnb operations in Sima Mongkhon.
Dive Deeper: Advanced Sima Mongkhon STR Market Data (2025)
Ready to unlock more insights? AirROI provides access to advanced metrics and comprehensive Airbnb data for Sima Mongkhon. Explore detailed analytics beyond this report to refine your investment strategy, optimize pricing, and maximize your vacation rental profits.
Explore Advanced MetricsSima Mongkhon Short-Term Rental Market Composition (2025): Property & Room Types
Room Type Distribution
Property Type Distribution
Market Composition Insights for Sima Mongkhon
- The Sima Mongkhon Airbnb market composition is heavily skewed towards Entire Home/Apt listings, which make up 56.9% of the 58 active rentals. This indicates strong guest preference for privacy and space.
- However, a notable 43.1% share for Private Rooms suggests opportunities for budget-conscious travelers or hosts renting out spare rooms.
- Looking at the property type distribution in Sima Mongkhon, House properties are the most common (34.5%), reflecting the local real estate landscape.
- Houses represent a significant 34.5% portion, catering likely to families or larger groups.
- The presence of 24.1% Hotel/Boutique listings indicates integration with traditional hospitality.
Sima Mongkhon Airbnb Room Capacity Analysis (2025): Bedroom Distribution
Distribution of Listings by Number of Bedrooms
Room Capacity Insights for Sima Mongkhon
- The dominant room capacity in Sima Mongkhon is 1 bedroom listings, making up 31% of the market. This suggests a strong demand for properties suitable for couples or solo travelers.
- Together, 1 bedroom and 2 bedrooms properties represent 56.9% of the active Airbnb listings in Sima Mongkhon, indicating a high concentration in these sizes.
- A significant 37.9% of listings offer 3+ bedrooms, catering to larger groups and families seeking more space in Sima Mongkhon.
Sima Mongkhon Vacation Rental Guest Capacity Trends (2025)
Distribution of Listings by Guest Capacity
Guest Capacity Insights for Sima Mongkhon
- The most common guest capacity trend in Sima Mongkhon vacation rentals is listings accommodating 8+ guests (25.9%). This suggests the primary traveler segment is likely larger groups.
- Properties designed for 8+ guests and 2 guests dominate the Sima Mongkhon STR market, accounting for 44.9% of listings.
- 43.1% of properties accommodate 6+ guests, serving the market segment for larger families or group travel in Sima Mongkhon.
- On average, properties in Sima Mongkhon are equipped to host 4.5 guests.
Sima Mongkhon Airbnb Booking Patterns (2025): Available vs. Booked Days
Available Days Distribution
Booked Days Distribution
Booking Pattern Insights for Sima Mongkhon
- The most common availability pattern in Sima Mongkhon falls within the 271-366 days range, representing 84.5% of listings. This suggests many properties have significant open periods on their calendars.
- Approximately 96.6% of listings show high availability (181+ days open annually), indicating potential for increased bookings or specific owner usage patterns.
- For booked days, the 1-30 days range is most frequent in Sima Mongkhon (60.3%), reflecting common guest stay durations or potential owner blocking patterns.
- A notable 3.4% of properties secure long booking periods (181+ days booked per year), highlighting successful long-term rental strategies or significant owner usage.
Sima Mongkhon Airbnb Minimum Stay Requirements Analysis
Distribution of Listings by Minimum Night Requirement
1 Night
50 listings
87.7% of total
2 Nights
3 listings
5.3% of total
7-29 Nights
1 listings
1.8% of total
30+ Nights
3 listings
5.3% of total
Key Insights
- The most prevalent minimum stay requirement in Sima Mongkhon is 1 Night, adopted by 87.7% of listings. This highlights the market's preference for shorter, flexible bookings.
- A strong majority (93.0%) of the Sima Mongkhon Airbnb data shows acceptance of very short stays (1-2 nights), indicating a dynamic, high-turnover market.
Recommendations
- Align with the market by considering a 1 Night minimum stay, as 87.7% of Sima Mongkhon hosts use this setting.
- Explore offering discounts for stays of 30+ nights to attract the 5.3% of the market seeking extended stays.
- Adjust minimum nights based on seasonality – potentially shorter during low season and longer during peak demand periods in Sima Mongkhon.
Sima Mongkhon Airbnb Cancellation Policy Trends Analysis (2025)
Flexible
10 listings
26.3% of total
Moderate
13 listings
34.2% of total
Firm
4 listings
10.5% of total
Strict
11 listings
28.9% of total
Cancellation Policy Insights for Sima Mongkhon
- The prevailing Airbnb cancellation policy trend in Sima Mongkhon is Moderate, used by 34.2% of listings.
- There's a relatively balanced mix between guest-friendly (60.5%) and stricter (39.4%) policies, offering choices for different guest needs.
Recommendations for Hosts
- Consider adopting a Moderate policy to align with the 34.2% market standard in Sima Mongkhon.
- Regularly review your cancellation policy against competitors and market demand shifts in Sima Mongkhon.
Sima Mongkhon STR Booking Lead Time Analysis (2025)
Average Booking Lead Time by Month
Booking Lead Time Insights for Sima Mongkhon
- The overall average booking lead time for vacation rentals in Sima Mongkhon is 40 days.
- Guests book furthest in advance for stays during September (average 79 days), likely coinciding with peak travel demand or local events.
- The shortest booking windows occur for stays in April (average 25 days), indicating more last-minute travel plans during this time.
- Seasonally, Fall (68 days avg.) sees the longest lead times, while Spring (40 days avg.) has the shortest, reflecting typical travel planning cycles.
Recommendations for Hosts
- Use the overall average lead time (40 days) as a baseline for your pricing and availability strategy in Sima Mongkhon.
- For September stays, consider implementing length-of-stay discounts or slightly higher rates for bookings made less than 79 days out to capitalize on advance planning.
- Target marketing efforts for the Fall season well in advance (at least 68 days) to capture early planners.
- Monitor your own booking lead times against these Sima Mongkhon averages to identify opportunities for dynamic pricing adjustments.
Popular & Essential Airbnb Amenities in Sima Mongkhon (2025)
Amenity Prevalence
Amenity Insights for Sima Mongkhon
- Essential amenities in Sima Mongkhon that guests expect include: Free parking on premises. Lacking these (this) could significantly impact bookings.
- Popular amenities like Air conditioning, Essentials, TV are common but not universal. Offering these can provide a competitive edge.
- Warning: Wifi is not universally provided but is considered essential globally. Ensure reliable Wifi is offered.
Recommendations for Hosts
- Ensure your listing includes all essential amenities for Sima Mongkhon: Free parking on premises.
- Prioritize adding missing essentials: Free parking on premises.
- Consider adding popular differentiators like Air conditioning or Essentials to increase appeal.
- Highlight unique or less common amenities you offer (e.g., hot tub, dedicated workspace, EV charger) in your listing description and photos.
- Regularly check competitor amenities in Sima Mongkhon to stay competitive.
Sima Mongkhon Airbnb Guest Demographics & Profile Analysis (2025)
Guest Profile Summary for Sima Mongkhon
- The typical guest profile for Airbnb in Sima Mongkhon consists of a mix of domestic (45%) and international guests, with top international origins including United States, typically belonging to the Post-2000s (Gen Z/Alpha) group (50%), primarily speaking English or Thai.
- Domestic travelers account for 45.2% of guests.
- Key international markets include Thailand (45.2%) and United States (9.6%).
- Top languages spoken are English (39.6%) followed by Thai (22%).
- A significant demographic segment is the Post-2000s (Gen Z/Alpha) group, representing 50% of guests.
Recommendations for Hosts
- Balance marketing efforts between domestic and international channels based on the guest mix.
- Tailor amenities and listing descriptions to appeal to the dominant Post-2000s (Gen Z/Alpha) demographic (e.g., highlight fast WiFi, smart home features, local guides).
- Highlight unique local experiences or amenities relevant to the primary guest profile.
- Consider seasonal promotions aligned with peak travel times for key origin markets.
Nearby Short-Term Rental Market Comparison
How does the Sima Mongkhon Airbnb market stack up against its neighbors? Compare key performance metrics like average monthly revenue, ADR, and occupancy rates in surrounding areas to understand the broader regional STR landscape.
| Market | Active Properties | Monthly Revenue | Daily Rate | Avg. Occupancy |
|---|---|---|---|---|
| Hat Chao Samran | 14 | $1,981 | $507.96 | 24% |
| Bang Lamung | 16 | $1,586 | $275.95 | 24% |
| Pong Ta Long | 19 | $1,105 | $401.86 | 16% |
| Mu Si | 136 | $811 | $192.21 | 22% |
| Bangkok | 12,389 | $707 | $62.09 | 46% |
| Bang Kaeo Subdistrict | 35 | $701 | $64.13 | 47% |
| Mueang | 14 | $524 | $102.98 | 26% |
| Bang Saen | 61 | $407 | $77.28 | 26% |
| Nonthaburi City Municipality | 164 | $362 | $30.07 | 51% |
| Laem Chabang | 12 | $348 | $82.05 | 27% |