Pak Chong Airbnb Market Analysis 2025: Short Term Rental Data & Vacation Rental Statistics in Nakhon Ratchasima Province, Thailand
Is Airbnb profitable in Pak Chong in 2025? Explore comprehensive Airbnb analytics for Pak Chong, Nakhon Ratchasima Province, Thailand to uncover income potential. This 2025 STR market report for Pak Chong, based on AirROI data from April 2024 to March 2025, reveals key trends in the niche market of 22 active listings.
Whether you're considering an Airbnb investment in Pak Chong, optimizing your existing vacation rental, or exploring rental arbitrage opportunities, understanding the Pak Chong Airbnb data is crucial. Leveraging the low regulation environment is key to maximizing your short term rental income potential. Let's dive into the specifics.
Key Pak Chong Airbnb Performance Metrics Overview
Monthly Airbnb Revenue Variations & Income Potential in Pak Chong (2025)
Understanding the monthly revenue variations for Airbnb listings in Pak Chong is key to maximizing your short term rental income potential. Seasonality significantly impacts earnings. Our analysis, based on data from the past 12 months, shows that the peak revenue month for STRs in Pak Chong is typically June, while April often presents the lowest earnings, highlighting opportunities for strategic pricing adjustments during shoulder and low seasons. Explore the typical Airbnb income in Pak Chong across different performance tiers:
- Best-in-class properties (Top 10%) achieve $1,650+ monthly, often utilizing dynamic pricing and superior guest experiences.
- Strong performing properties (Top 25%) earn $739 or more, indicating effective management and desirable locations/amenities.
- Typical properties (Median) generate around $349 per month, representing the average market performance.
- Entry-level properties (Bottom 25%) see earnings around $165, often with potential for optimization.
Average Monthly Airbnb Earnings Trend in Pak Chong
Pak Chong Airbnb Occupancy Rate Trends (2025)
Maximize your bookings by understanding the Pak Chong STR occupancy trends. Seasonal demand shifts significantly influence how often properties are booked. Typically, Junesees the highest demand (peak season occupancy), while September experiences the lowest (low season). Effective strategies, like adjusting minimum stays or offering promotions, can boost occupancy during slower periods. Here's how different property tiers perform in Pak Chong:
- Best-in-class properties (Top 10%) achieve 43%+ occupancy, indicating high desirability and potentially optimized availability.
- Strong performing properties (Top 25%) maintain 27% or higher occupancy, suggesting good market fit and guest satisfaction.
- Typical properties (Median) have an occupancy rate around 11%.
- Entry-level properties (Bottom 25%) average 7% occupancy, potentially facing higher vacancy.
Average Monthly Occupancy Rate Trend in Pak Chong
Average Daily Rate (ADR) Airbnb Trends in Pak Chong (2025)
Effective short term rental pricing strategy in Pak Chong involves understanding monthly ADR fluctuations. The Average Daily Rate (ADR) for Airbnb in Pak Chong typically peaks in November and dips lowest during August. Leveraging Airbnb dynamic pricing tools or strategies based on this seasonality can significantly boost revenue. Here's a look at the typical nightly rates achieved:
- Best-in-class properties (Top 10%) command rates of $253+ per night, often due to premium features or locations.
- Strong performing properties (Top 25%) achieve nightly rates of $143 or more.
- Typical properties (Median) charge around $81 per night.
- Entry-level properties (Bottom 25%) earn around $34 per night.
Average Daily Rate (ADR) Trend by Month in Pak Chong
Get Live Pak Chong Market Intelligence 👇

Explore Real-time Analytics
Airbnb Seasonality Analysis & Trends in Pak Chong (2025)
Peak Season (June, December, July)
- Revenue averages $922 per month
- Occupancy rates average 25.2%
- Daily rates average $107
Shoulder Season
- Revenue averages $549 per month
- Occupancy maintains around 16.3%
- Daily rates hold near $107
Low Season (February, April, November)
- Revenue drops to average $399 per month
- Occupancy decreases to average 16.2%
- Daily rates adjust to average $119
Seasonality Insights for Pak Chong
- The Airbnb seasonality in Pak Chong shows highly seasonal trends requiring careful strategy. While the sections above show seasonal averages, it's also insightful to look at the extremes:
- During the high season, the absolute peak month showcases Pak Chong's highest earning potential, with monthly revenues capable of climbing to $1,066, occupancy reaching a high of 31.7%, and ADRs peaking at $131.
- Conversely, the slowest single month of the year, typically falling within the low season, marks the market's lowest point. In this month, revenue might dip to $323, occupancy could drop to 13.3%, and ADRs may adjust down to $96.
- Understanding both the seasonal averages and these monthly peaks and troughs in revenue, occupancy, and ADR is crucial for maximizing your Airbnb profit potential in Pak Chong.
Seasonal Strategies for Maximizing Profit
- Peak Season: Maximize revenue through premium pricing and potentially longer minimum stays. Ensure high availability.
- Low Season: Offer competitive pricing, special promotions (e.g., extended stay discounts), and flexible cancellation policies. Target off-season travelers like remote workers or budget-conscious guests.
- Shoulder Seasons: Implement dynamic pricing that balances peak and low rates. Target weekend travelers or specific events. Offer slightly more flexible terms than peak season.
- Regularly analyze your own performance against these Pak Chong seasonality benchmarks and adjust your pricing and availability strategy accordingly.
Best Areas for Airbnb Investment in Pak Chong (2025)
Exploring the top neighborhoods for short-term rentals in Pak Chong? This section highlights key areas, outlining why they are attractive for hosts and guests, along with notable local attractions. Consider these locations based on your target guest profile and investment strategy.
| Neighborhood / Area | Why Host Here? (Target Guests & Appeal) | Key Attractions & Landmarks |
|---|---|---|
| Khao Yai National Park | Renowned for its stunning natural beauty, diverse wildlife, and excellent hiking trails. Perfect for nature lovers and families. | Khao Yai National Park, Haew Narok Waterfall, Khao Yai Art Museum, Palette Art Village, PB Valley Khao Yai Winery, Pak Chong Night Market |
| Pak Chong Town Center | The bustling center of Pak Chong, close to amenities, eateries, and shops. Ideal for guests seeking convenience and local culture. | Pak Chong Market, Pak Chong Night Bazaar, Local Thai restaurants, Shopping malls, Temples |
| Green Market | A charming area popular for its lush surroundings and local produce markets. Appeals to eco-conscious travelers and those who appreciate agriculture. | Green Market Pak Chong, Local farms, Organic cafes, Nature trails, Cycling routes |
| Khao Yai Winery Area | Home to several beautiful wineries, offering tours and tastings. Great for those looking to enjoy wine and the picturesque countryside. | PB Valley Khao Yai Winery, Yasathorn Winery, Wine tasting tours, Vineyard tours, Scenic views |
| Chok Chai District | Known for its agricultural landscape, this area attracts visitors interested in farm experiences and local Thai culture. | Chok Chai Farm, Chok Chai Market, Local farms, Farm stays |
| Khao Yai Animal Park | An exciting attraction for families and animal lovers, hosting a variety of wildlife. Great for interactive experiences with animals. | Khao Yai Animal Park, Petting zoo, Wildlife tours, Family-friendly activities |
| Pha Kluai Mai Waterfall | A beautiful waterfall surrounded by nature, attracting visitors looking for relaxation and scenic views. | Pha Kluai Mai Waterfall, Hiking trails, Picnic spots, Scenic viewpoints |
| Khao Yai National Park Entrance | Strategic location for tourists looking to explore Khao Yai National Park, providing accessibility and plenty of information. | Khao Yai National Park entrance, Visitor center, Eco-tours, Guided hikes |
Understanding Airbnb License Requirements & STR Laws in Pak Chong (2025)
While Pak Chong, Nakhon Ratchasima Province, Thailand currently shows low STR regulations, specific Airbnb license requirements might still exist or change. Always verify the latest short term rental regulations and Airbnb license requirements directly with local government authorities for Pak Chong to ensure full compliance before hosting.
(Source: AirROI data, 2025, finding no licensed listings among those analyzed)
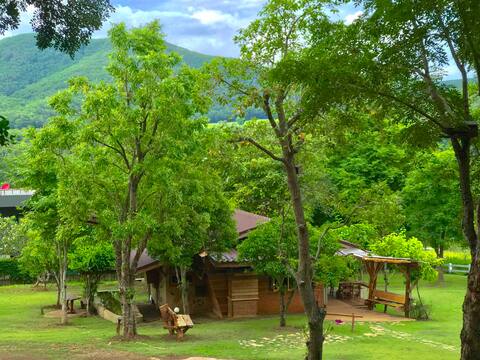
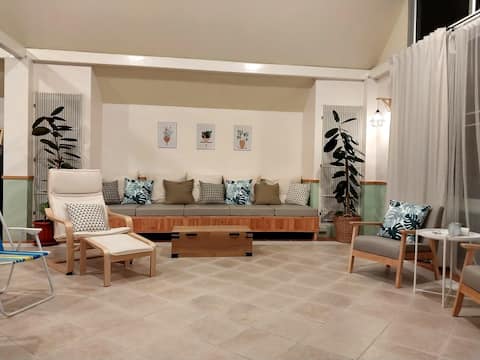
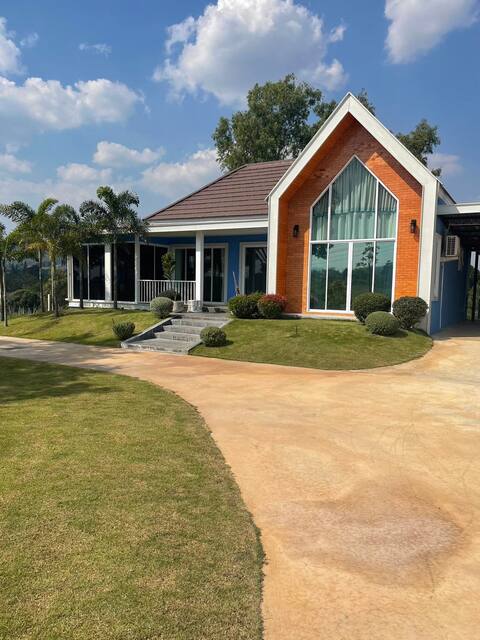
Top Performing Airbnb Properties in Pak Chong (2025)
Benchmark your potential! Explore examples of top-performing Airbnb properties in Pak Chongbased on Trailing Twelve Month (TTM) revenue. Analyze their characteristics, revenue, occupancy rate, and ADR to understand what drives success in this market.

Alis's house @Khaoyai 5 Bedroom
Entire Place • 5 bedrooms
Pakchong Cottage with Fan
Entire Place • 1 bedroom
Casa Hill Pakchong
Entire Place • 2 bedrooms
Stellina Hillside Villa
Entire Place • 2 bedrooms
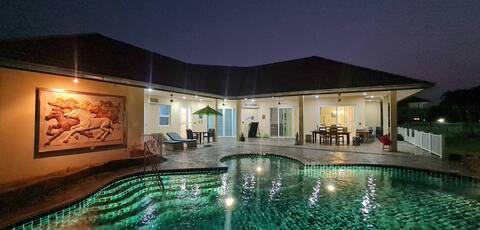
Pool villa 3 bed, 3 bath
Entire Place • 3 bedrooms
บ้านพักตากอากาศใจกลางปากช่อง/เขาใหญ่
Entire Place • 4 bedrooms
Note: Performance varies based on location, size, amenities, seasonality, and management quality. Data reflects the past 12 months.
Top Performing Airbnb Hosts in Pak Chong (2025)
Learn from the best! This table showcases top-performing Airbnb hosts in Pak Chong based on the number of properties managed and estimated total revenue over the past year. Analyze their scale and performance metrics.
| Host Name | Properties | Grossing Revenue | Stay Reviews | Avg Rating |
|---|---|---|---|---|
| Alisa | 1 | $13,635 | 12 | 4.75/5.0 |
| Ataphon | 1 | $9,621 | 45 | 5.00/5.0 |
| Arkom | 1 | $9,013 | 49 | 4.76/5.0 |
| Host #487858210 | 1 | $7,284 | 1 | 0.00/5.0 |
| Host #68984896 | 1 | $7,215 | 0 | 0.00/5.0 |
| Host #345769437 | 1 | $5,885 | 1 | 0.00/5.0 |
| Natalie | 1 | $5,067 | 44 | 4.64/5.0 |
| Host #96171693 | 1 | $4,029 | 0 | 0.00/5.0 |
| Host #483240816 | 2 | $2,071 | 1 | 0.00/5.0 |
| Aruch | 1 | $1,943 | 13 | 4.62/5.0 |
Analyzing the strategies of top hosts, such as their property selection, pricing, and guest communication, can offer valuable lessons for optimizing your own Airbnb operations in Pak Chong.
Dive Deeper: Advanced Pak Chong STR Market Data (2025)
Ready to unlock more insights? AirROI provides access to advanced metrics and comprehensive Airbnb data for Pak Chong. Explore detailed analytics beyond this report to refine your investment strategy, optimize pricing, and maximize your vacation rental profits.
Explore Advanced MetricsPak Chong Short-Term Rental Market Composition (2025): Property & Room Types
Room Type Distribution
Property Type Distribution
Market Composition Insights for Pak Chong
- The Pak Chong Airbnb market composition is heavily skewed towards Entire Home/Apt listings, which make up 68.2% of the 22 active rentals. This indicates strong guest preference for privacy and space.
- However, a notable 27.3% share for Private Rooms suggests opportunities for budget-conscious travelers or hosts renting out spare rooms.
- Looking at the property type distribution in Pak Chong, House properties are the most common (54.5%), reflecting the local real estate landscape.
- Houses represent a significant 54.5% portion, catering likely to families or larger groups.
- The presence of 22.7% Hotel/Boutique listings indicates integration with traditional hospitality.
- Smaller segments like others (combined 4.5%) offer potential for unique stay experiences.
Pak Chong Airbnb Room Capacity Analysis (2025): Bedroom Distribution
Distribution of Listings by Number of Bedrooms
Room Capacity Insights for Pak Chong
- The dominant room capacity in Pak Chong is 1 bedroom listings, making up 40.9% of the market. This suggests a strong demand for properties suitable for couples or solo travelers.
- Together, 1 bedroom and 2 bedrooms properties represent 68.2% of the active Airbnb listings in Pak Chong, indicating a high concentration in these sizes.
- A significant 22.6% of listings offer 3+ bedrooms, catering to larger groups and families seeking more space in Pak Chong.
Pak Chong Vacation Rental Guest Capacity Trends (2025)
Distribution of Listings by Guest Capacity
Guest Capacity Insights for Pak Chong
- The most common guest capacity trend in Pak Chong vacation rentals is listings accommodating 8+ guests (31.8%). This suggests the primary traveler segment is likely larger groups.
- Properties designed for 8+ guests and 2 guests dominate the Pak Chong STR market, accounting for 59.1% of listings.
- 36.3% of properties accommodate 6+ guests, serving the market segment for larger families or group travel in Pak Chong.
- On average, properties in Pak Chong are equipped to host 4.5 guests.
Pak Chong Airbnb Booking Patterns (2025): Available vs. Booked Days
Available Days Distribution
Booked Days Distribution
Booking Pattern Insights for Pak Chong
- The most common availability pattern in Pak Chong falls within the 271-366 days range, representing 95.5% of listings. This suggests many properties have significant open periods on their calendars.
- Approximately 100.0% of listings show high availability (181+ days open annually), indicating potential for increased bookings or specific owner usage patterns.
- For booked days, the 1-30 days range is most frequent in Pak Chong (72.7%), reflecting common guest stay durations or potential owner blocking patterns.
Pak Chong Airbnb Minimum Stay Requirements Analysis
Distribution of Listings by Minimum Night Requirement
1 Night
16 listings
84.2% of total
2 Nights
2 listings
10.5% of total
7-29 Nights
1 listings
5.3% of total
Key Insights
- The most prevalent minimum stay requirement in Pak Chong is 1 Night, adopted by 84.2% of listings. This highlights the market's preference for shorter, flexible bookings.
- A strong majority (94.7%) of the Pak Chong Airbnb data shows acceptance of very short stays (1-2 nights), indicating a dynamic, high-turnover market.
Recommendations
- Align with the market by considering a 1 Night minimum stay, as 84.2% of Pak Chong hosts use this setting.
- Adjust minimum nights based on seasonality – potentially shorter during low season and longer during peak demand periods in Pak Chong.
Pak Chong Airbnb Cancellation Policy Trends Analysis (2025)
Moderate
5 listings
45.5% of total
Firm
1 listings
9.1% of total
Strict
5 listings
45.5% of total
Cancellation Policy Insights for Pak Chong
- The prevailing Airbnb cancellation policy trend in Pak Chong is Moderate, used by 45.5% of listings.
- A majority (54.6%) of hosts in Pak Chong utilize Firm or Strict policies, indicating a market where hosts prioritize booking security.
Recommendations for Hosts
- Consider adopting a Moderate policy to align with the 45.5% market standard in Pak Chong.
- With 45.5% using Strict terms, this is a viable option in Pak Chong, particularly for high-value properties or during peak demand periods.
- Regularly review your cancellation policy against competitors and market demand shifts in Pak Chong.
Pak Chong STR Booking Lead Time Analysis (2025)
Average Booking Lead Time by Month
Booking Lead Time Insights for Pak Chong
- The overall average booking lead time for vacation rentals in Pak Chong is 45 days.
- Guests book furthest in advance for stays during December (average 55 days), likely coinciding with peak travel demand or local events.
- The shortest booking windows occur for stays in July (average 10 days), indicating more last-minute travel plans during this time.
- Seasonally, Winter (35 days avg.) sees the longest lead times, while Summer (12 days avg.) has the shortest, reflecting typical travel planning cycles.
Recommendations for Hosts
- Use the overall average lead time (45 days) as a baseline for your pricing and availability strategy in Pak Chong.
- During July, focus on last-minute booking availability and promotions, as guests book with very short notice (10 days avg.).
- Target marketing efforts for the Winter season well in advance (at least 35 days) to capture early planners.
- Monitor your own booking lead times against these Pak Chong averages to identify opportunities for dynamic pricing adjustments.
Popular & Essential Airbnb Amenities in Pak Chong (2025)
Amenity Prevalence
Amenity Insights for Pak Chong
- Essential amenities in Pak Chong that guests expect include: TV, Wifi, Essentials, Free parking on premises, Air conditioning. Lacking these (any) could significantly impact bookings.
- Popular amenities like Kitchen, Hot water, Washer are common but not universal. Offering these can provide a competitive edge.
Recommendations for Hosts
- Ensure your listing includes all essential amenities for Pak Chong: TV, Wifi, Essentials, Free parking on premises, Air conditioning.
- Prioritize adding missing essentials: Essentials, Free parking on premises, Air conditioning.
- Consider adding popular differentiators like Kitchen or Hot water to increase appeal.
- Highlight unique or less common amenities you offer (e.g., hot tub, dedicated workspace, EV charger) in your listing description and photos.
- Regularly check competitor amenities in Pak Chong to stay competitive.
Pak Chong Airbnb Guest Demographics & Profile Analysis (2025)
Guest Profile Summary for Pak Chong
- The typical guest profile for Airbnb in Pak Chong consists of a mix of domestic (50%) and international guests, with top international origins including Australia, typically belonging to the Post-2000s (Gen Z/Alpha) group (50%), primarily speaking English or Thai.
- Domestic travelers account for 50.0% of guests.
- Key international markets include Thailand (50%) and Australia (13.6%).
- Top languages spoken are English (52%) followed by Thai (28%).
- A significant demographic segment is the Post-2000s (Gen Z/Alpha) group, representing 50% of guests.
Recommendations for Hosts
- Balance marketing efforts between domestic and international channels based on the guest mix.
- Tailor amenities and listing descriptions to appeal to the dominant Post-2000s (Gen Z/Alpha) demographic (e.g., highlight fast WiFi, smart home features, local guides).
- Highlight unique local experiences or amenities relevant to the primary guest profile.
- Consider seasonal promotions aligned with peak travel times for key origin markets.
Nearby Short-Term Rental Market Comparison
How does the Pak Chong Airbnb market stack up against its neighbors? Compare key performance metrics like average monthly revenue, ADR, and occupancy rates in surrounding areas to understand the broader regional STR landscape.
| Market | Active Properties | Monthly Revenue | Daily Rate | Avg. Occupancy |
|---|---|---|---|---|
| Hat Chao Samran | 14 | $1,981 | $507.96 | 24% |
| Bang Lamung | 16 | $1,586 | $275.95 | 24% |
| Pong Ta Long | 19 | $1,105 | $401.86 | 16% |
| Sima Mongkhon | 58 | $867 | $189.81 | 22% |
| Mu Si | 136 | $811 | $192.21 | 22% |
| Bangkok | 12,389 | $707 | $62.09 | 46% |
| Bang Kaeo Subdistrict | 35 | $701 | $64.14 | 47% |
| Mueang | 14 | $524 | $102.98 | 26% |
| Bang Saen | 61 | $407 | $77.28 | 26% |
| Nonthaburi City Municipality | 164 | $362 | $30.07 | 51% |