Ban Wiang Nua Airbnb Market Analysis 2025: Short Term Rental Data & Vacation Rental Statistics in Mae Hong Son Province, Thailand
Is Airbnb profitable in Ban Wiang Nua in 2025? Explore comprehensive Airbnb analytics for Ban Wiang Nua, Mae Hong Son Province, Thailand to uncover income potential. This 2025 STR market report for Ban Wiang Nua, based on AirROI data from April 2024 to March 2025, reveals key trends in the niche market of 21 active listings.
Whether you're considering an Airbnb investment in Ban Wiang Nua, optimizing your existing vacation rental, or exploring rental arbitrage opportunities, understanding the Ban Wiang Nua Airbnb data is crucial. Leveraging the low regulation environment is key to maximizing your short term rental income potential. Let's dive into the specifics.
Key Ban Wiang Nua Airbnb Performance Metrics Overview
Monthly Airbnb Revenue Variations & Income Potential in Ban Wiang Nua (2025)
Understanding the monthly revenue variations for Airbnb listings in Ban Wiang Nua is key to maximizing your short term rental income potential. Seasonality significantly impacts earnings. Our analysis, based on data from the past 12 months, shows that the peak revenue month for STRs in Ban Wiang Nua is typically January, while August often presents the lowest earnings, highlighting opportunities for strategic pricing adjustments during shoulder and low seasons. Explore the typical Airbnb income in Ban Wiang Nua across different performance tiers:
- Best-in-class properties (Top 10%) achieve $1,312+ monthly, often utilizing dynamic pricing and superior guest experiences.
- Strong performing properties (Top 25%) earn $526 or more, indicating effective management and desirable locations/amenities.
- Typical properties (Median) generate around $352 per month, representing the average market performance.
- Entry-level properties (Bottom 25%) see earnings around $221, often with potential for optimization.
Average Monthly Airbnb Earnings Trend in Ban Wiang Nua
Ban Wiang Nua Airbnb Occupancy Rate Trends (2025)
Maximize your bookings by understanding the Ban Wiang Nua STR occupancy trends. Seasonal demand shifts significantly influence how often properties are booked. Typically, Januarysees the highest demand (peak season occupancy), while August experiences the lowest (low season). Effective strategies, like adjusting minimum stays or offering promotions, can boost occupancy during slower periods. Here's how different property tiers perform in Ban Wiang Nua:
- Best-in-class properties (Top 10%) achieve 63%+ occupancy, indicating high desirability and potentially optimized availability.
- Strong performing properties (Top 25%) maintain 48% or higher occupancy, suggesting good market fit and guest satisfaction.
- Typical properties (Median) have an occupancy rate around 34%.
- Entry-level properties (Bottom 25%) average 19% occupancy, potentially facing higher vacancy.
Average Monthly Occupancy Rate Trend in Ban Wiang Nua
Average Daily Rate (ADR) Airbnb Trends in Ban Wiang Nua (2025)
Effective short term rental pricing strategy in Ban Wiang Nua involves understanding monthly ADR fluctuations. The Average Daily Rate (ADR) for Airbnb in Ban Wiang Nua typically peaks in January and dips lowest during November. Leveraging Airbnb dynamic pricing tools or strategies based on this seasonality can significantly boost revenue. Here's a look at the typical nightly rates achieved:
- Best-in-class properties (Top 10%) command rates of $93+ per night, often due to premium features or locations.
- Strong performing properties (Top 25%) achieve nightly rates of $53 or more.
- Typical properties (Median) charge around $35 per night.
- Entry-level properties (Bottom 25%) earn around $25 per night.
Average Daily Rate (ADR) Trend by Month in Ban Wiang Nua
Get Live Ban Wiang Nua Market Intelligence 👇

Explore Real-time Analytics
Airbnb Seasonality Analysis & Trends in Ban Wiang Nua (2025)
Peak Season (January, February, December)
- Revenue averages $866 per month
- Occupancy rates average 61.1%
- Daily rates average $50
Shoulder Season
- Revenue averages $519 per month
- Occupancy maintains around 31.0%
- Daily rates hold near $47
Low Season (July, August, September)
- Revenue drops to average $141 per month
- Occupancy decreases to average 13.2%
- Daily rates adjust to average $46
Seasonality Insights for Ban Wiang Nua
- The Airbnb seasonality in Ban Wiang Nua shows highly seasonal trends requiring careful strategy. While the sections above show seasonal averages, it's also insightful to look at the extremes:
- During the high season, the absolute peak month showcases Ban Wiang Nua's highest earning potential, with monthly revenues capable of climbing to $970, occupancy reaching a high of 64.3%, and ADRs peaking at $53.
- Conversely, the slowest single month of the year, typically falling within the low season, marks the market's lowest point. In this month, revenue might dip to $120, occupancy could drop to 9.2%, and ADRs may adjust down to $45.
- Understanding both the seasonal averages and these monthly peaks and troughs in revenue, occupancy, and ADR is crucial for maximizing your Airbnb profit potential in Ban Wiang Nua.
Seasonal Strategies for Maximizing Profit
- Peak Season: Maximize revenue through premium pricing and potentially longer minimum stays. Ensure high availability.
- Low Season: Offer competitive pricing, special promotions (e.g., extended stay discounts), and flexible cancellation policies. Target off-season travelers like remote workers or budget-conscious guests.
- Shoulder Seasons: Implement dynamic pricing that balances peak and low rates. Target weekend travelers or specific events. Offer slightly more flexible terms than peak season.
- Regularly analyze your own performance against these Ban Wiang Nua seasonality benchmarks and adjust your pricing and availability strategy accordingly.
Best Areas for Airbnb Investment in Ban Wiang Nua (2025)
Exploring the top neighborhoods for short-term rentals in Ban Wiang Nua? This section highlights key areas, outlining why they are attractive for hosts and guests, along with notable local attractions. Consider these locations based on your target guest profile and investment strategy.
| Neighborhood / Area | Why Host Here? (Target Guests & Appeal) | Key Attractions & Landmarks |
|---|---|---|
| Soppong | A peaceful village located near stunning caves and natural landscapes. Attractive to nature lovers and those seeking a serene getaway, allowing for unique Airbnb offerings. | Tham Lod Cave, Soppong River, Bamboo Bridge, Nature trails, Local markets |
| Mae Hong Son | The capital of Mae Hong Son province with rich culture and history. It attracts tourists interested in local traditions, making it a great area for Airbnb hosting. | Wat Phra That Doi Kong Mu, Mae Hong Son Lake, Pha Bong Market, Local handicrafts, Cultural festivals |
| Salween National Park | An area of breathtaking natural beauty, perfect for ecotourism. Ideal for hosting travelers looking for adventure and outdoor activities such as trekking. | Hiking trails, Scenic viewpoints, Wildlife spotting, Cultural experiences with local tribes |
| Nang Non Ni | A beautiful viewpoint offering stunning views of the mountains and local culture. Great for tourists looking for unique scenic experiences and photography opportunities. | Viewing platforms, Coffee shops, Cultural experiences, Sunset views |
| Huai Nam Dang National Park | Known for its stunning mountain landscapes and variety of flora and fauna. Attracts hikers, cyclists, and nature lovers, making it great for Airbnb listings focusing on ecotourism. | Mountain views, Nature trails, Camping, Flora and fauna diversity |
| Ban Rak Thai | A small village known for its distinctive Yunnanese culture and tea plantations. Attracts tourists interested in cultural experiences and beautiful tea valley views. | Tea plantations, Chinese temples, Lake views, Yunnanese food, Scenic walks |
| Tha Song Yang | Less traveled area with beautiful waterfalls and natural scenery, perfect for tourists looking for peace and tranquility. Offers opportunities for eco-friendly tourism. | Waterfalls, Nature trails, Local villages, Cultural experiences |
Understanding Airbnb License Requirements & STR Laws in Ban Wiang Nua (2025)
While Ban Wiang Nua, Mae Hong Son Province, Thailand currently shows low STR regulations, specific Airbnb license requirements might still exist or change. Always verify the latest short term rental regulations and Airbnb license requirements directly with local government authorities for Ban Wiang Nua to ensure full compliance before hosting.
(Source: AirROI data, 2025, finding no licensed listings among those analyzed)
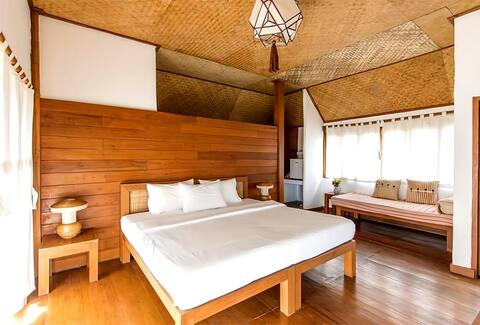
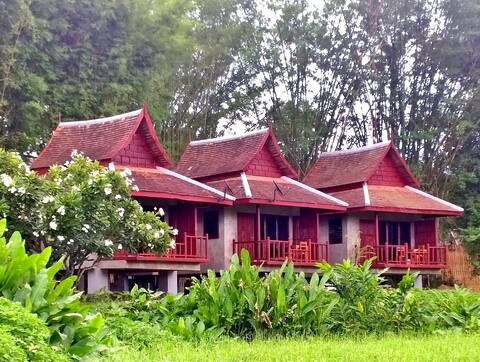
Top Performing Airbnb Properties in Ban Wiang Nua (2025)
Benchmark your potential! Explore examples of top-performing Airbnb properties in Ban Wiang Nuabased on Trailing Twelve Month (TTM) revenue. Analyze their characteristics, revenue, occupancy rate, and ADR to understand what drives success in this market.

Villa Wolfsbau
Entire Place • 4 bedrooms

River Pai Thai twin villa
Entire Place • 1 bedroom

Art farm Studio ( S4 moon tower) AC. room.
Entire Place • 1 bedroom
Villa 2 bedrooms A
Entire Place • 2 bedrooms
River Pai Thai Twin Cottage
Entire Place • N/A

River Pai Thai Teak Villa
Entire Place • N/A
Note: Performance varies based on location, size, amenities, seasonality, and management quality. Data reflects the past 12 months.
Top Performing Airbnb Hosts in Ban Wiang Nua (2025)
Learn from the best! This table showcases top-performing Airbnb hosts in Ban Wiang Nua based on the number of properties managed and estimated total revenue over the past year. Analyze their scale and performance metrics.
| Host Name | Properties | Grossing Revenue | Stay Reviews | Avg Rating |
|---|---|---|---|---|
| Patcharin | 9 | $35,704 | 736 | 4.64/5.0 |
| Karl-Heinz | 4 | $30,586 | 124 | 4.73/5.0 |
| Vacharamon | 4 | $17,158 | 945 | 4.80/5.0 |
| Host #565671300 | 1 | $2,140 | 2 | 0.00/5.0 |
| Wowe | 2 | $1,819 | 18 | 4.80/5.0 |
| Virut | 1 | $350 | 8 | 5.00/5.0 |
Analyzing the strategies of top hosts, such as their property selection, pricing, and guest communication, can offer valuable lessons for optimizing your own Airbnb operations in Ban Wiang Nua.
Dive Deeper: Advanced Ban Wiang Nua STR Market Data (2025)
Ready to unlock more insights? AirROI provides access to advanced metrics and comprehensive Airbnb data for Ban Wiang Nua. Explore detailed analytics beyond this report to refine your investment strategy, optimize pricing, and maximize your vacation rental profits.
Explore Advanced MetricsBan Wiang Nua Short-Term Rental Market Composition (2025): Property & Room Types
Room Type Distribution
Property Type Distribution
Market Composition Insights for Ban Wiang Nua
- The Ban Wiang Nua Airbnb market composition is heavily skewed towards Entire Home/Apt listings, which make up 90.5% of the 21 active rentals. This indicates strong guest preference for privacy and space.
- Looking at the property type distribution in Ban Wiang Nua, House properties are the most common (61.9%), reflecting the local real estate landscape.
- Houses represent a significant 61.9% portion, catering likely to families or larger groups.
- The presence of 9.5% Hotel/Boutique listings indicates integration with traditional hospitality.
Ban Wiang Nua Airbnb Room Capacity Analysis (2025): Bedroom Distribution
Distribution of Listings by Number of Bedrooms
Room Capacity Insights for Ban Wiang Nua
- The dominant room capacity in Ban Wiang Nua is 1 bedroom listings, making up 42.9% of the market. This suggests a strong demand for properties suitable for couples or solo travelers.
- Together, 1 bedroom and 2 bedrooms properties represent 66.7% of the active Airbnb listings in Ban Wiang Nua, indicating a high concentration in these sizes.
- Listings with 3+ bedrooms (4.8%) represent a smaller niche, potentially indicating an underserved market for larger group accommodations in Ban Wiang Nua.
Ban Wiang Nua Vacation Rental Guest Capacity Trends (2025)
Distribution of Listings by Guest Capacity
Guest Capacity Insights for Ban Wiang Nua
- The most common guest capacity trend in Ban Wiang Nua vacation rentals is listings accommodating 2 guests (66.7%). This suggests the primary traveler segment is likely couples or solo travelers.
- Properties designed for 2 guests and 4 guests dominate the Ban Wiang Nua STR market, accounting for 81.0% of listings.
- A significant 66.7% of listings cater specifically to 1-2 guests, highlighting strong demand from couples and solo travelers in Ban Wiang Nua.
- Listings for large groups (6+ guests) are relatively rare (4.8%), potentially indicating an opportunity for hosts targeting this segment in Ban Wiang Nua.
- On average, properties in Ban Wiang Nua are equipped to host 3.0 guests.
Ban Wiang Nua Airbnb Booking Patterns (2025): Available vs. Booked Days
Available Days Distribution
Booked Days Distribution
Booking Pattern Insights for Ban Wiang Nua
- The most common availability pattern in Ban Wiang Nua falls within the 181-270 days range, representing 57.1% of listings. This suggests many properties have significant open periods on their calendars.
- Approximately 100.0% of listings show high availability (181+ days open annually), indicating potential for increased bookings or specific owner usage patterns.
- For booked days, the 91-180 days range is most frequent in Ban Wiang Nua (57.1%), reflecting common guest stay durations or potential owner blocking patterns.
Ban Wiang Nua Airbnb Minimum Stay Requirements Analysis
Distribution of Listings by Minimum Night Requirement
1 Night
14 listings
66.7% of total
2 Nights
1 listings
4.8% of total
3 Nights
4 listings
19% of total
4-6 Nights
1 listings
4.8% of total
30+ Nights
1 listings
4.8% of total
Key Insights
- The most prevalent minimum stay requirement in Ban Wiang Nua is 1 Night, adopted by 66.7% of listings. This highlights the market's preference for shorter, flexible bookings.
- A strong majority (71.5%) of the Ban Wiang Nua Airbnb data shows acceptance of very short stays (1-2 nights), indicating a dynamic, high-turnover market.
Recommendations
- Align with the market by considering a 1 Night minimum stay, as 66.7% of Ban Wiang Nua hosts use this setting.
- Adjust minimum nights based on seasonality – potentially shorter during low season and longer during peak demand periods in Ban Wiang Nua.
Ban Wiang Nua Airbnb Cancellation Policy Trends Analysis (2025)
Flexible
7 listings
35% of total
Moderate
5 listings
25% of total
Strict
8 listings
40% of total
Cancellation Policy Insights for Ban Wiang Nua
- The prevailing Airbnb cancellation policy trend in Ban Wiang Nua is Strict, used by 40% of listings.
- There's a relatively balanced mix between guest-friendly (60.0%) and stricter (40.0%) policies, offering choices for different guest needs.
Recommendations for Hosts
- Consider adopting a Strict policy to align with the 40% market standard in Ban Wiang Nua.
- With 40% using Strict terms, this is a viable option in Ban Wiang Nua, particularly for high-value properties or during peak demand periods.
- Regularly review your cancellation policy against competitors and market demand shifts in Ban Wiang Nua.
Ban Wiang Nua STR Booking Lead Time Analysis (2025)
Average Booking Lead Time by Month
Booking Lead Time Insights for Ban Wiang Nua
- The overall average booking lead time for vacation rentals in Ban Wiang Nua is 31 days.
- Guests book furthest in advance for stays during April (average 82 days), likely coinciding with peak travel demand or local events.
- The shortest booking windows occur for stays in September (average 7 days), indicating more last-minute travel plans during this time.
- Seasonally, Spring (53 days avg.) sees the longest lead times, while Winter (28 days avg.) has the shortest, reflecting typical travel planning cycles.
Recommendations for Hosts
- Use the overall average lead time (31 days) as a baseline for your pricing and availability strategy in Ban Wiang Nua.
- For April stays, consider implementing length-of-stay discounts or slightly higher rates for bookings made less than 82 days out to capitalize on advance planning.
- During September, focus on last-minute booking availability and promotions, as guests book with very short notice (7 days avg.).
- Target marketing efforts for the Spring season well in advance (at least 53 days) to capture early planners.
- Monitor your own booking lead times against these Ban Wiang Nua averages to identify opportunities for dynamic pricing adjustments.
Popular & Essential Airbnb Amenities in Ban Wiang Nua (2025)
Amenity Prevalence
Amenity Insights for Ban Wiang Nua
- Essential amenities in Ban Wiang Nua that guests expect include: Wifi. Lacking these (this) could significantly impact bookings.
- Popular amenities like Hangers, Free parking on premises, Essentials are common but not universal. Offering these can provide a competitive edge.
Recommendations for Hosts
- Ensure your listing includes all essential amenities for Ban Wiang Nua: Wifi.
- Consider adding popular differentiators like Hangers or Free parking on premises to increase appeal.
- Highlight unique or less common amenities you offer (e.g., hot tub, dedicated workspace, EV charger) in your listing description and photos.
- Regularly check competitor amenities in Ban Wiang Nua to stay competitive.
Ban Wiang Nua Airbnb Guest Demographics & Profile Analysis (2025)
Guest Profile Summary for Ban Wiang Nua
- The typical guest profile for Airbnb in Ban Wiang Nua consists of predominantly international visitors (93%), with top international origins including United Kingdom, typically belonging to the Post-2000s (Gen Z/Alpha) group (50%), primarily speaking English or German.
- Domestic travelers account for 6.6% of guests.
- Key international markets include Germany (16.4%) and United Kingdom (12.3%).
- Top languages spoken are English (47.1%) followed by German (12.9%).
- A significant demographic segment is the Post-2000s (Gen Z/Alpha) group, representing 50% of guests.
Recommendations for Hosts
- Focus marketing internationally, particularly towards travelers from United Kingdom.
- Tailor amenities and listing descriptions to appeal to the dominant Post-2000s (Gen Z/Alpha) demographic (e.g., highlight fast WiFi, smart home features, local guides).
- Highlight unique local experiences or amenities relevant to the primary guest profile.
- Consider seasonal promotions aligned with peak travel times for key origin markets.
Nearby Short-Term Rental Market Comparison
How does the Ban Wiang Nua Airbnb market stack up against its neighbors? Compare key performance metrics like average monthly revenue, ADR, and occupancy rates in surrounding areas to understand the broader regional STR landscape.
| Market | Active Properties | Monthly Revenue | Daily Rate | Avg. Occupancy |
|---|---|---|---|---|
| Don Keow Village | 18 | $2,098 | $171.46 | 46% |
| Ban Tong Kai | 10 | $1,750 | $221.37 | 36% |
| Ban Ko Klang | 12 | $1,554 | $173.13 | 36% |
| San Phra Net | 28 | $1,391 | $131.16 | 39% |
| Ban Rong Ruea Kham | 25 | $1,110 | $131.85 | 36% |
| Mae Rim | 15 | $1,066 | $161.70 | 30% |
| Ban Pa Daet Tai | 14 | $1,024 | $136.16 | 40% |
| Chiang Dao | 35 | $963 | $193.13 | 25% |
| Nong Phueng | 26 | $891 | $100.46 | 41% |
| Nong Hoi | 235 | $877 | $63.88 | 52% |