Ban Khlong Son Airbnb Market Analysis 2025: Short Term Rental Data & Vacation Rental Statistics in Krabi Province, Thailand
Is Airbnb profitable in Ban Khlong Son in 2025? Explore comprehensive Airbnb analytics for Ban Khlong Son, Krabi Province, Thailand to uncover income potential. This 2025 STR market report for Ban Khlong Son, based on AirROI data from April 2024 to March 2025, reveals key trends in the niche market of 31 active listings.
Whether you're considering an Airbnb investment in Ban Khlong Son, optimizing your existing vacation rental, or exploring rental arbitrage opportunities, understanding the Ban Khlong Son Airbnb data is crucial. Leveraging the low regulation environment is key to maximizing your short term rental income potential. Let's dive into the specifics.
Key Ban Khlong Son Airbnb Performance Metrics Overview
Monthly Airbnb Revenue Variations & Income Potential in Ban Khlong Son (2025)
Understanding the monthly revenue variations for Airbnb listings in Ban Khlong Son is key to maximizing your short term rental income potential. Seasonality significantly impacts earnings. Our analysis, based on data from the past 12 months, shows that the peak revenue month for STRs in Ban Khlong Son is typically December, while September often presents the lowest earnings, highlighting opportunities for strategic pricing adjustments during shoulder and low seasons. Explore the typical Airbnb income in Ban Khlong Son across different performance tiers:
- Best-in-class properties (Top 10%) achieve $7,148+ monthly, often utilizing dynamic pricing and superior guest experiences.
- Strong performing properties (Top 25%) earn $4,731 or more, indicating effective management and desirable locations/amenities.
- Typical properties (Median) generate around $2,785 per month, representing the average market performance.
- Entry-level properties (Bottom 25%) see earnings around $989, often with potential for optimization.
Average Monthly Airbnb Earnings Trend in Ban Khlong Son
Ban Khlong Son Airbnb Occupancy Rate Trends (2025)
Maximize your bookings by understanding the Ban Khlong Son STR occupancy trends. Seasonal demand shifts significantly influence how often properties are booked. Typically, Januarysees the highest demand (peak season occupancy), while June experiences the lowest (low season). Effective strategies, like adjusting minimum stays or offering promotions, can boost occupancy during slower periods. Here's how different property tiers perform in Ban Khlong Son:
- Best-in-class properties (Top 10%) achieve 78%+ occupancy, indicating high desirability and potentially optimized availability.
- Strong performing properties (Top 25%) maintain 58% or higher occupancy, suggesting good market fit and guest satisfaction.
- Typical properties (Median) have an occupancy rate around 36%.
- Entry-level properties (Bottom 25%) average 20% occupancy, potentially facing higher vacancy.
Average Monthly Occupancy Rate Trend in Ban Khlong Son
Average Daily Rate (ADR) Airbnb Trends in Ban Khlong Son (2025)
Effective short term rental pricing strategy in Ban Khlong Son involves understanding monthly ADR fluctuations. The Average Daily Rate (ADR) for Airbnb in Ban Khlong Son typically peaks in January and dips lowest during August. Leveraging Airbnb dynamic pricing tools or strategies based on this seasonality can significantly boost revenue. Here's a look at the typical nightly rates achieved:
- Best-in-class properties (Top 10%) command rates of $588+ per night, often due to premium features or locations.
- Strong performing properties (Top 25%) achieve nightly rates of $342 or more.
- Typical properties (Median) charge around $182 per night.
- Entry-level properties (Bottom 25%) earn around $44 per night.
Average Daily Rate (ADR) Trend by Month in Ban Khlong Son
Get Live Ban Khlong Son Market Intelligence 👇

Explore Real-time Analytics
Airbnb Seasonality Analysis & Trends in Ban Khlong Son (2025)
Peak Season (December, January, November)
- Revenue averages $4,753 per month
- Occupancy rates average 53.4%
- Daily rates average $278
Shoulder Season
- Revenue averages $3,366 per month
- Occupancy maintains around 40.2%
- Daily rates hold near $238
Low Season (June, July, September)
- Revenue drops to average $2,286 per month
- Occupancy decreases to average 29.5%
- Daily rates adjust to average $218
Seasonality Insights for Ban Khlong Son
- The Airbnb seasonality in Ban Khlong Son shows highly seasonal trends requiring careful strategy. While the sections above show seasonal averages, it's also insightful to look at the extremes:
- During the high season, the absolute peak month showcases Ban Khlong Son's highest earning potential, with monthly revenues capable of climbing to $5,047, occupancy reaching a high of 62.4%, and ADRs peaking at $287.
- Conversely, the slowest single month of the year, typically falling within the low season, marks the market's lowest point. In this month, revenue might dip to $1,978, occupancy could drop to 24.2%, and ADRs may adjust down to $214.
- Understanding both the seasonal averages and these monthly peaks and troughs in revenue, occupancy, and ADR is crucial for maximizing your Airbnb profit potential in Ban Khlong Son.
Seasonal Strategies for Maximizing Profit
- Peak Season: Maximize revenue through premium pricing and potentially longer minimum stays. Ensure high availability.
- Low Season: Offer competitive pricing, special promotions (e.g., extended stay discounts), and flexible cancellation policies. Target off-season travelers like remote workers or budget-conscious guests.
- Shoulder Seasons: Implement dynamic pricing that balances peak and low rates. Target weekend travelers or specific events. Offer slightly more flexible terms than peak season.
- Regularly analyze your own performance against these Ban Khlong Son seasonality benchmarks and adjust your pricing and availability strategy accordingly.
Best Areas for Airbnb Investment in Ban Khlong Son (2025)
Exploring the top neighborhoods for short-term rentals in Ban Khlong Son? This section highlights key areas, outlining why they are attractive for hosts and guests, along with notable local attractions. Consider these locations based on your target guest profile and investment strategy.
| Neighborhood / Area | Why Host Here? (Target Guests & Appeal) | Key Attractions & Landmarks |
|---|---|---|
| Ao Nang | Popular tourist destination known for its beautiful beaches, vibrant nightlife, and numerous activities such as boating and scuba diving. A great spot for attracting both families and backpackers. | Ao Nang Beach, Railay Beach, Hong Island, Nopparat Thara Beach, Diving schools, Night Market |
| Railay | Famous for its stunning limestone cliffs and clear waters, Railay is a sought-after location for rock climbers and beach lovers alike. It's accessible only by boat, adding to its charm. | Railay Beach, Phra Nang Cave Beach, Rock climbing spots, Hidden lagoons, Kayaking, Walking trails |
| Koh Lanta | A serene island known for its relaxed vibe, beautiful beaches, and wildlife. Ideal for tourists looking for a peaceful retreat or family vacation. | Long Beach, Kantiang Bay, Lanta Animal Welfare, National Park, Diving and snorkeling spots, Local markets |
| Koh Phi Phi | World-renowned for its breathtaking scenery and party atmosphere, this island attracts young travelers looking for adventure and social activities. | Maya Bay, Viking Cave, Snorkeling tours, Nightlife bars, Hiking trails, Phi Phi Viewpoint |
| Krabi Town | A charming town that offers a more authentic Thai experience with local markets, food stalls, and cultural sites. Great for travelers wanting to explore the local culture. | Krabi Tiger Temple, Night Market, Krabi Riverside, Emerald Pool, Hot Springs, Wat Tham Sua |
| Tonsai Beach | A hidden gem popular among climbers and alternative tourists. The beach has a laid-back atmosphere perfect for relaxation or adventure sports. | Tonsai Beach, Climbing routes, Beachfront bungalows, Yoga retreats, Snorkeling, Local food vendors |
| Ao Nam Mao | A quieter beach area that offers a peaceful stay while remaining close to popular tourist attractions. It is suitable for families or couples looking for a tranquil experience. | Ao Nam Mao Beach, Fishing spots, Local restaurants, Kayaking, Island hopping tours, Scenic viewpoints |
| Klong Muang | An upscale beach destination with luxury resorts and a more tranquil atmosphere, attracting visitors looking for relaxation and privacy. | Klong Muang Beach, Luxury resorts, Fine dining restaurants, Golf courses, Sea kayaking, Sunsets |
Understanding Airbnb License Requirements & STR Laws in Ban Khlong Son (2025)
While Ban Khlong Son, Krabi Province, Thailand currently shows low STR regulations, specific Airbnb license requirements might still exist or change. Always verify the latest short term rental regulations and Airbnb license requirements directly with local government authorities for Ban Khlong Son to ensure full compliance before hosting.
(Source: AirROI data, 2025, finding no licensed listings among those analyzed)
Top Performing Airbnb Properties in Ban Khlong Son (2025)
Benchmark your potential! Explore examples of top-performing Airbnb properties in Ban Khlong Sonbased on Trailing Twelve Month (TTM) revenue. Analyze their characteristics, revenue, occupancy rate, and ADR to understand what drives success in this market.
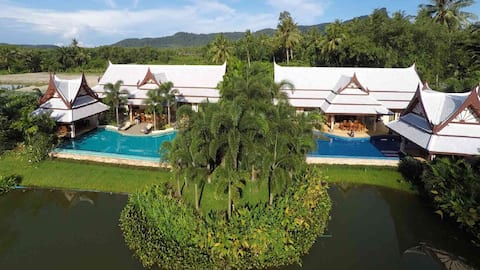
Villa Saifon 'Twins' - 8 Bedrooms 16 Adults
Entire Place • 8 bedrooms

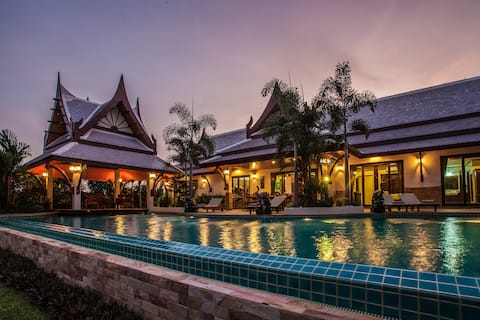
8 Bedroom Private Pool Villa in Aonang
Entire Place • 8 bedrooms
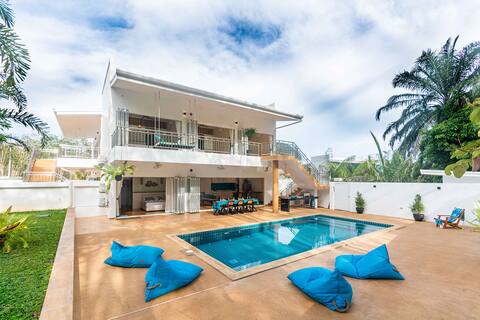
Villa Saifon 2 - Pool villa - 5 Bedrooms 10 Adults
Entire Place • 5 bedrooms
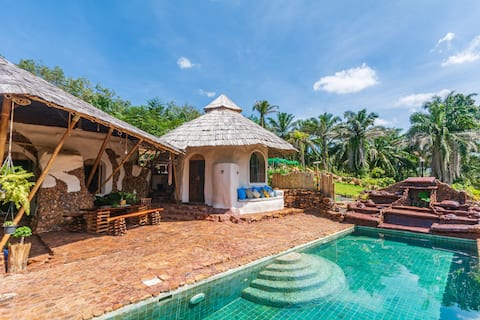
8 Palm Villa 4 - 4 bedroom Private Pool Villa
Entire Place • 4 bedrooms
Seaview Bedrock Home
Entire Place • 3 bedrooms

Private pool villa overlooking the mountains
Entire Place • 4 bedrooms
Note: Performance varies based on location, size, amenities, seasonality, and management quality. Data reflects the past 12 months.
Top Performing Airbnb Hosts in Ban Khlong Son (2025)
Learn from the best! This table showcases top-performing Airbnb hosts in Ban Khlong Son based on the number of properties managed and estimated total revenue over the past year. Analyze their scale and performance metrics.
| Host Name | Properties | Grossing Revenue | Stay Reviews | Avg Rating |
|---|---|---|---|---|
| Saifon | 6 | $338,400 | 75 | 3.30/5.0 |
| Eight Palm Villa Krabi | 3 | $170,880 | 29 | 4.98/5.0 |
| Baan Ping Tara | 2 | $52,675 | 163 | 4.78/5.0 |
| Anastasia | 1 | $45,027 | 94 | 4.80/5.0 |
| Sébastien | 1 | $42,873 | 43 | 4.84/5.0 |
| Jamjuree | 1 | $33,096 | 12 | 4.58/5.0 |
| Aree And Krisana | 1 | $32,950 | 132 | 4.95/5.0 |
| Ball | 1 | $31,505 | 55 | 4.78/5.0 |
| มลฤดี | 1 | $28,884 | 5 | 5.00/5.0 |
| Ravipa | 1 | $17,969 | 6 | 4.83/5.0 |
Analyzing the strategies of top hosts, such as their property selection, pricing, and guest communication, can offer valuable lessons for optimizing your own Airbnb operations in Ban Khlong Son.
Dive Deeper: Advanced Ban Khlong Son STR Market Data (2025)
Ready to unlock more insights? AirROI provides access to advanced metrics and comprehensive Airbnb data for Ban Khlong Son. Explore detailed analytics beyond this report to refine your investment strategy, optimize pricing, and maximize your vacation rental profits.
Explore Advanced MetricsBan Khlong Son Short-Term Rental Market Composition (2025): Property & Room Types
Room Type Distribution
Property Type Distribution
Market Composition Insights for Ban Khlong Son
- The Ban Khlong Son Airbnb market composition is heavily skewed towards Entire Home/Apt listings, which make up 77.4% of the 31 active rentals. This indicates strong guest preference for privacy and space.
- Looking at the property type distribution in Ban Khlong Son, House properties are the most common (77.4%), reflecting the local real estate landscape.
- Houses represent a significant 77.4% portion, catering likely to families or larger groups.
- Smaller segments like hotel/boutique (combined 3.2%) offer potential for unique stay experiences.
Ban Khlong Son Airbnb Room Capacity Analysis (2025): Bedroom Distribution
Distribution of Listings by Number of Bedrooms
Room Capacity Insights for Ban Khlong Son
- The dominant room capacity in Ban Khlong Son is 1 bedroom listings, making up 29% of the market. This suggests a strong demand for properties suitable for couples or solo travelers.
- Together, 1 bedroom and 2 bedrooms properties represent 51.6% of the active Airbnb listings in Ban Khlong Son, indicating a high concentration in these sizes.
- A significant 45.2% of listings offer 3+ bedrooms, catering to larger groups and families seeking more space in Ban Khlong Son.
Ban Khlong Son Vacation Rental Guest Capacity Trends (2025)
Distribution of Listings by Guest Capacity
Guest Capacity Insights for Ban Khlong Son
- The most common guest capacity trend in Ban Khlong Son vacation rentals is listings accommodating 2 guests (32.3%). This suggests the primary traveler segment is likely couples or solo travelers.
- Properties designed for 2 guests and 8+ guests dominate the Ban Khlong Son STR market, accounting for 64.6% of listings.
- 45.2% of properties accommodate 6+ guests, serving the market segment for larger families or group travel in Ban Khlong Son.
- On average, properties in Ban Khlong Son are equipped to host 4.9 guests.
Ban Khlong Son Airbnb Booking Patterns (2025): Available vs. Booked Days
Available Days Distribution
Booked Days Distribution
Booking Pattern Insights for Ban Khlong Son
- The most common availability pattern in Ban Khlong Son falls within the 271-366 days range, representing 61.3% of listings. This suggests many properties have significant open periods on their calendars.
- Approximately 83.9% of listings show high availability (181+ days open annually), indicating potential for increased bookings or specific owner usage patterns.
- For booked days, the 31-90 days range is most frequent in Ban Khlong Son (32.3%), reflecting common guest stay durations or potential owner blocking patterns.
- A notable 16.1% of properties secure long booking periods (181+ days booked per year), highlighting successful long-term rental strategies or significant owner usage.
Ban Khlong Son Airbnb Minimum Stay Requirements Analysis
Distribution of Listings by Minimum Night Requirement
1 Night
11 listings
36.7% of total
2 Nights
10 listings
33.3% of total
3 Nights
5 listings
16.7% of total
30+ Nights
4 listings
13.3% of total
Key Insights
- The most prevalent minimum stay requirement in Ban Khlong Son is 1 Night, adopted by 36.7% of listings. This highlights the market's preference for shorter, flexible bookings.
- A strong majority (70.0%) of the Ban Khlong Son Airbnb data shows acceptance of very short stays (1-2 nights), indicating a dynamic, high-turnover market.
- A significant segment (13.3%) caters to monthly stays (30+ nights) in Ban Khlong Son, pointing to opportunities in the extended-stay market.
Recommendations
- Align with the market by considering a 1 Night minimum stay, as 36.7% of Ban Khlong Son hosts use this setting.
- Explore offering discounts for stays of 30+ nights to attract the 13.3% of the market seeking extended stays.
- Adjust minimum nights based on seasonality – potentially shorter during low season and longer during peak demand periods in Ban Khlong Son.
Ban Khlong Son Airbnb Cancellation Policy Trends Analysis (2025)
Super Strict 60 Days
3 listings
11.1% of total
Flexible
5 listings
18.5% of total
Moderate
5 listings
18.5% of total
Firm
4 listings
14.8% of total
Strict
10 listings
37% of total
Cancellation Policy Insights for Ban Khlong Son
- The prevailing Airbnb cancellation policy trend in Ban Khlong Son is Strict, used by 37% of listings.
- A majority (51.8%) of hosts in Ban Khlong Son utilize Firm or Strict policies, indicating a market where hosts prioritize booking security.
Recommendations for Hosts
- Consider adopting a Strict policy to align with the 37% market standard in Ban Khlong Son.
- With 37% using Strict terms, this is a viable option in Ban Khlong Son, particularly for high-value properties or during peak demand periods.
- Regularly review your cancellation policy against competitors and market demand shifts in Ban Khlong Son.
Ban Khlong Son STR Booking Lead Time Analysis (2025)
Average Booking Lead Time by Month
Booking Lead Time Insights for Ban Khlong Son
- The overall average booking lead time for vacation rentals in Ban Khlong Son is 68 days.
- Guests book furthest in advance for stays during May (average 117 days), likely coinciding with peak travel demand or local events.
- The shortest booking windows occur for stays in September (average 38 days), indicating more last-minute travel plans during this time.
- Seasonally, Spring (97 days avg.) sees the longest lead times, while Summer (50 days avg.) has the shortest, reflecting typical travel planning cycles.
Recommendations for Hosts
- Use the overall average lead time (68 days) as a baseline for your pricing and availability strategy in Ban Khlong Son.
- For May stays, consider implementing length-of-stay discounts or slightly higher rates for bookings made less than 117 days out to capitalize on advance planning.
- Target marketing efforts for the Spring season well in advance (at least 97 days) to capture early planners.
- Monitor your own booking lead times against these Ban Khlong Son averages to identify opportunities for dynamic pricing adjustments.
Popular & Essential Airbnb Amenities in Ban Khlong Son (2025)
Amenity Prevalence
Amenity Insights for Ban Khlong Son
- Essential amenities in Ban Khlong Son that guests expect include: Wifi, Free parking on premises, TV, Air conditioning. Lacking these (any) could significantly impact bookings.
- Popular amenities like Fire extinguisher, Hangers, Essentials are common but not universal. Offering these can provide a competitive edge.
Recommendations for Hosts
- Ensure your listing includes all essential amenities for Ban Khlong Son: Wifi, Free parking on premises, TV, Air conditioning.
- Prioritize adding missing essentials: TV, Air conditioning.
- Consider adding popular differentiators like Fire extinguisher or Hangers to increase appeal.
- Highlight unique or less common amenities you offer (e.g., hot tub, dedicated workspace, EV charger) in your listing description and photos.
- Regularly check competitor amenities in Ban Khlong Son to stay competitive.
Ban Khlong Son Airbnb Guest Demographics & Profile Analysis (2025)
Guest Profile Summary for Ban Khlong Son
- The typical guest profile for Airbnb in Ban Khlong Son consists of predominantly international visitors (97%), with top international origins including United States, typically belonging to the Post-2000s (Gen Z/Alpha) group (50%), primarily speaking English or French.
- Domestic travelers account for 3.4% of guests.
- Key international markets include United Kingdom (15.5%) and United States (12.9%).
- Top languages spoken are English (49.3%) followed by French (9.9%).
- A significant demographic segment is the Post-2000s (Gen Z/Alpha) group, representing 50% of guests.
Recommendations for Hosts
- Focus marketing internationally, particularly towards travelers from United States.
- Tailor amenities and listing descriptions to appeal to the dominant Post-2000s (Gen Z/Alpha) demographic (e.g., highlight fast WiFi, smart home features, local guides).
- Highlight unique local experiences or amenities relevant to the primary guest profile.
- Consider seasonal promotions aligned with peak travel times for key origin markets.
Nearby Short-Term Rental Market Comparison
How does the Ban Khlong Son Airbnb market stack up against its neighbors? Compare key performance metrics like average monthly revenue, ADR, and occupancy rates in surrounding areas to understand the broader regional STR landscape.
| Market | Active Properties | Monthly Revenue | Daily Rate | Avg. Occupancy |
|---|---|---|---|---|
| Ban Khao Pi Lai | 17 | $8,369 | $2002.90 | 25% |
| Pa Khlok | 62 | $5,400 | $753.98 | 34% |
| Baan Thong Po | 125 | $3,330 | $323.13 | 48% |
| Ban Bang Khao | 44 | $3,247 | $421.06 | 39% |
| Baan Taling Ngam | 22 | $2,767 | $406.97 | 34% |
| Haad Klong Jaak | 35 | $2,685 | $263.02 | 45% |
| Baan Thong Krut | 24 | $2,526 | $303.23 | 46% |
| Kamala | 869 | $2,499 | $267.11 | 49% |
| Tong Yang | 59 | $2,147 | $363.67 | 36% |
| Baan Nai Wok | 37 | $2,085 | $189.55 | 57% |