Nong Phueng Airbnb Market Analysis 2025: Short Term Rental Data & Vacation Rental Statistics in Chiang Mai Province, Thailand
Is Airbnb profitable in Nong Phueng in 2025? Explore comprehensive Airbnb analytics for Nong Phueng, Chiang Mai Province, Thailand to uncover income potential. This 2025 STR market report for Nong Phueng, based on AirROI data from April 2024 to March 2025, reveals key trends in the niche market of 26 active listings.
Whether you're considering an Airbnb investment in Nong Phueng, optimizing your existing vacation rental, or exploring rental arbitrage opportunities, understanding the Nong Phueng Airbnb data is crucial. Leveraging the low regulation environment is key to maximizing your short term rental income potential. Let's dive into the specifics.
Key Nong Phueng Airbnb Performance Metrics Overview
Monthly Airbnb Revenue Variations & Income Potential in Nong Phueng (2025)
Understanding the monthly revenue variations for Airbnb listings in Nong Phueng is key to maximizing your short term rental income potential. Seasonality significantly impacts earnings. Our analysis, based on data from the past 12 months, shows that the peak revenue month for STRs in Nong Phueng is typically May, while March often presents the lowest earnings, highlighting opportunities for strategic pricing adjustments during shoulder and low seasons. Explore the typical Airbnb income in Nong Phueng across different performance tiers:
- Best-in-class properties (Top 10%) achieve $4,440+ monthly, often utilizing dynamic pricing and superior guest experiences.
- Strong performing properties (Top 25%) earn $2,208 or more, indicating effective management and desirable locations/amenities.
- Typical properties (Median) generate around $1,079 per month, representing the average market performance.
- Entry-level properties (Bottom 25%) see earnings around $508, often with potential for optimization.
Average Monthly Airbnb Earnings Trend in Nong Phueng
Nong Phueng Airbnb Occupancy Rate Trends (2025)
Maximize your bookings by understanding the Nong Phueng STR occupancy trends. Seasonal demand shifts significantly influence how often properties are booked. Typically, Aprilsees the highest demand (peak season occupancy), while March experiences the lowest (low season). Effective strategies, like adjusting minimum stays or offering promotions, can boost occupancy during slower periods. Here's how different property tiers perform in Nong Phueng:
- Best-in-class properties (Top 10%) achieve 80%+ occupancy, indicating high desirability and potentially optimized availability.
- Strong performing properties (Top 25%) maintain 64% or higher occupancy, suggesting good market fit and guest satisfaction.
- Typical properties (Median) have an occupancy rate around 35%.
- Entry-level properties (Bottom 25%) average 20% occupancy, potentially facing higher vacancy.
Average Monthly Occupancy Rate Trend in Nong Phueng
Average Daily Rate (ADR) Airbnb Trends in Nong Phueng (2025)
Effective short term rental pricing strategy in Nong Phueng involves understanding monthly ADR fluctuations. The Average Daily Rate (ADR) for Airbnb in Nong Phueng typically peaks in October and dips lowest during November. Leveraging Airbnb dynamic pricing tools or strategies based on this seasonality can significantly boost revenue. Here's a look at the typical nightly rates achieved:
- Best-in-class properties (Top 10%) command rates of $253+ per night, often due to premium features or locations.
- Strong performing properties (Top 25%) achieve nightly rates of $168 or more.
- Typical properties (Median) charge around $76 per night.
- Entry-level properties (Bottom 25%) earn around $39 per night.
Average Daily Rate (ADR) Trend by Month in Nong Phueng
Get Live Nong Phueng Market Intelligence 👇

Explore Real-time Analytics
Airbnb Seasonality Analysis & Trends in Nong Phueng (2025)
Peak Season (May, April, January)
- Revenue averages $2,660 per month
- Occupancy rates average 54.9%
- Daily rates average $131
Shoulder Season
- Revenue averages $1,501 per month
- Occupancy maintains around 42.1%
- Daily rates hold near $125
Low Season (March, August, September)
- Revenue drops to average $1,044 per month
- Occupancy decreases to average 31.6%
- Daily rates adjust to average $128
Seasonality Insights for Nong Phueng
- The Airbnb seasonality in Nong Phueng shows highly seasonal trends requiring careful strategy. While the sections above show seasonal averages, it's also insightful to look at the extremes:
- During the high season, the absolute peak month showcases Nong Phueng's highest earning potential, with monthly revenues capable of climbing to $3,038, occupancy reaching a high of 58.4%, and ADRs peaking at $139.
- Conversely, the slowest single month of the year, typically falling within the low season, marks the market's lowest point. In this month, revenue might dip to $842, occupancy could drop to 24.5%, and ADRs may adjust down to $107.
- Understanding both the seasonal averages and these monthly peaks and troughs in revenue, occupancy, and ADR is crucial for maximizing your Airbnb profit potential in Nong Phueng.
Seasonal Strategies for Maximizing Profit
- Peak Season: Maximize revenue through premium pricing and potentially longer minimum stays. Ensure high availability.
- Low Season: Offer competitive pricing, special promotions (e.g., extended stay discounts), and flexible cancellation policies. Target off-season travelers like remote workers or budget-conscious guests.
- Shoulder Seasons: Implement dynamic pricing that balances peak and low rates. Target weekend travelers or specific events. Offer slightly more flexible terms than peak season.
- Regularly analyze your own performance against these Nong Phueng seasonality benchmarks and adjust your pricing and availability strategy accordingly.
Best Areas for Airbnb Investment in Nong Phueng (2025)
Exploring the top neighborhoods for short-term rentals in Nong Phueng? This section highlights key areas, outlining why they are attractive for hosts and guests, along with notable local attractions. Consider these locations based on your target guest profile and investment strategy.
| Neighborhood / Area | Why Host Here? (Target Guests & Appeal) | Key Attractions & Landmarks |
|---|---|---|
| Nong Phueng | A peaceful suburban area near Chiang Mai, ideal for travelers looking for a quiet retreat while still being close to the city. | Chiang Mai Night Safari, Royal Flora Ratchaphruek, Huay Tung Tao Lake, Nong Hoi Market, Wat Phra That Doi Kham |
| Hang Dong | Known for its upscale villas and resorts, popular with expatriates and tourists looking for luxury stays and leisure facilities. | Grand Canyon Chiang Mai, Baan Tawai Village, Khun Chang Khian Waterfall, Buddha Dhatu Stupa, Wat Phra That Doi Kham |
| San Pa Tong | A traditional Thai town that offers a glimpse into local life and culture, appealing to those seeking an authentic experience. | Wat Phra That San Pa Tong, San Pa Tong Market, local coffee shops, Thai cooking schools, Ancient city ruins |
| Sankampaeng | Famous for hot springs and traditional handicrafts, attracting visitors looking for wellness and local artisan products. | Sankampaeng Hot Springs, Bo Sang Umbrella Village, local spas, craft markets, Wat San Khamalleng |
| Doi Saket | A scenic district with temples and mountain views, great for families and travelers who want outdoor activities and relaxation. | Wat Tharabhirom, Doi Saket Hot Springs, local agriculture tours, Cycling routes, mountain trekking |
| Mae Rim | Offers adventure activities and nature experiences, perfect for tourists looking for outdoor fun like zip-lining and elephant encounters. | Elephant Nature Park, Queen Sirikit Botanic Garden, doi Suthep-Pui National Park, Bamboo Rafting, Maesa Waterfall |
| Mueang Chiang Mai | The historic heart of Chiang Mai, filled with temples, markets, and cultural experiences. Ideal for city explorers. | Wat Phra Singh, Chiang Mai Sunday Walking Street, Warorot Market, Tha Phae Gate, Nimmanhaemin Road |
| Fang | A tranquil district known for its breathtaking mountain views and natural beauty, popular among nature lovers and eco-tourists. | Doi Pha Hom Pok National Park, Fang Hot Springs, local hill tribe villages, Bamboo Rafting, Trekking and hiking trails |
Understanding Airbnb License Requirements & STR Laws in Nong Phueng (2025)
While Nong Phueng, Chiang Mai Province, Thailand currently shows low STR regulations, specific Airbnb license requirements might still exist or change. Always verify the latest short term rental regulations and Airbnb license requirements directly with local government authorities for Nong Phueng to ensure full compliance before hosting.
(Source: AirROI data, 2025, finding no licensed listings among those analyzed)
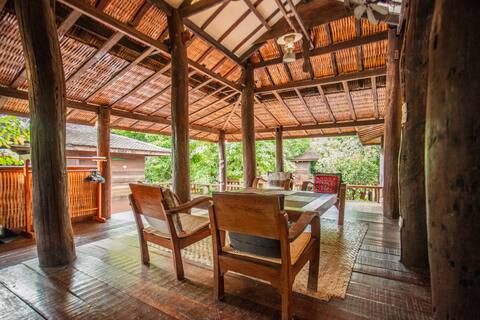
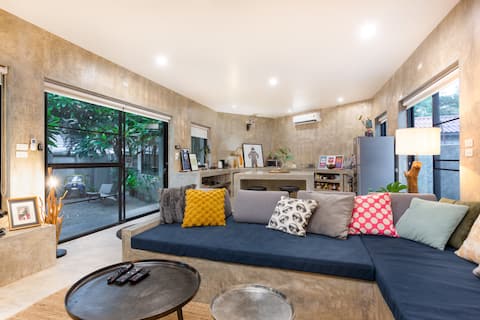
Top Performing Airbnb Properties in Nong Phueng (2025)
Benchmark your potential! Explore examples of top-performing Airbnb properties in Nong Phuengbased on Trailing Twelve Month (TTM) revenue. Analyze their characteristics, revenue, occupancy rate, and ADR to understand what drives success in this market.
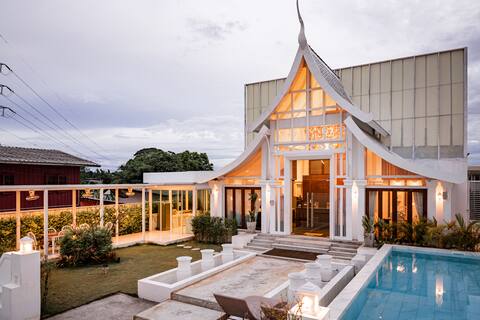
Unique Lanna Style Spa Pool Villa
Entire Place • 5 bedrooms
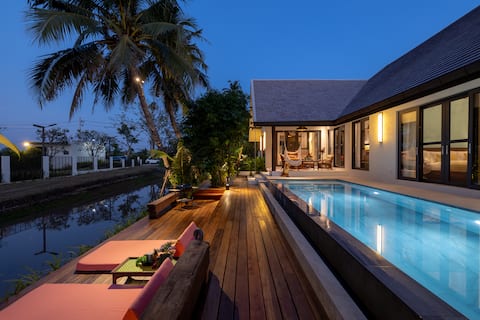
Entire Luxury Private Pool Villa No.8
Entire Place • 4 bedrooms
Entire Place • 3 bedrooms
Artist Villa! Private Pool * Huge Kitchen & Garden
Entire Place • 2 bedrooms
Lanna House (2 Bedroom)
Entire Place • 2 bedrooms

Nice and cozy villa embraced with the nature
Entire Place • 3 bedrooms
Note: Performance varies based on location, size, amenities, seasonality, and management quality. Data reflects the past 12 months.
Top Performing Airbnb Hosts in Nong Phueng (2025)
Learn from the best! This table showcases top-performing Airbnb hosts in Nong Phueng based on the number of properties managed and estimated total revenue over the past year. Analyze their scale and performance metrics.
| Host Name | Properties | Grossing Revenue | Stay Reviews | Avg Rating |
|---|---|---|---|---|
| Lanna | 6 | $71,708 | 205 | 4.94/5.0 |
| Karittha | 1 | $54,260 | 153 | 4.92/5.0 |
| Phimtat | 1 | $50,447 | 5 | 5.00/5.0 |
| Bastian | 1 | $25,912 | 49 | 4.98/5.0 |
| Vatcharat | 1 | $11,702 | 3 | 5.00/5.0 |
| Kanok | 1 | $10,276 | 90 | 4.94/5.0 |
| พิรุณ | 1 | $9,223 | 5 | 5.00/5.0 |
| Host #519064518 | 1 | $7,903 | 1 | 0.00/5.0 |
| Jin Wijanee | 1 | $7,789 | 8 | 5.00/5.0 |
| Host #487502299 | 1 | $7,602 | 38 | 4.97/5.0 |
Analyzing the strategies of top hosts, such as their property selection, pricing, and guest communication, can offer valuable lessons for optimizing your own Airbnb operations in Nong Phueng.
Dive Deeper: Advanced Nong Phueng STR Market Data (2025)
Ready to unlock more insights? AirROI provides access to advanced metrics and comprehensive Airbnb data for Nong Phueng. Explore detailed analytics beyond this report to refine your investment strategy, optimize pricing, and maximize your vacation rental profits.
Explore Advanced MetricsNong Phueng Short-Term Rental Market Composition (2025): Property & Room Types
Room Type Distribution
Property Type Distribution
Market Composition Insights for Nong Phueng
- The Nong Phueng Airbnb market composition is heavily skewed towards Entire Home/Apt listings, which make up 76.9% of the 26 active rentals. This indicates strong guest preference for privacy and space.
- Looking at the property type distribution in Nong Phueng, House properties are the most common (80.8%), reflecting the local real estate landscape.
- Houses represent a significant 80.8% portion, catering likely to families or larger groups.
- Smaller segments like outdoor/unique (combined 3.8%) offer potential for unique stay experiences.
Nong Phueng Airbnb Room Capacity Analysis (2025): Bedroom Distribution
Distribution of Listings by Number of Bedrooms
Room Capacity Insights for Nong Phueng
- The dominant room capacity in Nong Phueng is 1 bedroom listings, making up 23.1% of the market. This suggests a strong demand for properties suitable for couples or solo travelers.
- Together, 1 bedroom and 3 bedrooms properties represent 46.2% of the active Airbnb listings in Nong Phueng, indicating a high concentration in these sizes.
- A significant 50.0% of listings offer 3+ bedrooms, catering to larger groups and families seeking more space in Nong Phueng.
Nong Phueng Vacation Rental Guest Capacity Trends (2025)
Distribution of Listings by Guest Capacity
Guest Capacity Insights for Nong Phueng
- The most common guest capacity trend in Nong Phueng vacation rentals is listings accommodating 8+ guests (26.9%). This suggests the primary traveler segment is likely larger groups.
- Properties designed for 8+ guests and 2 guests dominate the Nong Phueng STR market, accounting for 50.0% of listings.
- 49.9% of properties accommodate 6+ guests, serving the market segment for larger families or group travel in Nong Phueng.
- On average, properties in Nong Phueng are equipped to host 4.7 guests.
Nong Phueng Airbnb Booking Patterns (2025): Available vs. Booked Days
Available Days Distribution
Booked Days Distribution
Booking Pattern Insights for Nong Phueng
- The most common availability pattern in Nong Phueng falls within the 271-366 days range, representing 53.8% of listings. This suggests many properties have significant open periods on their calendars.
- Approximately 92.3% of listings show high availability (181+ days open annually), indicating potential for increased bookings or specific owner usage patterns.
- For booked days, the 91-180 days range is most frequent in Nong Phueng (42.3%), reflecting common guest stay durations or potential owner blocking patterns.
- A notable 7.6% of properties secure long booking periods (181+ days booked per year), highlighting successful long-term rental strategies or significant owner usage.
Nong Phueng Airbnb Minimum Stay Requirements Analysis
Distribution of Listings by Minimum Night Requirement
1 Night
7 listings
30.4% of total
2 Nights
10 listings
43.5% of total
3 Nights
2 listings
8.7% of total
4-6 Nights
2 listings
8.7% of total
30+ Nights
2 listings
8.7% of total
Key Insights
- The most prevalent minimum stay requirement in Nong Phueng is 2 Nights, adopted by 43.5% of listings. This highlights the market's preference for shorter, flexible bookings.
- A strong majority (73.9%) of the Nong Phueng Airbnb data shows acceptance of very short stays (1-2 nights), indicating a dynamic, high-turnover market.
Recommendations
- Align with the market by considering a 2 Nights minimum stay, as 43.5% of Nong Phueng hosts use this setting.
- Explore offering discounts for stays of 30+ nights to attract the 8.7% of the market seeking extended stays.
- Adjust minimum nights based on seasonality – potentially shorter during low season and longer during peak demand periods in Nong Phueng.
Nong Phueng Airbnb Cancellation Policy Trends Analysis (2025)
Flexible
7 listings
38.9% of total
Firm
3 listings
16.7% of total
Strict
8 listings
44.4% of total
Cancellation Policy Insights for Nong Phueng
- The prevailing Airbnb cancellation policy trend in Nong Phueng is Strict, used by 44.4% of listings.
- A majority (61.1%) of hosts in Nong Phueng utilize Firm or Strict policies, indicating a market where hosts prioritize booking security.
Recommendations for Hosts
- Consider adopting a Strict policy to align with the 44.4% market standard in Nong Phueng.
- With 44.4% using Strict terms, this is a viable option in Nong Phueng, particularly for high-value properties or during peak demand periods.
- Regularly review your cancellation policy against competitors and market demand shifts in Nong Phueng.
Nong Phueng STR Booking Lead Time Analysis (2025)
Average Booking Lead Time by Month
Booking Lead Time Insights for Nong Phueng
- The overall average booking lead time for vacation rentals in Nong Phueng is 26 days.
- Guests book furthest in advance for stays during November (average 46 days), likely coinciding with peak travel demand or local events.
- The shortest booking windows occur for stays in June (average 7 days), indicating more last-minute travel plans during this time.
- Seasonally, Winter (37 days avg.) sees the longest lead times, while Spring (19 days avg.) has the shortest, reflecting typical travel planning cycles.
Recommendations for Hosts
- Use the overall average lead time (26 days) as a baseline for your pricing and availability strategy in Nong Phueng.
- For November stays, consider implementing length-of-stay discounts or slightly higher rates for bookings made less than 46 days out to capitalize on advance planning.
- During June, focus on last-minute booking availability and promotions, as guests book with very short notice (7 days avg.).
- Target marketing efforts for the Winter season well in advance (at least 37 days) to capture early planners.
- Monitor your own booking lead times against these Nong Phueng averages to identify opportunities for dynamic pricing adjustments.
Popular & Essential Airbnb Amenities in Nong Phueng (2025)
Amenity Prevalence
Amenity Insights for Nong Phueng
- Essential amenities in Nong Phueng that guests expect include: Free parking on premises, Air conditioning, Essentials. Lacking these (any) could significantly impact bookings.
- Popular amenities like Wifi, Hot water, Bed linens are common but not universal. Offering these can provide a competitive edge.
- Warning: Wifi is not universally provided but is considered essential globally. Ensure reliable Wifi is offered.
Recommendations for Hosts
- Ensure your listing includes all essential amenities for Nong Phueng: Free parking on premises, Air conditioning, Essentials.
- Prioritize adding missing essentials: Essentials.
- Consider adding popular differentiators like Wifi or Hot water to increase appeal.
- Highlight unique or less common amenities you offer (e.g., hot tub, dedicated workspace, EV charger) in your listing description and photos.
- Regularly check competitor amenities in Nong Phueng to stay competitive.
Nong Phueng Airbnb Guest Demographics & Profile Analysis (2025)
Guest Profile Summary for Nong Phueng
- The typical guest profile for Airbnb in Nong Phueng consists of predominantly international visitors (95%), with top international origins including China, typically belonging to the Post-2000s (Gen Z/Alpha) group (50%), primarily speaking English or Chinese.
- Domestic travelers account for 5.4% of guests.
- Key international markets include United States (14.4%) and China (11.7%).
- Top languages spoken are English (44%) followed by Chinese (11.9%).
- A significant demographic segment is the Post-2000s (Gen Z/Alpha) group, representing 50% of guests.
Recommendations for Hosts
- Focus marketing internationally, particularly towards travelers from China.
- Tailor amenities and listing descriptions to appeal to the dominant Post-2000s (Gen Z/Alpha) demographic (e.g., highlight fast WiFi, smart home features, local guides).
- Highlight unique local experiences or amenities relevant to the primary guest profile.
- Consider seasonal promotions aligned with peak travel times for key origin markets.
Nearby Short-Term Rental Market Comparison
How does the Nong Phueng Airbnb market stack up against its neighbors? Compare key performance metrics like average monthly revenue, ADR, and occupancy rates in surrounding areas to understand the broader regional STR landscape.
| Market | Active Properties | Monthly Revenue | Daily Rate | Avg. Occupancy |
|---|---|---|---|---|
| Don Keow Village | 18 | $2,098 | $171.46 | 46% |
| Ban Tong Kai | 10 | $1,750 | $221.37 | 36% |
| Ban Ko Klang | 12 | $1,554 | $173.13 | 36% |
| San Phra Net | 28 | $1,391 | $131.16 | 39% |
| Ban Rong Ruea Kham | 25 | $1,110 | $131.85 | 36% |
| Mae Rim | 15 | $1,066 | $161.70 | 30% |
| Ban Pa Daet Tai | 14 | $1,024 | $136.16 | 40% |
| Chiang Dao | 35 | $963 | $193.13 | 25% |
| Nong Hoi | 235 | $877 | $63.88 | 52% |
| Ban Sai Kham | 34 | $823 | $78.20 | 42% |