Ban Sai Kham Airbnb Market Analysis 2025: Short Term Rental Data & Vacation Rental Statistics in Chiang Mai Province, Thailand
Is Airbnb profitable in Ban Sai Kham in 2025? Explore comprehensive Airbnb analytics for Ban Sai Kham, Chiang Mai Province, Thailand to uncover income potential. This 2025 STR market report for Ban Sai Kham, based on AirROI data from April 2024 to March 2025, reveals key trends in the niche market of 34 active listings.
Whether you're considering an Airbnb investment in Ban Sai Kham, optimizing your existing vacation rental, or exploring rental arbitrage opportunities, understanding the Ban Sai Kham Airbnb data is crucial. Leveraging the low regulation environment is key to maximizing your short term rental income potential. Let's dive into the specifics.
Key Ban Sai Kham Airbnb Performance Metrics Overview
Monthly Airbnb Revenue Variations & Income Potential in Ban Sai Kham (2025)
Understanding the monthly revenue variations for Airbnb listings in Ban Sai Kham is key to maximizing your short term rental income potential. Seasonality significantly impacts earnings. Our analysis, based on data from the past 12 months, shows that the peak revenue month for STRs in Ban Sai Kham is typically January, while October often presents the lowest earnings, highlighting opportunities for strategic pricing adjustments during shoulder and low seasons. Explore the typical Airbnb income in Ban Sai Kham across different performance tiers:
- Best-in-class properties (Top 10%) achieve $2,764+ monthly, often utilizing dynamic pricing and superior guest experiences.
- Strong performing properties (Top 25%) earn $1,285 or more, indicating effective management and desirable locations/amenities.
- Typical properties (Median) generate around $568 per month, representing the average market performance.
- Entry-level properties (Bottom 25%) see earnings around $207, often with potential for optimization.
Average Monthly Airbnb Earnings Trend in Ban Sai Kham
Ban Sai Kham Airbnb Occupancy Rate Trends (2025)
Maximize your bookings by understanding the Ban Sai Kham STR occupancy trends. Seasonal demand shifts significantly influence how often properties are booked. Typically, Januarysees the highest demand (peak season occupancy), while June experiences the lowest (low season). Effective strategies, like adjusting minimum stays or offering promotions, can boost occupancy during slower periods. Here's how different property tiers perform in Ban Sai Kham:
- Best-in-class properties (Top 10%) achieve 81%+ occupancy, indicating high desirability and potentially optimized availability.
- Strong performing properties (Top 25%) maintain 64% or higher occupancy, suggesting good market fit and guest satisfaction.
- Typical properties (Median) have an occupancy rate around 35%.
- Entry-level properties (Bottom 25%) average 19% occupancy, potentially facing higher vacancy.
Average Monthly Occupancy Rate Trend in Ban Sai Kham
Average Daily Rate (ADR) Airbnb Trends in Ban Sai Kham (2025)
Effective short term rental pricing strategy in Ban Sai Kham involves understanding monthly ADR fluctuations. The Average Daily Rate (ADR) for Airbnb in Ban Sai Kham typically peaks in January and dips lowest during November. Leveraging Airbnb dynamic pricing tools or strategies based on this seasonality can significantly boost revenue. Here's a look at the typical nightly rates achieved:
- Best-in-class properties (Top 10%) command rates of $167+ per night, often due to premium features or locations.
- Strong performing properties (Top 25%) achieve nightly rates of $74 or more.
- Typical properties (Median) charge around $36 per night.
- Entry-level properties (Bottom 25%) earn around $20 per night.
Average Daily Rate (ADR) Trend by Month in Ban Sai Kham
Get Live Ban Sai Kham Market Intelligence 👇

Explore Real-time Analytics
Airbnb Seasonality Analysis & Trends in Ban Sai Kham (2025)
Peak Season (January, July, December)
- Revenue averages $1,603 per month
- Occupancy rates average 49.9%
- Daily rates average $81
Shoulder Season
- Revenue averages $1,091 per month
- Occupancy maintains around 37.7%
- Daily rates hold near $80
Low Season (August, September, October)
- Revenue drops to average $715 per month
- Occupancy decreases to average 39.7%
- Daily rates adjust to average $77
Seasonality Insights for Ban Sai Kham
- The Airbnb seasonality in Ban Sai Kham shows highly seasonal trends requiring careful strategy. While the sections above show seasonal averages, it's also insightful to look at the extremes:
- During the high season, the absolute peak month showcases Ban Sai Kham's highest earning potential, with monthly revenues capable of climbing to $1,841, occupancy reaching a high of 56.1%, and ADRs peaking at $84.
- Conversely, the slowest single month of the year, typically falling within the low season, marks the market's lowest point. In this month, revenue might dip to $659, occupancy could drop to 31.8%, and ADRs may adjust down to $75.
- Understanding both the seasonal averages and these monthly peaks and troughs in revenue, occupancy, and ADR is crucial for maximizing your Airbnb profit potential in Ban Sai Kham.
Seasonal Strategies for Maximizing Profit
- Peak Season: Maximize revenue through premium pricing and potentially longer minimum stays. Ensure high availability.
- Low Season: Offer competitive pricing, special promotions (e.g., extended stay discounts), and flexible cancellation policies. Target off-season travelers like remote workers or budget-conscious guests.
- Shoulder Seasons: Implement dynamic pricing that balances peak and low rates. Target weekend travelers or specific events. Offer slightly more flexible terms than peak season.
- Regularly analyze your own performance against these Ban Sai Kham seasonality benchmarks and adjust your pricing and availability strategy accordingly.
Best Areas for Airbnb Investment in Ban Sai Kham (2025)
Exploring the top neighborhoods for short-term rentals in Ban Sai Kham? This section highlights key areas, outlining why they are attractive for hosts and guests, along with notable local attractions. Consider these locations based on your target guest profile and investment strategy.
| Neighborhood / Area | Why Host Here? (Target Guests & Appeal) | Key Attractions & Landmarks |
|---|---|---|
| Old City | Historic heart of Chiang Mai, known for its ancient temples and cultural heritage. Attracts tourists interested in exploring Thai history and architecture. | Wat Phra Singh, Wat Chedi Luang, Chiang Mai City Arts & Cultural Centre, Three Kings Monument, Sunday Walking Street Market |
| Nimmanhaemin | Trendy neighborhood popular among young travelers and digital nomads, with a vibrant cafe culture and accessible nightlife. Great for those seeking a modern Chiang Mai experience. | Nimmanhaemin Road cafes, MAYA Lifestyle Shopping Center, One Nimman, Chiang Mai University Art Center, Art and cultural galleries |
| Doi Suthep | Famous for the iconic Wat Phra That Doi Suthep and incredible views over the city. Ideal for visitors looking for a mix of nature and spirituality. | Wat Phra That Doi Suthep, Doi Suthep-Pui National Park, Hiking trails, Local markets, Nature viewpoints |
| Huay Kaew | A beautiful area known for its natural scenery, waterfalls, and proximity to both the city and mountain activities. Perfect for eco-tourism enthusiasts. | Huay Kaew Waterfall, Chiang Mai Zoo, Art in Paradise, Royal Park Rajapruek, Temples nearby |
| Chang Phueak | A residential and developing area with a local vibe, increasingly popular among expats and families. Offers a more laid-back atmosphere. | Chang Phueak Market, Wat Umong, Nong Hoi Market, local parks, community events |
| Suthep | Nestled near the mountains with historical significance, it's a peaceful area attracting those looking for quiet retreats. | Queen Sirikit Botanical Garden, Doi Suthep National Park, Local temples, Scenic viewpoints, Cultural activities |
| Night Bazaar | Busy marketplace and a hub for shopping and nightlife. Attracts tourists looking for a vibrant atmosphere and local crafts. | Night Bazaar, Chiang Mai Night Market, Street food stalls, Artisans' workshops, Cultural performances |
| Pa Tan | Emerging neighborhood with lower property costs and a growing number of amenities. Attractive for investors seeking value in Chiang Mai's market. | Local eateries, Community parks, Upcoming shopping centers, Cultural sites, Relaxed atmosphere |
Understanding Airbnb License Requirements & STR Laws in Ban Sai Kham (2025)
While Ban Sai Kham, Chiang Mai Province, Thailand currently shows low STR regulations, specific Airbnb license requirements might still exist or change. Always verify the latest short term rental regulations and Airbnb license requirements directly with local government authorities for Ban Sai Kham to ensure full compliance before hosting.
(Source: AirROI data, 2025, finding no licensed listings among those analyzed)
Top Performing Airbnb Properties in Ban Sai Kham (2025)
Benchmark your potential! Explore examples of top-performing Airbnb properties in Ban Sai Khambased on Trailing Twelve Month (TTM) revenue. Analyze their characteristics, revenue, occupancy rate, and ADR to understand what drives success in this market.
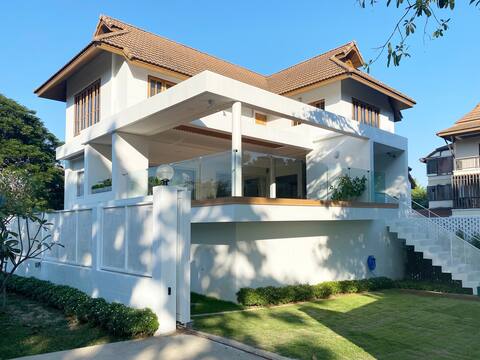
Tammy White House | hillside modern luxury home
Entire Place • 3 bedrooms
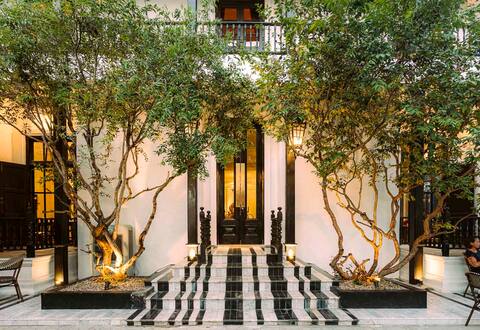
Spacious Designer Pool Villa | with Maid Service
Entire Place • 8 bedrooms
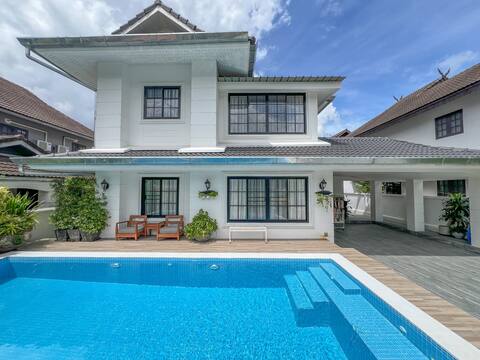
3 ️⁕️ 3 ® 5 BR Luxury Pool Villa in Chiang Mai & Book 3 Nights from Matching Pickup & Chinese Butler
Entire Place • 5 bedrooms
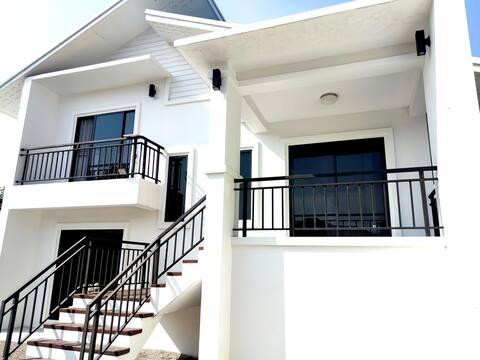
3 bedrooms wholehouse near Nimman : U Yen hometel
Entire Place • 3 bedrooms
Chiangmai Boutique Pool Villa
Entire Place • 1 bedroom
Mountain View House with Pool
Entire Place • 2 bedrooms
Note: Performance varies based on location, size, amenities, seasonality, and management quality. Data reflects the past 12 months.
Top Performing Airbnb Hosts in Ban Sai Kham (2025)
Learn from the best! This table showcases top-performing Airbnb hosts in Ban Sai Kham based on the number of properties managed and estimated total revenue over the past year. Analyze their scale and performance metrics.
| Host Name | Properties | Grossing Revenue | Stay Reviews | Avg Rating |
|---|---|---|---|---|
| Phatthida | 1 | $63,331 | 68 | 5.00/5.0 |
| Alex | 1 | $42,752 | 20 | 4.90/5.0 |
| Kchan | 1 | $39,474 | 12 | 5.00/5.0 |
| Kititouch | 1 | $23,096 | 15 | 4.87/5.0 |
| Nanthiya | 2 | $21,114 | 121 | 4.97/5.0 |
| Host #501195857 | 1 | $20,715 | 83 | 4.71/5.0 |
| Sarinthip | 2 | $18,897 | 330 | 4.84/5.0 |
| Suratda | 1 | $16,363 | 44 | 4.95/5.0 |
| Za | 1 | $16,136 | 8 | 4.88/5.0 |
| Host #6972682 | 2 | $11,135 | 2 | 0.00/5.0 |
Analyzing the strategies of top hosts, such as their property selection, pricing, and guest communication, can offer valuable lessons for optimizing your own Airbnb operations in Ban Sai Kham.
Dive Deeper: Advanced Ban Sai Kham STR Market Data (2025)
Ready to unlock more insights? AirROI provides access to advanced metrics and comprehensive Airbnb data for Ban Sai Kham. Explore detailed analytics beyond this report to refine your investment strategy, optimize pricing, and maximize your vacation rental profits.
Explore Advanced MetricsBan Sai Kham Short-Term Rental Market Composition (2025): Property & Room Types
Room Type Distribution
Property Type Distribution
Market Composition Insights for Ban Sai Kham
- The Ban Sai Kham Airbnb market composition is heavily skewed towards Entire Home/Apt listings, which make up 55.9% of the 34 active rentals. This indicates strong guest preference for privacy and space.
- However, a notable 44.1% share for Private Rooms suggests opportunities for budget-conscious travelers or hosts renting out spare rooms.
- Looking at the property type distribution in Ban Sai Kham, House properties are the most common (55.9%), reflecting the local real estate landscape.
- Houses represent a significant 55.9% portion, catering likely to families or larger groups.
- The presence of 5.9% Hotel/Boutique listings indicates integration with traditional hospitality.
Ban Sai Kham Airbnb Room Capacity Analysis (2025): Bedroom Distribution
Distribution of Listings by Number of Bedrooms
Room Capacity Insights for Ban Sai Kham
- The dominant room capacity in Ban Sai Kham is 1 bedroom listings, making up 50% of the market. This suggests a strong demand for properties suitable for couples or solo travelers.
- Together, 1 bedroom and 2 bedrooms properties represent 64.7% of the active Airbnb listings in Ban Sai Kham, indicating a high concentration in these sizes.
Ban Sai Kham Vacation Rental Guest Capacity Trends (2025)
Distribution of Listings by Guest Capacity
Guest Capacity Insights for Ban Sai Kham
- The most common guest capacity trend in Ban Sai Kham vacation rentals is listings accommodating 2 guests (44.1%). This suggests the primary traveler segment is likely couples or solo travelers.
- Properties designed for 2 guests and 8+ guests dominate the Ban Sai Kham STR market, accounting for 58.8% of listings.
- A significant 44.1% of listings cater specifically to 1-2 guests, highlighting strong demand from couples and solo travelers in Ban Sai Kham.
- 17.6% of properties accommodate 6+ guests, serving the market segment for larger families or group travel in Ban Sai Kham.
- On average, properties in Ban Sai Kham are equipped to host 3.1 guests.
Ban Sai Kham Airbnb Booking Patterns (2025): Available vs. Booked Days
Available Days Distribution
Booked Days Distribution
Booking Pattern Insights for Ban Sai Kham
- The most common availability pattern in Ban Sai Kham falls within the 271-366 days range, representing 50% of listings. This suggests many properties have significant open periods on their calendars.
- Approximately 64.7% of listings show high availability (181+ days open annually), indicating potential for increased bookings or specific owner usage patterns.
- For booked days, the 31-90 days range is most frequent in Ban Sai Kham (35.3%), reflecting common guest stay durations or potential owner blocking patterns.
- A notable 35.3% of properties secure long booking periods (181+ days booked per year), highlighting successful long-term rental strategies or significant owner usage.
Ban Sai Kham Airbnb Minimum Stay Requirements Analysis
Distribution of Listings by Minimum Night Requirement
1 Night
16 listings
50% of total
2 Nights
7 listings
21.9% of total
3 Nights
2 listings
6.3% of total
4-6 Nights
2 listings
6.3% of total
30+ Nights
5 listings
15.6% of total
Key Insights
- The most prevalent minimum stay requirement in Ban Sai Kham is 1 Night, adopted by 50% of listings. This highlights the market's preference for shorter, flexible bookings.
- A strong majority (71.9%) of the Ban Sai Kham Airbnb data shows acceptance of very short stays (1-2 nights), indicating a dynamic, high-turnover market.
- A significant segment (15.6%) caters to monthly stays (30+ nights) in Ban Sai Kham, pointing to opportunities in the extended-stay market.
Recommendations
- Align with the market by considering a 1 Night minimum stay, as 50% of Ban Sai Kham hosts use this setting.
- Explore offering discounts for stays of 30+ nights to attract the 15.6% of the market seeking extended stays.
- Adjust minimum nights based on seasonality – potentially shorter during low season and longer during peak demand periods in Ban Sai Kham.
Ban Sai Kham Airbnb Cancellation Policy Trends Analysis (2025)
Flexible
7 listings
29.2% of total
Moderate
7 listings
29.2% of total
Firm
5 listings
20.8% of total
Strict
5 listings
20.8% of total
Cancellation Policy Insights for Ban Sai Kham
- The prevailing Airbnb cancellation policy trend in Ban Sai Kham is Flexible, used by 29.2% of listings.
- There's a relatively balanced mix between guest-friendly (58.4%) and stricter (41.6%) policies, offering choices for different guest needs.
Recommendations for Hosts
- Consider adopting a Flexible policy to align with the 29.2% market standard in Ban Sai Kham.
- Regularly review your cancellation policy against competitors and market demand shifts in Ban Sai Kham.
Ban Sai Kham STR Booking Lead Time Analysis (2025)
Average Booking Lead Time by Month
Booking Lead Time Insights for Ban Sai Kham
- The overall average booking lead time for vacation rentals in Ban Sai Kham is 30 days.
- Guests book furthest in advance for stays during February (average 60 days), likely coinciding with peak travel demand or local events.
- The shortest booking windows occur for stays in March (average 24 days), indicating more last-minute travel plans during this time.
- Seasonally, Winter (49 days avg.) sees the longest lead times, while Summer (32 days avg.) has the shortest, reflecting typical travel planning cycles.
Recommendations for Hosts
- Use the overall average lead time (30 days) as a baseline for your pricing and availability strategy in Ban Sai Kham.
- For February stays, consider implementing length-of-stay discounts or slightly higher rates for bookings made less than 60 days out to capitalize on advance planning.
- Target marketing efforts for the Winter season well in advance (at least 49 days) to capture early planners.
- Monitor your own booking lead times against these Ban Sai Kham averages to identify opportunities for dynamic pricing adjustments.
Popular & Essential Airbnb Amenities in Ban Sai Kham (2025)
Amenity Prevalence
Amenity Insights for Ban Sai Kham
- Essential amenities in Ban Sai Kham that guests expect include: Air conditioning, Wifi. Lacking these (any) could significantly impact bookings.
- Popular amenities like Free parking on premises, Essentials, Kitchen are common but not universal. Offering these can provide a competitive edge.
Recommendations for Hosts
- Ensure your listing includes all essential amenities for Ban Sai Kham: Air conditioning, Wifi.
- Prioritize adding missing essentials: Wifi.
- Consider adding popular differentiators like Free parking on premises or Essentials to increase appeal.
- Highlight unique or less common amenities you offer (e.g., hot tub, dedicated workspace, EV charger) in your listing description and photos.
- Regularly check competitor amenities in Ban Sai Kham to stay competitive.
Ban Sai Kham Airbnb Guest Demographics & Profile Analysis (2025)
Guest Profile Summary for Ban Sai Kham
- The typical guest profile for Airbnb in Ban Sai Kham consists of predominantly international visitors (95%), with top international origins including United States, typically belonging to the Post-2000s (Gen Z/Alpha) group (50%), primarily speaking English or Chinese.
- Domestic travelers account for 5.4% of guests.
- Key international markets include China (19.5%) and United States (12.2%).
- Top languages spoken are English (49.2%) followed by Chinese (15.2%).
- A significant demographic segment is the Post-2000s (Gen Z/Alpha) group, representing 50% of guests.
Recommendations for Hosts
- Focus marketing internationally, particularly towards travelers from United States.
- Tailor amenities and listing descriptions to appeal to the dominant Post-2000s (Gen Z/Alpha) demographic (e.g., highlight fast WiFi, smart home features, local guides).
- Highlight unique local experiences or amenities relevant to the primary guest profile.
- Consider seasonal promotions aligned with peak travel times for key origin markets.
Nearby Short-Term Rental Market Comparison
How does the Ban Sai Kham Airbnb market stack up against its neighbors? Compare key performance metrics like average monthly revenue, ADR, and occupancy rates in surrounding areas to understand the broader regional STR landscape.
| Market | Active Properties | Monthly Revenue | Daily Rate | Avg. Occupancy |
|---|---|---|---|---|
| Don Keow Village | 18 | $2,098 | $171.46 | 46% |
| Ban Tong Kai | 10 | $1,750 | $221.37 | 36% |
| Ban Ko Klang | 12 | $1,554 | $173.13 | 36% |
| San Phra Net | 28 | $1,391 | $131.16 | 39% |
| Ban Rong Ruea Kham | 25 | $1,110 | $131.85 | 36% |
| Mae Rim | 15 | $1,066 | $161.70 | 30% |
| Ban Pa Daet Tai | 14 | $1,024 | $136.16 | 40% |
| Chiang Dao | 35 | $963 | $193.13 | 25% |
| Nong Phueng | 26 | $891 | $100.46 | 41% |
| Nong Hoi | 235 | $877 | $63.88 | 52% |