Buri Ram Airbnb Market Analysis 2025: Short Term Rental Data & Vacation Rental Statistics in Buri Ram Province, Thailand
Is Airbnb profitable in Buri Ram in 2025? Explore comprehensive Airbnb analytics for Buri Ram, Buri Ram Province, Thailand to uncover income potential. This 2025 STR market report for Buri Ram, based on AirROI data from April 2024 to March 2025, reveals key trends in the niche market of 25 active listings.
Whether you're considering an Airbnb investment in Buri Ram, optimizing your existing vacation rental, or exploring rental arbitrage opportunities, understanding the Buri Ram Airbnb data is crucial. Leveraging the low regulation environment is key to maximizing your short term rental income potential. Let's dive into the specifics.
Key Buri Ram Airbnb Performance Metrics Overview
Monthly Airbnb Revenue Variations & Income Potential in Buri Ram (2025)
Understanding the monthly revenue variations for Airbnb listings in Buri Ram is key to maximizing your short term rental income potential. Seasonality significantly impacts earnings. Our analysis, based on data from the past 12 months, shows that the peak revenue month for STRs in Buri Ram is typically December, while April often presents the lowest earnings, highlighting opportunities for strategic pricing adjustments during shoulder and low seasons. Explore the typical Airbnb income in Buri Ram across different performance tiers:
- Best-in-class properties (Top 10%) achieve $863+ monthly, often utilizing dynamic pricing and superior guest experiences.
- Strong performing properties (Top 25%) earn $354 or more, indicating effective management and desirable locations/amenities.
- Typical properties (Median) generate around $179 per month, representing the average market performance.
- Entry-level properties (Bottom 25%) see earnings around $113, often with potential for optimization.
Average Monthly Airbnb Earnings Trend in Buri Ram
Buri Ram Airbnb Occupancy Rate Trends (2025)
Maximize your bookings by understanding the Buri Ram STR occupancy trends. Seasonal demand shifts significantly influence how often properties are booked. Typically, Maysees the highest demand (peak season occupancy), while June experiences the lowest (low season). Effective strategies, like adjusting minimum stays or offering promotions, can boost occupancy during slower periods. Here's how different property tiers perform in Buri Ram:
- Best-in-class properties (Top 10%) achieve 40%+ occupancy, indicating high desirability and potentially optimized availability.
- Strong performing properties (Top 25%) maintain 28% or higher occupancy, suggesting good market fit and guest satisfaction.
- Typical properties (Median) have an occupancy rate around 19%.
- Entry-level properties (Bottom 25%) average 14% occupancy, potentially facing higher vacancy.
Average Monthly Occupancy Rate Trend in Buri Ram
Average Daily Rate (ADR) Airbnb Trends in Buri Ram (2025)
Effective short term rental pricing strategy in Buri Ram involves understanding monthly ADR fluctuations. The Average Daily Rate (ADR) for Airbnb in Buri Ram typically peaks in March and dips lowest during August. Leveraging Airbnb dynamic pricing tools or strategies based on this seasonality can significantly boost revenue. Here's a look at the typical nightly rates achieved:
- Best-in-class properties (Top 10%) command rates of $180+ per night, often due to premium features or locations.
- Strong performing properties (Top 25%) achieve nightly rates of $90 or more.
- Typical properties (Median) charge around $45 per night.
- Entry-level properties (Bottom 25%) earn around $25 per night.
Average Daily Rate (ADR) Trend by Month in Buri Ram
Get Live Buri Ram Market Intelligence 👇

Explore Real-time Analytics
Airbnb Seasonality Analysis & Trends in Buri Ram (2025)
Peak Season (December, May, September)
- Revenue averages $654 per month
- Occupancy rates average 50.6%
- Daily rates average $67
Shoulder Season
- Revenue averages $286 per month
- Occupancy maintains around 14.6%
- Daily rates hold near $73
Low Season (February, April, November)
- Revenue drops to average $151 per month
- Occupancy decreases to average 12.9%
- Daily rates adjust to average $74
Seasonality Insights for Buri Ram
- The Airbnb seasonality in Buri Ram shows highly seasonal trends requiring careful strategy. While the sections above show seasonal averages, it's also insightful to look at the extremes:
- During the high season, the absolute peak month showcases Buri Ram's highest earning potential, with monthly revenues capable of climbing to $1,095, occupancy reaching a high of 90.3%, and ADRs peaking at $95.
- Conversely, the slowest single month of the year, typically falling within the low season, marks the market's lowest point. In this month, revenue might dip to $48, occupancy could drop to 5.0%, and ADRs may adjust down to $62.
- Understanding both the seasonal averages and these monthly peaks and troughs in revenue, occupancy, and ADR is crucial for maximizing your Airbnb profit potential in Buri Ram.
Seasonal Strategies for Maximizing Profit
- Peak Season: Maximize revenue through premium pricing and potentially longer minimum stays. Ensure high availability.
- Low Season: Offer competitive pricing, special promotions (e.g., extended stay discounts), and flexible cancellation policies. Target off-season travelers like remote workers or budget-conscious guests.
- Shoulder Seasons: Implement dynamic pricing that balances peak and low rates. Target weekend travelers or specific events. Offer slightly more flexible terms than peak season.
- Regularly analyze your own performance against these Buri Ram seasonality benchmarks and adjust your pricing and availability strategy accordingly.
Best Areas for Airbnb Investment in Buri Ram (2025)
Exploring the top neighborhoods for short-term rentals in Buri Ram? This section highlights key areas, outlining why they are attractive for hosts and guests, along with notable local attractions. Consider these locations based on your target guest profile and investment strategy.
| Neighborhood / Area | Why Host Here? (Target Guests & Appeal) | Key Attractions & Landmarks |
|---|---|---|
| City Center Buri Ram | The heart of Buri Ram, bustling with local markets, restaurants, and cultural sites. Ideal for guests looking to experience the local lifestyle and access attractions easily. | Buri Ram Castle, New Buri Ram Hospital, Robinson Lifestyle Buri Ram, Buri Ram Night Market, Nong Ki Waterfall |
| Phanom Rung Historical Park | A fascinating archaeological site located a bit outside the city, it attracts tourists who are interested in history and culture. Perfect for guests wanting to explore ancient Khmer architecture. | Phanom Rung Historical Park, Phanom Rung National Park, Hin Chang Si Waterfall, Khao Phanom Rung |
| Buriram United Football Club | Home of Thailand's top football club, this area is vibrant during match days and attracts sports fans. Great for those who want to enjoy the local sports culture. | Buriram United Stadium, Chang Arena, Football matches, Local sports events |
| Khao Kradong Forest Park | A beautiful natural area with scenic views and outdoor activities. Ideal for nature lovers and those looking for a getaway close to nature. | Khao Kradong, Khao Kradong Forest Park, Running trails, Scenic viewpoints |
| Wat Phu Khao Thong | An important Buddhist temple in the region, attracting visitors interested in spirituality and local culture. A peaceful area for guests seeking tranquility. | Wat Phu Khao Thong, Local festivals, Temple fairs |
| Buri Ram Night Market | A lively night market offering local foods, crafts, and entertainment. Perfect for guests who want to experience local cuisine and culture. | Food stalls, Local crafts, Live music, Cultural shows |
| Surin Province (nearby) | Known for its elephants and silk, it's a quick trip from Buri Ram. Ideal for guests looking to explore the more rural and traditional aspects of Thai culture. | Surin Elephant Round-up, Surin Silk Village, Local handicrafts |
| Son Khwa Market | A well-known local market that offers a taste of daily life in Buri Ram. Great for tourists who want to dive into the local community and find unique souvenirs. | Fresh produce, Local street food, Cultural interactions, Shopping for souvenirs |
Understanding Airbnb License Requirements & STR Laws in Buri Ram (2025)
While Buri Ram, Buri Ram Province, Thailand currently shows low STR regulations, specific Airbnb license requirements might still exist or change. Always verify the latest short term rental regulations and Airbnb license requirements directly with local government authorities for Buri Ram to ensure full compliance before hosting.
(Source: AirROI data, 2025, based on 4% licensed listings)
Top Performing Airbnb Properties in Buri Ram (2025)
Benchmark your potential! Explore examples of top-performing Airbnb properties in Buri Rambased on Trailing Twelve Month (TTM) revenue. Analyze their characteristics, revenue, occupancy rate, and ADR to understand what drives success in this market.

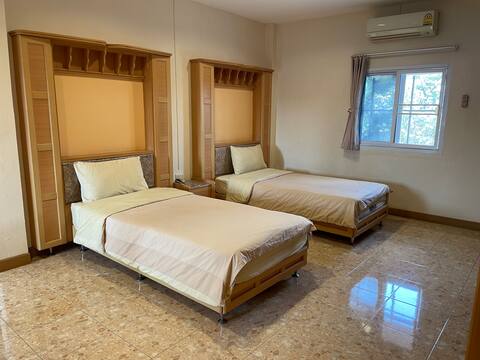
Gated Community (15 mins to MotoGP) Entire House.
Entire Place • 3 bedrooms

Cozy home with nice garden.
Entire Place • 3 bedrooms

บ้าน Home hug บุรีรัมย์
Entire Place • 3 bedrooms
Ploy resort
Private Room • 1 bedroom
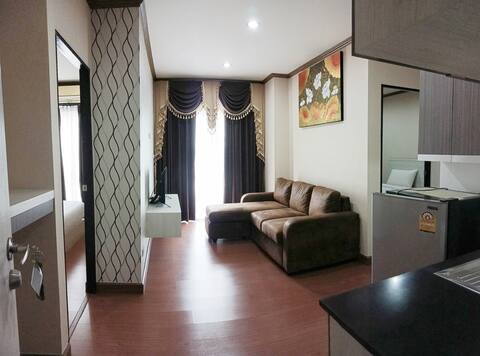
Cozy Suite Room with furnished
Entire Place • 2 bedrooms
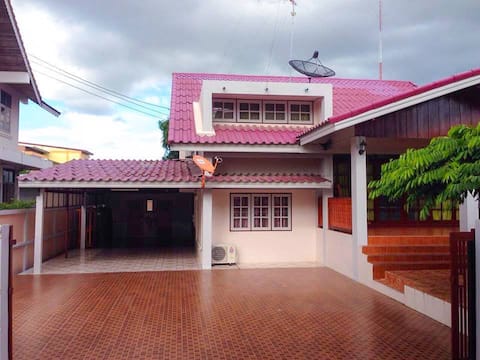
ฺBuriram The Big house, 3 bedrooms, 3 bathrooms
Entire Place • 3 bedrooms
Note: Performance varies based on location, size, amenities, seasonality, and management quality. Data reflects the past 12 months.
Top Performing Airbnb Hosts in Buri Ram (2025)
Learn from the best! This table showcases top-performing Airbnb hosts in Buri Ram based on the number of properties managed and estimated total revenue over the past year. Analyze their scale and performance metrics.
| Host Name | Properties | Grossing Revenue | Stay Reviews | Avg Rating |
|---|---|---|---|---|
| Napapat | 1 | $12,352 | 7 | 5.00/5.0 |
| Alexio Dararuang | 4 | $5,769 | 7 | 2.33/5.0 |
| Host #201050006 | 6 | $5,437 | 0 | 0.00/5.0 |
| Host #134390393 | 1 | $4,128 | 0 | 0.00/5.0 |
| Host #215300293 | 1 | $3,139 | 2 | 0.00/5.0 |
| Host #227905803 | 2 | $1,884 | 1 | 0.00/5.0 |
| Host #186270866 | 6 | $1,457 | 0 | 0.00/5.0 |
| Pattama | 1 | $1,410 | 4 | 5.00/5.0 |
| Ammy | 1 | $1,212 | 6 | 4.67/5.0 |
| Chalotorn | 1 | $860 | 3 | 4.00/5.0 |
Analyzing the strategies of top hosts, such as their property selection, pricing, and guest communication, can offer valuable lessons for optimizing your own Airbnb operations in Buri Ram.
Dive Deeper: Advanced Buri Ram STR Market Data (2025)
Ready to unlock more insights? AirROI provides access to advanced metrics and comprehensive Airbnb data for Buri Ram. Explore detailed analytics beyond this report to refine your investment strategy, optimize pricing, and maximize your vacation rental profits.
Explore Advanced MetricsBuri Ram Short-Term Rental Market Composition (2025): Property & Room Types
Room Type Distribution
Property Type Distribution
Market Composition Insights for Buri Ram
- The Buri Ram Airbnb market composition is heavily skewed towards Private Room listings, which make up 56% of the 25 active rentals. This indicates strong guest preference for privacy and space.
- Looking at the property type distribution in Buri Ram, Hotel/Boutique properties are the most common (48%), reflecting the local real estate landscape.
- Houses represent a significant 36% portion, catering likely to families or larger groups.
- The presence of 48% Hotel/Boutique listings indicates integration with traditional hospitality.
Buri Ram Airbnb Room Capacity Analysis (2025): Bedroom Distribution
Distribution of Listings by Number of Bedrooms
Room Capacity Insights for Buri Ram
- The dominant room capacity in Buri Ram is 1 bedroom listings, making up 60% of the market. This suggests a strong demand for properties suitable for couples or solo travelers.
- Together, 1 bedroom and 3 bedrooms properties represent 80.0% of the active Airbnb listings in Buri Ram, indicating a high concentration in these sizes.
- With over half the market (60%) consisting of studios or 1-bedroom units, Buri Ram is particularly well-suited for individuals or couples.
- A significant 24.0% of listings offer 3+ bedrooms, catering to larger groups and families seeking more space in Buri Ram.
Buri Ram Vacation Rental Guest Capacity Trends (2025)
Distribution of Listings by Guest Capacity
Guest Capacity Insights for Buri Ram
- The most common guest capacity trend in Buri Ram vacation rentals is listings accommodating 2 guests (60%). This suggests the primary traveler segment is likely couples or solo travelers.
- Properties designed for 2 guests and 6 guests dominate the Buri Ram STR market, accounting for 72.0% of listings.
- A significant 60.0% of listings cater specifically to 1-2 guests, highlighting strong demand from couples and solo travelers in Buri Ram.
- 20.0% of properties accommodate 6+ guests, serving the market segment for larger families or group travel in Buri Ram.
- On average, properties in Buri Ram are equipped to host 3.0 guests.
Buri Ram Airbnb Booking Patterns (2025): Available vs. Booked Days
Available Days Distribution
Booked Days Distribution
Booking Pattern Insights for Buri Ram
- The most common availability pattern in Buri Ram falls within the 271-366 days range, representing 100% of listings. This suggests many properties have significant open periods on their calendars.
- Approximately 100.0% of listings show high availability (181+ days open annually), indicating potential for increased bookings or specific owner usage patterns.
- For booked days, the 1-30 days range is most frequent in Buri Ram (72%), reflecting common guest stay durations or potential owner blocking patterns.
Buri Ram Airbnb Minimum Stay Requirements Analysis
Distribution of Listings by Minimum Night Requirement
1 Night
18 listings
72% of total
2 Nights
4 listings
16% of total
3 Nights
1 listings
4% of total
30+ Nights
2 listings
8% of total
Key Insights
- The most prevalent minimum stay requirement in Buri Ram is 1 Night, adopted by 72% of listings. This highlights the market's preference for shorter, flexible bookings.
- A strong majority (88.0%) of the Buri Ram Airbnb data shows acceptance of very short stays (1-2 nights), indicating a dynamic, high-turnover market.
Recommendations
- Align with the market by considering a 1 Night minimum stay, as 72% of Buri Ram hosts use this setting.
- Explore offering discounts for stays of 30+ nights to attract the 8% of the market seeking extended stays.
- Adjust minimum nights based on seasonality – potentially shorter during low season and longer during peak demand periods in Buri Ram.
Buri Ram Airbnb Cancellation Policy Trends Analysis (2025)
Flexible
4 listings
50% of total
Moderate
1 listings
12.5% of total
Firm
1 listings
12.5% of total
Strict
2 listings
25% of total
Cancellation Policy Insights for Buri Ram
- The prevailing Airbnb cancellation policy trend in Buri Ram is Flexible, used by 50% of listings.
- There's a relatively balanced mix between guest-friendly (62.5%) and stricter (37.5%) policies, offering choices for different guest needs.
Recommendations for Hosts
- Consider adopting a Flexible policy to align with the 50% market standard in Buri Ram.
- Regularly review your cancellation policy against competitors and market demand shifts in Buri Ram.
Buri Ram STR Booking Lead Time Analysis (2025)
Average Booking Lead Time by Month
Booking Lead Time Insights for Buri Ram
- The overall average booking lead time for vacation rentals in Buri Ram is 91 days.
- Guests book furthest in advance for stays during March (average 111 days), likely coinciding with peak travel demand or local events.
- The shortest booking windows occur for stays in November (average 0 days), indicating more last-minute travel plans during this time.
- Seasonally, Winter (90 days avg.) sees the longest lead times, while Summer (1 days avg.) has the shortest, reflecting typical travel planning cycles.
Recommendations for Hosts
- Use the overall average lead time (91 days) as a baseline for your pricing and availability strategy in Buri Ram.
- For March stays, consider implementing length-of-stay discounts or slightly higher rates for bookings made less than 111 days out to capitalize on advance planning.
- During November, focus on last-minute booking availability and promotions, as guests book with very short notice (0 days avg.).
- Target marketing efforts for the Winter season well in advance (at least 90 days) to capture early planners.
- Monitor your own booking lead times against these Buri Ram averages to identify opportunities for dynamic pricing adjustments.
Popular & Essential Airbnb Amenities in Buri Ram (2025)
Amenity Prevalence
Amenity Insights for Buri Ram
- Essential amenities in Buri Ram that guests expect include: Air conditioning, Kitchen. Lacking these (any) could significantly impact bookings.
- Popular amenities like Hot water, Essentials, TV are common but not universal. Offering these can provide a competitive edge.
- Warning: Wifi is not universally provided but is considered essential globally. Ensure reliable Wifi is offered.
Recommendations for Hosts
- Ensure your listing includes all essential amenities for Buri Ram: Air conditioning, Kitchen.
- Prioritize adding missing essentials: Kitchen.
- Consider adding popular differentiators like Hot water or Essentials to increase appeal.
- Highlight unique or less common amenities you offer (e.g., hot tub, dedicated workspace, EV charger) in your listing description and photos.
- Regularly check competitor amenities in Buri Ram to stay competitive.
Buri Ram Airbnb Guest Demographics & Profile Analysis (2025)
Guest Profile Summary for Buri Ram
- The typical guest profile for Airbnb in Buri Ram consists of predominantly international visitors (90%), with top international origins including Thailand, typically belonging to the Post-2000s (Gen Z/Alpha) group (50%), primarily speaking English or Spanish.
- Domestic travelers account for 10.5% of guests.
- Key international markets include Australia (15.8%) and Thailand (10.5%).
- Top languages spoken are English (58.8%) followed by Spanish (11.8%).
- A significant demographic segment is the Post-2000s (Gen Z/Alpha) group, representing 50% of guests.
Recommendations for Hosts
- Focus marketing internationally, particularly towards travelers from Thailand.
- Tailor amenities and listing descriptions to appeal to the dominant Post-2000s (Gen Z/Alpha) demographic (e.g., highlight fast WiFi, smart home features, local guides).
- Highlight unique local experiences or amenities relevant to the primary guest profile.
- Consider seasonal promotions aligned with peak travel times for key origin markets.
Nearby Short-Term Rental Market Comparison
How does the Buri Ram Airbnb market stack up against its neighbors? Compare key performance metrics like average monthly revenue, ADR, and occupancy rates in surrounding areas to understand the broader regional STR landscape.
| Market | Active Properties | Monthly Revenue | Daily Rate | Avg. Occupancy |
|---|---|---|---|---|
| Prasat Bakong District | 17 | $550 | $115.09 | 32% |
| Siem Reap | 870 | $412 | $73.68 | 26% |
| Nai Mueang Subdistrict | 18 | $251 | $37.17 | 36% |
| Battambang | 26 | $180 | $33.23 | 23% |
| Krasang Subdistrict | 12 | $162 | $51.21 | 16% |