Molina de Segura Airbnb Market Analysis 2025: Short Term Rental Data & Vacation Rental Statistics in Vega Media del Segura, Spain
Is Airbnb profitable in Molina de Segura in 2025? Explore comprehensive Airbnb analytics for Molina de Segura, Vega Media del Segura, Spain to uncover income potential. This 2025 STR market report for Molina de Segura, based on AirROI data from April 2024 to March 2025, reveals key trends in the niche market of 31 active listings.
Whether you're considering an Airbnb investment in Molina de Segura, optimizing your existing vacation rental, or exploring rental arbitrage opportunities, understanding the Molina de Segura Airbnb data is crucial. Understanding the local regulations is key to maximizing your short term rental income potential. Let's dive into the specifics.
Key Molina de Segura Airbnb Performance Metrics Overview
Monthly Airbnb Revenue Variations & Income Potential in Molina de Segura (2025)
Understanding the monthly revenue variations for Airbnb listings in Molina de Segura is key to maximizing your short term rental income potential. Seasonality significantly impacts earnings. Our analysis, based on data from the past 12 months, shows that the peak revenue month for STRs in Molina de Segura is typically August, while February often presents the lowest earnings, highlighting opportunities for strategic pricing adjustments during shoulder and low seasons. Explore the typical Airbnb income in Molina de Segura across different performance tiers:
- Best-in-class properties (Top 10%) achieve $4,295+ monthly, often utilizing dynamic pricing and superior guest experiences.
- Strong performing properties (Top 25%) earn $2,167 or more, indicating effective management and desirable locations/amenities.
- Typical properties (Median) generate around $1,079 per month, representing the average market performance.
- Entry-level properties (Bottom 25%) see earnings around $459, often with potential for optimization.
Average Monthly Airbnb Earnings Trend in Molina de Segura
Molina de Segura Airbnb Occupancy Rate Trends (2025)
Maximize your bookings by understanding the Molina de Segura STR occupancy trends. Seasonal demand shifts significantly influence how often properties are booked. Typically, Augustsees the highest demand (peak season occupancy), while February experiences the lowest (low season). Effective strategies, like adjusting minimum stays or offering promotions, can boost occupancy during slower periods. Here's how different property tiers perform in Molina de Segura:
- Best-in-class properties (Top 10%) achieve 80%+ occupancy, indicating high desirability and potentially optimized availability.
- Strong performing properties (Top 25%) maintain 59% or higher occupancy, suggesting good market fit and guest satisfaction.
- Typical properties (Median) have an occupancy rate around 37%.
- Entry-level properties (Bottom 25%) average 18% occupancy, potentially facing higher vacancy.
Average Monthly Occupancy Rate Trend in Molina de Segura
Average Daily Rate (ADR) Airbnb Trends in Molina de Segura (2025)
Effective short term rental pricing strategy in Molina de Segura involves understanding monthly ADR fluctuations. The Average Daily Rate (ADR) for Airbnb in Molina de Segura typically peaks in November and dips lowest during March. Leveraging Airbnb dynamic pricing tools or strategies based on this seasonality can significantly boost revenue. Here's a look at the typical nightly rates achieved:
- Best-in-class properties (Top 10%) command rates of $348+ per night, often due to premium features or locations.
- Strong performing properties (Top 25%) achieve nightly rates of $181 or more.
- Typical properties (Median) charge around $78 per night.
- Entry-level properties (Bottom 25%) earn around $33 per night.
Average Daily Rate (ADR) Trend by Month in Molina de Segura
Get Live Molina de Segura Market Intelligence 👇

Explore Real-time Analytics
Airbnb Seasonality Analysis & Trends in Molina de Segura (2025)
Peak Season (August, July, June)
- Revenue averages $2,922 per month
- Occupancy rates average 51.9%
- Daily rates average $139
Shoulder Season
- Revenue averages $1,522 per month
- Occupancy maintains around 39.1%
- Daily rates hold near $135
Low Season (February, March, April)
- Revenue drops to average $1,080 per month
- Occupancy decreases to average 32.9%
- Daily rates adjust to average $126
Seasonality Insights for Molina de Segura
- The Airbnb seasonality in Molina de Segura shows highly seasonal trends requiring careful strategy. While the sections above show seasonal averages, it's also insightful to look at the extremes:
- During the high season, the absolute peak month showcases Molina de Segura's highest earning potential, with monthly revenues capable of climbing to $3,777, occupancy reaching a high of 62.4%, and ADRs peaking at $147.
- Conversely, the slowest single month of the year, typically falling within the low season, marks the market's lowest point. In this month, revenue might dip to $828, occupancy could drop to 27.3%, and ADRs may adjust down to $124.
- Understanding both the seasonal averages and these monthly peaks and troughs in revenue, occupancy, and ADR is crucial for maximizing your Airbnb profit potential in Molina de Segura.
Seasonal Strategies for Maximizing Profit
- Peak Season: Maximize revenue through premium pricing and potentially longer minimum stays. Ensure high availability.
- Low Season: Offer competitive pricing, special promotions (e.g., extended stay discounts), and flexible cancellation policies. Target off-season travelers like remote workers or budget-conscious guests.
- Shoulder Seasons: Implement dynamic pricing that balances peak and low rates. Target weekend travelers or specific events. Offer slightly more flexible terms than peak season.
- Regularly analyze your own performance against these Molina de Segura seasonality benchmarks and adjust your pricing and availability strategy accordingly.
Best Areas for Airbnb Investment in Molina de Segura (2025)
Exploring the top neighborhoods for short-term rentals in Molina de Segura? This section highlights key areas, outlining why they are attractive for hosts and guests, along with notable local attractions. Consider these locations based on your target guest profile and investment strategy.
| Neighborhood / Area | Why Host Here? (Target Guests & Appeal) | Key Attractions & Landmarks |
|---|---|---|
| City Center Molina | The heart of Molina de Segura, known for its vibrant atmosphere, shops, cafes, and easy access to local attractions. Ideal for guests looking to explore the local culture. | Plaza de España, Iglesia de Nuestra Señora de la Asunción, Molina de Segura Town Hall, Museo de la Ciudad, local markets |
| Pinar de la Rafuela | A picturesque residential area surrounded by nature, offering peace and tranquility. Great for guests seeking a natural retreat while still close to urban amenities. | Cerro de los Santos, natural parks, hiking trails, outdoor activities, local wildlife |
| Los Olivos | A popular neighborhood known for its family-friendly atmosphere, parks, and community events. Attracts families and longer-term visitors. | Parque de la Compañía, local playgrounds, community events, family-friendly restaurants |
| El Campillo | An emerging area with new developments and modern amenities. It's gaining popularity among tourists looking for a comfortable stay with local charm. | El Campillo Park, shopping centers, restaurants, local bars |
| San Diego | A well-established neighborhood with amenities and services that attract both locals and tourists. Great for guests who want easy access to everything. | San Diego Church, local shops, community parks, downtown Molina |
| Los Angeles | A growing area with attractive housing and proximity to sports and cultural events in Molina de Segura, popular with younger travelers. | local sports facilities, Molina de Segura Cultural Center, community events |
| La Cañada | A serene neighborhood close to nature, ideal for outdoor enthusiasts. Guests can enjoy hiking and other nature-related activities. | La Cañada Park, nature trails, outdoor sports, local flora and fauna |
| Molina Norte | An urban area with easy access to public transport. Ideal for guests looking to explore the wider region of Vega Media del Segura without hassle. | Molina Norte Shopping District, public transport access, local eateries, urban parks |
Understanding Airbnb License Requirements & STR Laws in Molina de Segura (2025)
With 16% of listings showing registration in 2025, understanding potential Airbnb license requirements is crucial in Molina de Segura. Always verify the latest short term rental regulations and Airbnb license requirements directly with local government authorities for Molina de Segura to ensure full compliance before hosting.
(Source: AirROI data, 2025, based on 16% licensed listings)
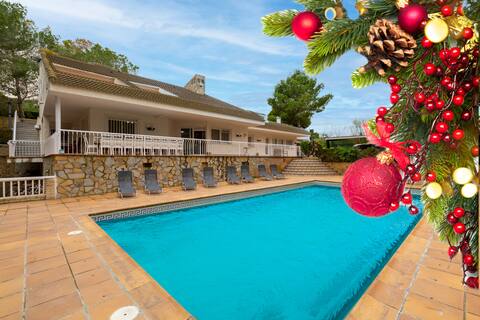
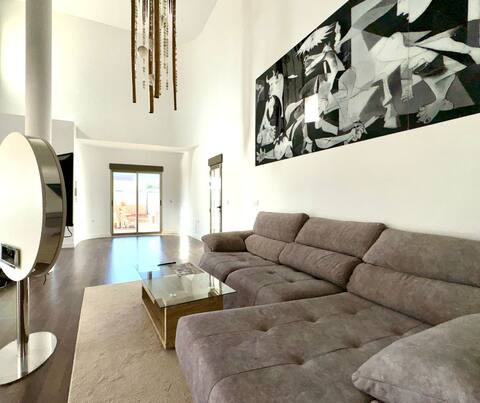
Top Performing Airbnb Properties in Molina de Segura (2025)
Benchmark your potential! Explore examples of top-performing Airbnb properties in Molina de Segurabased on Trailing Twelve Month (TTM) revenue. Analyze their characteristics, revenue, occupancy rate, and ADR to understand what drives success in this market.
Fidalsa Paradise Pines
Entire Place • 9 bedrooms

Wooden cottage with indoor pool
Entire Place • 3 bedrooms
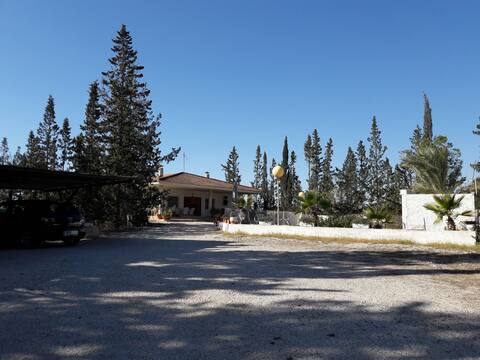
Countryside chalet with pool
Entire Place • 5 bedrooms
Luxury villa with pool
Entire Place • 4 bedrooms
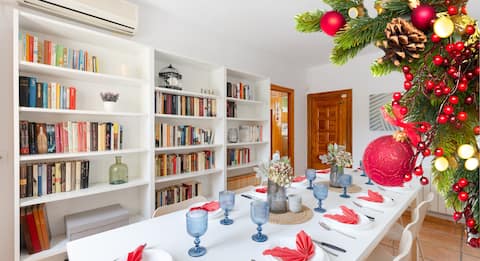
Nature Alive Villa by Fidalsa
Entire Place • 4 bedrooms
Sol-Paraiso Molina
Entire Place • 3 bedrooms
Note: Performance varies based on location, size, amenities, seasonality, and management quality. Data reflects the past 12 months.
Top Performing Airbnb Hosts in Molina de Segura (2025)
Learn from the best! This table showcases top-performing Airbnb hosts in Molina de Segura based on the number of properties managed and estimated total revenue over the past year. Analyze their scale and performance metrics.
| Host Name | Properties | Grossing Revenue | Stay Reviews | Avg Rating |
|---|---|---|---|---|
| Fidalsaholidays | 2 | $118,775 | 21 | 4.17/5.0 |
| Paco | 1 | $50,345 | 17 | 4.82/5.0 |
| Myriam | 1 | $39,101 | 88 | 4.69/5.0 |
| Alberto | 1 | $35,628 | 7 | 4.71/5.0 |
| Raps De | 1 | $24,248 | 4 | 4.75/5.0 |
| Alberto | 1 | $21,410 | 74 | 4.95/5.0 |
| Fulgencio | 1 | $15,726 | 18 | 4.94/5.0 |
| Host #57134101 | 1 | $14,568 | 0 | 0.00/5.0 |
| Rodica | 1 | $12,373 | 110 | 4.92/5.0 |
| Jose | 1 | $11,170 | 24 | 4.67/5.0 |
Analyzing the strategies of top hosts, such as their property selection, pricing, and guest communication, can offer valuable lessons for optimizing your own Airbnb operations in Molina de Segura.
Dive Deeper: Advanced Molina de Segura STR Market Data (2025)
Ready to unlock more insights? AirROI provides access to advanced metrics and comprehensive Airbnb data for Molina de Segura. Explore detailed analytics beyond this report to refine your investment strategy, optimize pricing, and maximize your vacation rental profits.
Explore Advanced MetricsMolina de Segura Short-Term Rental Market Composition (2025): Property & Room Types
Room Type Distribution
Property Type Distribution
Market Composition Insights for Molina de Segura
- The Molina de Segura Airbnb market composition is heavily skewed towards Entire Home/Apt listings, which make up 71% of the 31 active rentals. This indicates strong guest preference for privacy and space.
- Looking at the property type distribution in Molina de Segura, House properties are the most common (64.5%), reflecting the local real estate landscape.
- Houses represent a significant 64.5% portion, catering likely to families or larger groups.
- Smaller segments like hotel/boutique (combined 3.2%) offer potential for unique stay experiences.
Molina de Segura Airbnb Room Capacity Analysis (2025): Bedroom Distribution
Distribution of Listings by Number of Bedrooms
Room Capacity Insights for Molina de Segura
- The dominant room capacity in Molina de Segura is 3 bedrooms listings, making up 22.6% of the market. This suggests a strong demand for properties suitable for families or small groups.
- Together, 3 bedrooms and 2 bedrooms properties represent 45.2% of the active Airbnb listings in Molina de Segura, indicating a high concentration in these sizes.
- A significant 45.2% of listings offer 3+ bedrooms, catering to larger groups and families seeking more space in Molina de Segura.
Molina de Segura Vacation Rental Guest Capacity Trends (2025)
Distribution of Listings by Guest Capacity
Guest Capacity Insights for Molina de Segura
- The most common guest capacity trend in Molina de Segura vacation rentals is listings accommodating 8+ guests (25.8%). This suggests the primary traveler segment is likely larger groups.
- Properties designed for 8+ guests and 4 guests dominate the Molina de Segura STR market, accounting for 45.2% of listings.
- 35.5% of properties accommodate 6+ guests, serving the market segment for larger families or group travel in Molina de Segura.
- On average, properties in Molina de Segura are equipped to host 4.3 guests.
Molina de Segura Airbnb Booking Patterns (2025): Available vs. Booked Days
Available Days Distribution
Booked Days Distribution
Booking Pattern Insights for Molina de Segura
- The most common availability pattern in Molina de Segura falls within the 181-270 days range, representing 41.9% of listings. This suggests many properties have significant open periods on their calendars.
- Approximately 83.8% of listings show high availability (181+ days open annually), indicating potential for increased bookings or specific owner usage patterns.
- For booked days, the 91-180 days range is most frequent in Molina de Segura (41.9%), reflecting common guest stay durations or potential owner blocking patterns.
- A notable 16.1% of properties secure long booking periods (181+ days booked per year), highlighting successful long-term rental strategies or significant owner usage.
Molina de Segura Airbnb Minimum Stay Requirements Analysis
Distribution of Listings by Minimum Night Requirement
1 Night
9 listings
33.3% of total
2 Nights
8 listings
29.6% of total
3 Nights
3 listings
11.1% of total
4-6 Nights
2 listings
7.4% of total
30+ Nights
5 listings
18.5% of total
Key Insights
- The most prevalent minimum stay requirement in Molina de Segura is 1 Night, adopted by 33.3% of listings. This highlights the market's preference for shorter, flexible bookings.
- A strong majority (62.9%) of the Molina de Segura Airbnb data shows acceptance of very short stays (1-2 nights), indicating a dynamic, high-turnover market.
- A significant segment (18.5%) caters to monthly stays (30+ nights) in Molina de Segura, pointing to opportunities in the extended-stay market.
Recommendations
- Align with the market by considering a 1 Night minimum stay, as 33.3% of Molina de Segura hosts use this setting.
- Explore offering discounts for stays of 30+ nights to attract the 18.5% of the market seeking extended stays.
- Adjust minimum nights based on seasonality – potentially shorter during low season and longer during peak demand periods in Molina de Segura.
Molina de Segura Airbnb Cancellation Policy Trends Analysis (2025)
Super Strict 60 Days
1 listings
4.2% of total
Flexible
11 listings
45.8% of total
Moderate
8 listings
33.3% of total
Firm
1 listings
4.2% of total
Strict
3 listings
12.5% of total
Cancellation Policy Insights for Molina de Segura
- The prevailing Airbnb cancellation policy trend in Molina de Segura is Flexible, used by 45.8% of listings.
- The market strongly favors guest-friendly terms, with 79.1% of listings offering Flexible or Moderate policies. This suggests guests in Molina de Segura may expect booking flexibility.
Recommendations for Hosts
- Consider adopting a Flexible policy to align with the 45.8% market standard in Molina de Segura.
- Using a Strict policy might deter some guests, as only 12.5% of listings use it. Evaluate if potential revenue protection outweighs possible lower booking rates.
- Regularly review your cancellation policy against competitors and market demand shifts in Molina de Segura.
Molina de Segura STR Booking Lead Time Analysis (2025)
Average Booking Lead Time by Month
Booking Lead Time Insights for Molina de Segura
- The overall average booking lead time for vacation rentals in Molina de Segura is 33 days.
- Guests book furthest in advance for stays during August (average 69 days), likely coinciding with peak travel demand or local events.
- The shortest booking windows occur for stays in March (average 18 days), indicating more last-minute travel plans during this time.
- Seasonally, Summer (57 days avg.) sees the longest lead times, while Spring (35 days avg.) has the shortest, reflecting typical travel planning cycles.
Recommendations for Hosts
- Use the overall average lead time (33 days) as a baseline for your pricing and availability strategy in Molina de Segura.
- For August stays, consider implementing length-of-stay discounts or slightly higher rates for bookings made less than 69 days out to capitalize on advance planning.
- Target marketing efforts for the Summer season well in advance (at least 57 days) to capture early planners.
- Monitor your own booking lead times against these Molina de Segura averages to identify opportunities for dynamic pricing adjustments.
Popular & Essential Airbnb Amenities in Molina de Segura (2025)
Amenity Prevalence
Amenity Insights for Molina de Segura
- Essential amenities in Molina de Segura that guests expect include: Washer, Kitchen. Lacking these (any) could significantly impact bookings.
- Popular amenities like Wifi, TV, Heating are common but not universal. Offering these can provide a competitive edge.
- Warning: Wifi is not universally provided but is considered essential globally. Ensure reliable Wifi is offered.
Recommendations for Hosts
- Ensure your listing includes all essential amenities for Molina de Segura: Washer, Kitchen.
- Prioritize adding missing essentials: Kitchen.
- Consider adding popular differentiators like Wifi or TV to increase appeal.
- Highlight unique or less common amenities you offer (e.g., hot tub, dedicated workspace, EV charger) in your listing description and photos.
- Regularly check competitor amenities in Molina de Segura to stay competitive.
Molina de Segura Airbnb Guest Demographics & Profile Analysis (2025)
Guest Profile Summary for Molina de Segura
- The typical guest profile for Airbnb in Molina de Segura consists of a mix of domestic (57%) and international guests, often arriving from nearby Madrid, typically belonging to the Post-2000s (Gen Z/Alpha) group (50%), primarily speaking Spanish or English.
- Domestic travelers account for 57.4% of guests.
- Key international markets include Spain (57.4%) and France (9.3%).
- Top languages spoken are Spanish (31.1%) followed by English (30.2%).
- A significant demographic segment is the Post-2000s (Gen Z/Alpha) group, representing 50% of guests.
Recommendations for Hosts
- Balance marketing efforts between domestic and international channels based on the guest mix.
- Tailor amenities and listing descriptions to appeal to the dominant Post-2000s (Gen Z/Alpha) demographic (e.g., highlight fast WiFi, smart home features, local guides).
- Highlight unique local experiences or amenities relevant to the primary guest profile.
- Consider seasonal promotions aligned with peak travel times for key origin markets.
Nearby Short-Term Rental Market Comparison
How does the Molina de Segura Airbnb market stack up against its neighbors? Compare key performance metrics like average monthly revenue, ADR, and occupancy rates in surrounding areas to understand the broader regional STR landscape.
| Market | Active Properties | Monthly Revenue | Daily Rate | Avg. Occupancy |
|---|---|---|---|---|
| Macastre | 13 | $2,924 | $296.93 | 42% |
| Corbera | 13 | $2,721 | $206.87 | 41% |
| Bétera | 31 | $2,711 | $222.77 | 46% |
| l'Eliana | 33 | $2,510 | $298.45 | 43% |
| San Antonio de Benagéber | 11 | $2,374 | $335.55 | 40% |
| Manises | 25 | $2,352 | $175.71 | 38% |
| Olocau | 11 | $2,245 | $308.22 | 36% |
| Alboraia / Alboraya | 272 | $2,220 | $186.05 | 49% |
| la Pobla de Vallbona | 27 | $2,163 | $193.69 | 49% |
| Riba-roja de Túria | 21 | $2,132 | $221.03 | 41% |