Segorbe Airbnb Market Analysis 2025: Short Term Rental Data & Vacation Rental Statistics in Valencian Community, Spain
Is Airbnb profitable in Segorbe in 2025? Explore comprehensive Airbnb analytics for Segorbe, Valencian Community, Spain to uncover income potential. This 2025 STR market report for Segorbe, based on AirROI data from April 2024 to March 2025, reveals key trends in the niche market of 19 active listings.
Whether you're considering an Airbnb investment in Segorbe, optimizing your existing vacation rental, or exploring rental arbitrage opportunities, understanding the Segorbe Airbnb data is crucial. Understanding the local regulations is key to maximizing your short term rental income potential. Let's dive into the specifics.
Key Segorbe Airbnb Performance Metrics Overview
Monthly Airbnb Revenue Variations & Income Potential in Segorbe (2025)
Understanding the monthly revenue variations for Airbnb listings in Segorbe is key to maximizing your short term rental income potential. Seasonality significantly impacts earnings. Our analysis, based on data from the past 12 months, shows that the peak revenue month for STRs in Segorbe is typically August, while November often presents the lowest earnings, highlighting opportunities for strategic pricing adjustments during shoulder and low seasons. Explore the typical Airbnb income in Segorbe across different performance tiers:
- Best-in-class properties (Top 10%) achieve $1,333+ monthly, often utilizing dynamic pricing and superior guest experiences.
- Strong performing properties (Top 25%) earn $887 or more, indicating effective management and desirable locations/amenities.
- Typical properties (Median) generate around $476 per month, representing the average market performance.
- Entry-level properties (Bottom 25%) see earnings around $263, often with potential for optimization.
Average Monthly Airbnb Earnings Trend in Segorbe
Segorbe Airbnb Occupancy Rate Trends (2025)
Maximize your bookings by understanding the Segorbe STR occupancy trends. Seasonal demand shifts significantly influence how often properties are booked. Typically, Augustsees the highest demand (peak season occupancy), while January experiences the lowest (low season). Effective strategies, like adjusting minimum stays or offering promotions, can boost occupancy during slower periods. Here's how different property tiers perform in Segorbe:
- Best-in-class properties (Top 10%) achieve 61%+ occupancy, indicating high desirability and potentially optimized availability.
- Strong performing properties (Top 25%) maintain 36% or higher occupancy, suggesting good market fit and guest satisfaction.
- Typical properties (Median) have an occupancy rate around 22%.
- Entry-level properties (Bottom 25%) average 11% occupancy, potentially facing higher vacancy.
Average Monthly Occupancy Rate Trend in Segorbe
Average Daily Rate (ADR) Airbnb Trends in Segorbe (2025)
Effective short term rental pricing strategy in Segorbe involves understanding monthly ADR fluctuations. The Average Daily Rate (ADR) for Airbnb in Segorbe typically peaks in December and dips lowest during May. Leveraging Airbnb dynamic pricing tools or strategies based on this seasonality can significantly boost revenue. Here's a look at the typical nightly rates achieved:
- Best-in-class properties (Top 10%) command rates of $122+ per night, often due to premium features or locations.
- Strong performing properties (Top 25%) achieve nightly rates of $104 or more.
- Typical properties (Median) charge around $73 per night.
- Entry-level properties (Bottom 25%) earn around $50 per night.
Average Daily Rate (ADR) Trend by Month in Segorbe
Get Live Segorbe Market Intelligence 👇

Explore Real-time Analytics
Airbnb Seasonality Analysis & Trends in Segorbe (2025)
Peak Season (August, July, April)
- Revenue averages $935 per month
- Occupancy rates average 39.5%
- Daily rates average $79
Shoulder Season
- Revenue averages $587 per month
- Occupancy maintains around 25.4%
- Daily rates hold near $82
Low Season (January, February, November)
- Revenue drops to average $387 per month
- Occupancy decreases to average 19.1%
- Daily rates adjust to average $91
Seasonality Insights for Segorbe
- The Airbnb seasonality in Segorbe shows highly seasonal trends requiring careful strategy. While the sections above show seasonal averages, it's also insightful to look at the extremes:
- During the high season, the absolute peak month showcases Segorbe's highest earning potential, with monthly revenues capable of climbing to $1,298, occupancy reaching a high of 53.8%, and ADRs peaking at $92.
- Conversely, the slowest single month of the year, typically falling within the low season, marks the market's lowest point. In this month, revenue might dip to $295, occupancy could drop to 15.6%, and ADRs may adjust down to $77.
- Understanding both the seasonal averages and these monthly peaks and troughs in revenue, occupancy, and ADR is crucial for maximizing your Airbnb profit potential in Segorbe.
Seasonal Strategies for Maximizing Profit
- Peak Season: Maximize revenue through premium pricing and potentially longer minimum stays. Ensure high availability.
- Low Season: Offer competitive pricing, special promotions (e.g., extended stay discounts), and flexible cancellation policies. Target off-season travelers like remote workers or budget-conscious guests.
- Shoulder Seasons: Implement dynamic pricing that balances peak and low rates. Target weekend travelers or specific events. Offer slightly more flexible terms than peak season.
- Regularly analyze your own performance against these Segorbe seasonality benchmarks and adjust your pricing and availability strategy accordingly.
Best Areas for Airbnb Investment in Segorbe (2025)
Exploring the top neighborhoods for short-term rentals in Segorbe? This section highlights key areas, outlining why they are attractive for hosts and guests, along with notable local attractions. Consider these locations based on your target guest profile and investment strategy.
| Neighborhood / Area | Why Host Here? (Target Guests & Appeal) | Key Attractions & Landmarks |
|---|---|---|
| Historic Center | Segorbe's enchanting historical center, featuring medieval architecture and charming streets. Ideal for tourists interested in cultural experiences and local history. | Segorbe Cathedral, Aqueduct of Segorbe, Museo de la Ciudad, Plaza del Agua, Torre de los Músicos |
| Sierra de Espina | A beautiful natural area perfect for nature lovers and outdoor activities. Attracts those who enjoy hiking and scenic views. | Hiking Trails, Natural Parks, Picnic Areas, Scenic Lookouts |
| Las Poblaciones | A suburban area close to Segorbe, offering a quieter atmosphere and easy access to nearby towns, appealing to families and long-term visitors. | Local Parks, Community Events, Family-friendly Atmosphere |
| Cerro de la Iglesia | A tranquil area with stunning views over Segorbe, popular with those seeking peace and natural beauty. Great for retreat-style accommodations. | Iglesia de San Juan Bautista, Walking Trails, Observation Points |
| Barrio de San Roque | Known for its vibrant community and traditional festivals. Attracts visitors during local festivities and is great for cultural immersion. | Fiestas de San Roque, Local Markets, Historical Buildings |
| Centro Commercial | The commercial hub of Segorbe, attracting visitors for shopping and dining. Ideal for those looking for a bustling atmosphere and convenience. | Shopping Centers, Restaurants, Cafes, Local Shops |
| La Senda | A neighborhood known for its green spaces and community parks. Attracts families and travelers who appreciate outdoor activities and relaxation. | Parks, Playgrounds, Community Gardens |
| El Barranco | An area known for its beautiful landscape and hiking paths. Perfect for those who enjoy outdoor adventures and exploring nature. | Hiking Trails, Scenic Views, Nature Walks |
Understanding Airbnb License Requirements & STR Laws in Segorbe (2025)
With 26% of listings showing registration in 2025, understanding potential Airbnb license requirements is crucial in Segorbe. Always verify the latest short term rental regulations and Airbnb license requirements directly with local government authorities for Segorbe to ensure full compliance before hosting.
(Source: AirROI data, 2025, based on 26% licensed listings)
Top Performing Airbnb Properties in Segorbe (2025)
Benchmark your potential! Explore examples of top-performing Airbnb properties in Segorbebased on Trailing Twelve Month (TTM) revenue. Analyze their characteristics, revenue, occupancy rate, and ADR to understand what drives success in this market.
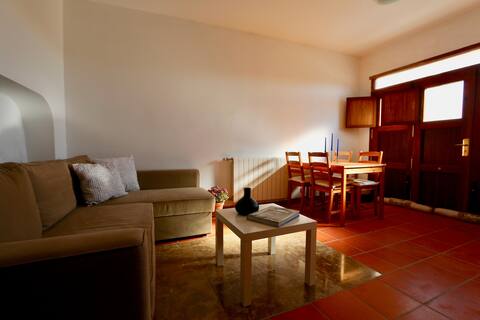
Peaceful apartment in Penalba
Entire Place • 1 bedroom
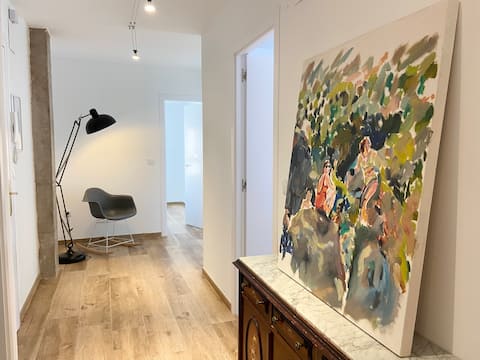
Artistic apartment in the center of Segorbe
Entire Place • 2 bedrooms

Star Inn. Descanso cerca de Valencia
Entire Place • 2 bedrooms
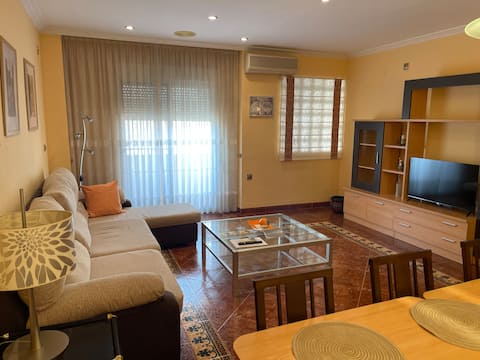
Holiday apartment in Segorbe
Entire Place • 3 bedrooms

Nice house in a rural village
Entire Place • 4 bedrooms

Casa Rural Argen Segorbe
Entire Place • 3 bedrooms
Note: Performance varies based on location, size, amenities, seasonality, and management quality. Data reflects the past 12 months.
Top Performing Airbnb Hosts in Segorbe (2025)
Learn from the best! This table showcases top-performing Airbnb hosts in Segorbe based on the number of properties managed and estimated total revenue over the past year. Analyze their scale and performance metrics.
| Host Name | Properties | Grossing Revenue | Stay Reviews | Avg Rating |
|---|---|---|---|---|
| Selina | 1 | $10,707 | 133 | 4.70/5.0 |
| Miguel | 1 | $10,649 | 19 | 4.74/5.0 |
| Sergio | 1 | $8,227 | 34 | 4.91/5.0 |
| Ester | 1 | $8,170 | 9 | 5.00/5.0 |
| Rosa | 1 | $6,913 | 9 | 4.89/5.0 |
| Maria | 1 | $5,919 | 26 | 4.38/5.0 |
| Host #327005663 | 1 | $5,362 | 29 | 4.48/5.0 |
| Elena | 1 | $4,300 | 7 | 4.86/5.0 |
| Lucia | 1 | $3,892 | 3 | 4.67/5.0 |
| Maximiliano | 2 | $3,851 | 16 | 4.71/5.0 |
Analyzing the strategies of top hosts, such as their property selection, pricing, and guest communication, can offer valuable lessons for optimizing your own Airbnb operations in Segorbe.
Dive Deeper: Advanced Segorbe STR Market Data (2025)
Ready to unlock more insights? AirROI provides access to advanced metrics and comprehensive Airbnb data for Segorbe. Explore detailed analytics beyond this report to refine your investment strategy, optimize pricing, and maximize your vacation rental profits.
Explore Advanced MetricsSegorbe Short-Term Rental Market Composition (2025): Property & Room Types
Room Type Distribution
Property Type Distribution
Market Composition Insights for Segorbe
- The Segorbe Airbnb market composition is heavily skewed towards Entire Home/Apt listings, which make up 84.2% of the 19 active rentals. This indicates strong guest preference for privacy and space.
- Looking at the property type distribution in Segorbe, House properties are the most common (68.4%), reflecting the local real estate landscape.
- Houses represent a significant 68.4% portion, catering likely to families or larger groups.
- The presence of 5.3% Hotel/Boutique listings indicates integration with traditional hospitality.
Segorbe Airbnb Room Capacity Analysis (2025): Bedroom Distribution
Distribution of Listings by Number of Bedrooms
Room Capacity Insights for Segorbe
- The dominant room capacity in Segorbe is 3 bedrooms listings, making up 47.4% of the market. This suggests a strong demand for properties suitable for families or small groups.
- Together, 3 bedrooms and 2 bedrooms properties represent 68.5% of the active Airbnb listings in Segorbe, indicating a high concentration in these sizes.
- A significant 58.0% of listings offer 3+ bedrooms, catering to larger groups and families seeking more space in Segorbe.
Segorbe Vacation Rental Guest Capacity Trends (2025)
Distribution of Listings by Guest Capacity
Guest Capacity Insights for Segorbe
- The most common guest capacity trend in Segorbe vacation rentals is listings accommodating 5 guests (21.1%). This suggests the primary traveler segment is likely larger groups.
- Properties designed for 5 guests and 6 guests dominate the Segorbe STR market, accounting for 42.2% of listings.
- 36.9% of properties accommodate 6+ guests, serving the market segment for larger families or group travel in Segorbe.
- On average, properties in Segorbe are equipped to host 4.5 guests.
Segorbe Airbnb Booking Patterns (2025): Available vs. Booked Days
Available Days Distribution
Booked Days Distribution
Booking Pattern Insights for Segorbe
- The most common availability pattern in Segorbe falls within the 271-366 days range, representing 68.4% of listings. This suggests many properties have significant open periods on their calendars.
- Approximately 100.0% of listings show high availability (181+ days open annually), indicating potential for increased bookings or specific owner usage patterns.
- For booked days, the 1-30 days range is most frequent in Segorbe (36.8%), reflecting common guest stay durations or potential owner blocking patterns.
Segorbe Airbnb Minimum Stay Requirements Analysis
Distribution of Listings by Minimum Night Requirement
1 Night
1 listings
5.6% of total
2 Nights
15 listings
83.3% of total
4-6 Nights
1 listings
5.6% of total
30+ Nights
1 listings
5.6% of total
Key Insights
- The most prevalent minimum stay requirement in Segorbe is 2 Nights, adopted by 83.3% of listings. This highlights the market's preference for shorter, flexible bookings.
- A strong majority (88.9%) of the Segorbe Airbnb data shows acceptance of very short stays (1-2 nights), indicating a dynamic, high-turnover market.
Recommendations
- Align with the market by considering a 2 Nights minimum stay, as 83.3% of Segorbe hosts use this setting.
- If feasible, allowing 1-night stays, especially midweek or during low season, could capture last-minute bookings, as only 5.6% currently do.
- A 2-night minimum appears standard (83.3%). Consider this for weekends or peak periods.
- Explore offering discounts for stays of 30+ nights to attract the 5.6% of the market seeking extended stays.
- Adjust minimum nights based on seasonality – potentially shorter during low season and longer during peak demand periods in Segorbe.
Segorbe Airbnb Cancellation Policy Trends Analysis (2025)
Flexible
5 listings
27.8% of total
Moderate
8 listings
44.4% of total
Firm
3 listings
16.7% of total
Strict
2 listings
11.1% of total
Cancellation Policy Insights for Segorbe
- The prevailing Airbnb cancellation policy trend in Segorbe is Moderate, used by 44.4% of listings.
- The market strongly favors guest-friendly terms, with 72.2% of listings offering Flexible or Moderate policies. This suggests guests in Segorbe may expect booking flexibility.
Recommendations for Hosts
- Consider adopting a Moderate policy to align with the 44.4% market standard in Segorbe.
- Using a Strict policy might deter some guests, as only 11.1% of listings use it. Evaluate if potential revenue protection outweighs possible lower booking rates.
- Regularly review your cancellation policy against competitors and market demand shifts in Segorbe.
Segorbe STR Booking Lead Time Analysis (2025)
Average Booking Lead Time by Month
Booking Lead Time Insights for Segorbe
- The overall average booking lead time for vacation rentals in Segorbe is 54 days.
- Guests book furthest in advance for stays during February (average 76 days), likely coinciding with peak travel demand or local events.
- The shortest booking windows occur for stays in April (average 22 days), indicating more last-minute travel plans during this time.
- Seasonally, Winter (64 days avg.) sees the longest lead times, while Summer (33 days avg.) has the shortest, reflecting typical travel planning cycles.
Recommendations for Hosts
- Use the overall average lead time (54 days) as a baseline for your pricing and availability strategy in Segorbe.
- For February stays, consider implementing length-of-stay discounts or slightly higher rates for bookings made less than 76 days out to capitalize on advance planning.
- Target marketing efforts for the Winter season well in advance (at least 64 days) to capture early planners.
- Monitor your own booking lead times against these Segorbe averages to identify opportunities for dynamic pricing adjustments.
Popular & Essential Airbnb Amenities in Segorbe (2025)
Amenity Prevalence
Amenity Insights for Segorbe
- Popular amenities like TV, Washer, Kitchen are common but not universal. Offering these can provide a competitive edge.
- Warning: Wifi is not universally provided but is considered essential globally. Ensure reliable Wifi is offered.
Recommendations for Hosts
- Consider adding popular differentiators like TV or Washer to increase appeal.
- Highlight unique or less common amenities you offer (e.g., hot tub, dedicated workspace, EV charger) in your listing description and photos.
- Regularly check competitor amenities in Segorbe to stay competitive.
Segorbe Airbnb Guest Demographics & Profile Analysis (2025)
Guest Profile Summary for Segorbe
- The typical guest profile for Airbnb in Segorbe consists of a mix of domestic (63%) and international guests, often arriving from nearby Valencia, typically belonging to the Post-2000s (Gen Z/Alpha) group (50%), primarily speaking Spanish or English.
- Domestic travelers account for 62.8% of guests.
- Key international markets include Spain (62.8%) and France (14%).
- Top languages spoken are Spanish (37.2%) followed by English (25.6%).
- A significant demographic segment is the Post-2000s (Gen Z/Alpha) group, representing 50% of guests.
Recommendations for Hosts
- Target domestic marketing efforts towards travelers from Valencia and Madrid.
- Tailor amenities and listing descriptions to appeal to the dominant Post-2000s (Gen Z/Alpha) demographic (e.g., highlight fast WiFi, smart home features, local guides).
- Highlight unique local experiences or amenities relevant to the primary guest profile.
- Consider seasonal promotions aligned with peak travel times for key origin markets.
Nearby Short-Term Rental Market Comparison
How does the Segorbe Airbnb market stack up against its neighbors? Compare key performance metrics like average monthly revenue, ADR, and occupancy rates in surrounding areas to understand the broader regional STR landscape.
| Market | Active Properties | Monthly Revenue | Daily Rate | Avg. Occupancy |
|---|---|---|---|---|
| Macastre | 13 | $2,924 | $296.93 | 42% |
| Corbera | 13 | $2,721 | $206.87 | 41% |
| Bétera | 31 | $2,711 | $222.77 | 46% |
| l'Eliana | 33 | $2,510 | $298.45 | 43% |
| San Antonio de Benagéber | 11 | $2,374 | $335.55 | 40% |
| Manises | 25 | $2,352 | $175.71 | 38% |
| Olocau | 11 | $2,245 | $308.22 | 36% |
| Alboraia / Alboraya | 272 | $2,220 | $186.05 | 49% |
| la Pobla de Vallbona | 27 | $2,163 | $193.69 | 49% |
| Riba-roja de Túria | 21 | $2,132 | $221.03 | 41% |