Rojales Airbnb Market Analysis 2025: Short Term Rental Data & Vacation Rental Statistics in Valencian Community, Spain
Is Airbnb profitable in Rojales in 2025? Explore comprehensive Airbnb analytics for Rojales, Valencian Community, Spain to uncover income potential. This 2025 STR market report for Rojales, based on AirROI data from April 2024 to March 2025, reveals key trends in the market of 301 active listings.
Whether you're considering an Airbnb investment in Rojales, optimizing your existing vacation rental, or exploring rental arbitrage opportunities, understanding the Rojales Airbnb data is crucial. Navigating the high regulation landscape is key to maximizing your short term rental income potential. Let's dive into the specifics.
Key Rojales Airbnb Performance Metrics Overview
Monthly Airbnb Revenue Variations & Income Potential in Rojales (2025)
Understanding the monthly revenue variations for Airbnb listings in Rojales is key to maximizing your short term rental income potential. Seasonality significantly impacts earnings. Our analysis, based on data from the past 12 months, shows that the peak revenue month for STRs in Rojales is typically August, while February often presents the lowest earnings, highlighting opportunities for strategic pricing adjustments during shoulder and low seasons. Explore the typical Airbnb income in Rojales across different performance tiers:
- Best-in-class properties (Top 10%) achieve $4,609+ monthly, often utilizing dynamic pricing and superior guest experiences.
- Strong performing properties (Top 25%) earn $2,807 or more, indicating effective management and desirable locations/amenities.
- Typical properties (Median) generate around $1,537 per month, representing the average market performance.
- Entry-level properties (Bottom 25%) see earnings around $821, often with potential for optimization.
Average Monthly Airbnb Earnings Trend in Rojales
Rojales Airbnb Occupancy Rate Trends (2025)
Maximize your bookings by understanding the Rojales STR occupancy trends. Seasonal demand shifts significantly influence how often properties are booked. Typically, Augustsees the highest demand (peak season occupancy), while March experiences the lowest (low season). Effective strategies, like adjusting minimum stays or offering promotions, can boost occupancy during slower periods. Here's how different property tiers perform in Rojales:
- Best-in-class properties (Top 10%) achieve 78%+ occupancy, indicating high desirability and potentially optimized availability.
- Strong performing properties (Top 25%) maintain 60% or higher occupancy, suggesting good market fit and guest satisfaction.
- Typical properties (Median) have an occupancy rate around 38%.
- Entry-level properties (Bottom 25%) average 21% occupancy, potentially facing higher vacancy.
Average Monthly Occupancy Rate Trend in Rojales
Average Daily Rate (ADR) Airbnb Trends in Rojales (2025)
Effective short term rental pricing strategy in Rojales involves understanding monthly ADR fluctuations. The Average Daily Rate (ADR) for Airbnb in Rojales typically peaks in August and dips lowest during February. Leveraging Airbnb dynamic pricing tools or strategies based on this seasonality can significantly boost revenue. Here's a look at the typical nightly rates achieved:
- Best-in-class properties (Top 10%) command rates of $294+ per night, often due to premium features or locations.
- Strong performing properties (Top 25%) achieve nightly rates of $207 or more.
- Typical properties (Median) charge around $135 per night.
- Entry-level properties (Bottom 25%) earn around $86 per night.
Average Daily Rate (ADR) Trend by Month in Rojales
Get Live Rojales Market Intelligence 👇

Explore Real-time Analytics
Airbnb Seasonality Analysis & Trends in Rojales (2025)
Peak Season (August, July, May)
- Revenue averages $3,493 per month
- Occupancy rates average 57.9%
- Daily rates average $186
Shoulder Season
- Revenue averages $1,945 per month
- Occupancy maintains around 38.7%
- Daily rates hold near $168
Low Season (January, February, March)
- Revenue drops to average $1,150 per month
- Occupancy decreases to average 29.9%
- Daily rates adjust to average $147
Seasonality Insights for Rojales
- The Airbnb seasonality in Rojales shows highly seasonal trends requiring careful strategy. While the sections above show seasonal averages, it's also insightful to look at the extremes:
- During the high season, the absolute peak month showcases Rojales's highest earning potential, with monthly revenues capable of climbing to $4,122, occupancy reaching a high of 69.9%, and ADRs peaking at $192.
- Conversely, the slowest single month of the year, typically falling within the low season, marks the market's lowest point. In this month, revenue might dip to $1,110, occupancy could drop to 28.3%, and ADRs may adjust down to $146.
- Understanding both the seasonal averages and these monthly peaks and troughs in revenue, occupancy, and ADR is crucial for maximizing your Airbnb profit potential in Rojales.
Seasonal Strategies for Maximizing Profit
- Peak Season: Maximize revenue through premium pricing and potentially longer minimum stays. Ensure high availability.
- Low Season: Offer competitive pricing, special promotions (e.g., extended stay discounts), and flexible cancellation policies. Target off-season travelers like remote workers or budget-conscious guests.
- Shoulder Seasons: Implement dynamic pricing that balances peak and low rates. Target weekend travelers or specific events. Offer slightly more flexible terms than peak season.
- Regularly analyze your own performance against these Rojales seasonality benchmarks and adjust your pricing and availability strategy accordingly.
Best Areas for Airbnb Investment in Rojales (2025)
Exploring the top neighborhoods for short-term rentals in Rojales? This section highlights key areas, outlining why they are attractive for hosts and guests, along with notable local attractions. Consider these locations based on your target guest profile and investment strategy.
| Neighborhood / Area | Why Host Here? (Target Guests & Appeal) | Key Attractions & Landmarks |
|---|---|---|
| La Marquesa Golf | A renowned golf resort area that attracts golf enthusiasts and tourists looking for a relaxing vacation. The presence of stunning golf courses makes it an appealing location for Airbnb investments. | La Marquesa Golf Course, Clubhouse, La Marquesa Shopping Center |
| Natural Park of Lagunas de La Mata | This natural park offers beautiful landscapes and a variety of outdoor activities, making it attractive for nature lovers and tourists seeking tranquility and beauty. | Lagunas de La Mata, Birdwatching trails, Natural park hiking paths |
| Quesada | A vibrant urbanization with a mix of residential and tourist attractions. It is favored by expatriates and tourists seeking a lively atmosphere with numerous amenities. | Quesada Water Park, Local restaurants and shops, Cafe Bar |
| Rojales Town Centre | The historic center of Rojales offers a taste of local culture and charm. It appeals to those looking for a more authentic Spanish experience, along with access to local markets and activities. | Rojales Town Hall, Historic buildings, Local market |
| Ciudad Quesada | A developed residential area popular among foreigners, with plenty of amenities. It offers a community feel and attracts families and tourists alike. | La Marquesa Golf Course, Local bars and restaurants, Community pools |
| Guardamar del Segura Beach | A short drive from Rojales, this beach is known for its golden sands and family-friendly environment. It's ideal for attracting beach-goers looking for a seaside retreat. | Guardamar Beach, The Dunes, Promenade |
| Los Montesinos | This area is known for its serene landscapes and picturesque surroundings, which attract visitors looking for a peaceful getaway amid nature. | Laguna Salada, Traditional Spanish restaurants, Local parks |
| Torrevieja | Located nearby, Torrevieja is a popular tourist destination known for its beaches, nightlife, and cultural attractions. It offers ample opportunities for short-term rental investments. | Torrevieja Beach, Aquapark, Salt lakes |
Understanding Airbnb License Requirements & STR Laws in Rojales (2025)
Yes, Rojales, Valencian Community, Spain enforces high STR regulations. Obtaining a license and ensuring compliance is almost certainly required according to current 2025 STR laws. Always verify the latest short term rental regulations and Airbnb license requirements directly with local government authorities for Rojales to ensure full compliance before hosting.
(Source: AirROI data, 2025, based on 33% licensed listings)
Top Performing Airbnb Properties in Rojales (2025)
Benchmark your potential! Explore examples of top-performing Airbnb properties in Rojalesbased on Trailing Twelve Month (TTM) revenue. Analyze their characteristics, revenue, occupancy rate, and ADR to understand what drives success in this market.
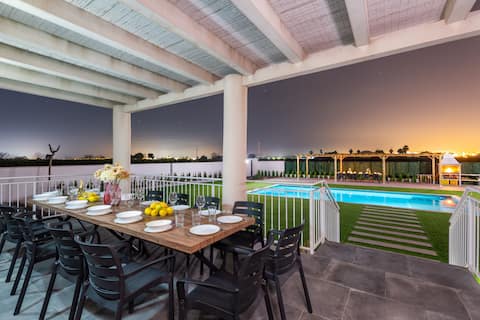
Almost Heaven by Fidalsa
Entire Place • 5 bedrooms
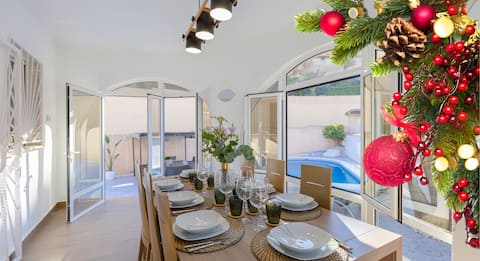
The Big Chill by Fidalsa
Entire Place • 3 bedrooms
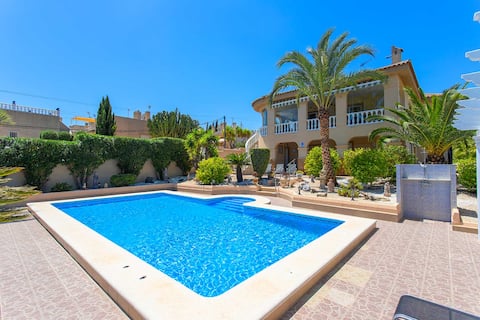
CH Villa Jupiter La Marquesa Golf (Ciudad Quesada)
Entire Place • 5 bedrooms
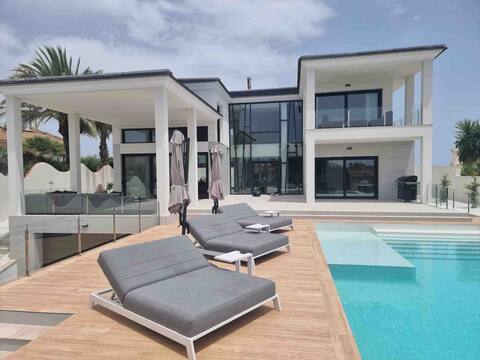
Villa Serenity
Entire Place • 7 bedrooms
Beautiful home in Ciudad Quesada-Rojales
Entire Place • 3 bedrooms

Luxury comfortable Villa in Spain for 8
Entire Place • 4 bedrooms
Note: Performance varies based on location, size, amenities, seasonality, and management quality. Data reflects the past 12 months.
Top Performing Airbnb Hosts in Rojales (2025)
Learn from the best! This table showcases top-performing Airbnb hosts in Rojales based on the number of properties managed and estimated total revenue over the past year. Analyze their scale and performance metrics.
| Host Name | Properties | Grossing Revenue | Stay Reviews | Avg Rating |
|---|---|---|---|---|
| Scott | 45 | $702,471 | 284 | 3.95/5.0 |
| Fidalsaholidays | 5 | $249,888 | 75 | 4.50/5.0 |
| Ciara | 13 | $123,447 | 85 | 2.80/5.0 |
| Villasandyou | 8 | $100,087 | 27 | 2.19/5.0 |
| Gianluca Y Vanessa | 2 | $88,484 | 32 | 4.88/5.0 |
| Rubén | 8 | $80,376 | 58 | 2.35/5.0 |
| Novasol | 2 | $71,769 | 22 | 4.42/5.0 |
| Roy And Marlene | 1 | $69,833 | 3 | 3.67/5.0 |
| Natali | 2 | $68,038 | 43 | 4.92/5.0 |
| Ewelina | 1 | $64,894 | 108 | 4.68/5.0 |
Analyzing the strategies of top hosts, such as their property selection, pricing, and guest communication, can offer valuable lessons for optimizing your own Airbnb operations in Rojales.
Dive Deeper: Advanced Rojales STR Market Data (2025)
Ready to unlock more insights? AirROI provides access to advanced metrics and comprehensive Airbnb data for Rojales. Explore detailed analytics beyond this report to refine your investment strategy, optimize pricing, and maximize your vacation rental profits.
Explore Advanced MetricsRojales Short-Term Rental Market Composition (2025): Property & Room Types
Room Type Distribution
Property Type Distribution
Market Composition Insights for Rojales
- The Rojales Airbnb market composition is heavily skewed towards Entire Home/Apt listings, which make up 97.3% of the 301 active rentals. This indicates strong guest preference for privacy and space.
- Looking at the property type distribution in Rojales, House properties are the most common (75.7%), reflecting the local real estate landscape.
- Houses represent a significant 75.7% portion, catering likely to families or larger groups.
- Smaller segments like hotel/boutique (combined 2.0%) offer potential for unique stay experiences.
Rojales Airbnb Room Capacity Analysis (2025): Bedroom Distribution
Distribution of Listings by Number of Bedrooms
Room Capacity Insights for Rojales
- The dominant room capacity in Rojales is 2 bedrooms listings, making up 39.9% of the market. This suggests a strong demand for properties suitable for couples or solo travelers.
- Together, 2 bedrooms and 3 bedrooms properties represent 76.1% of the active Airbnb listings in Rojales, indicating a high concentration in these sizes.
- A significant 50.9% of listings offer 3+ bedrooms, catering to larger groups and families seeking more space in Rojales.
Rojales Vacation Rental Guest Capacity Trends (2025)
Distribution of Listings by Guest Capacity
Guest Capacity Insights for Rojales
- The most common guest capacity trend in Rojales vacation rentals is listings accommodating 6 guests (37.9%). This suggests the primary traveler segment is likely larger groups.
- Properties designed for 6 guests and 4 guests dominate the Rojales STR market, accounting for 71.8% of listings.
- 56.2% of properties accommodate 6+ guests, serving the market segment for larger families or group travel in Rojales.
- On average, properties in Rojales are equipped to host 5.4 guests.
Rojales Airbnb Booking Patterns (2025): Available vs. Booked Days
Available Days Distribution
Booked Days Distribution
Booking Pattern Insights for Rojales
- The most common availability pattern in Rojales falls within the 271-366 days range, representing 54.5% of listings. This suggests many properties have significant open periods on their calendars.
- Approximately 87.1% of listings show high availability (181+ days open annually), indicating potential for increased bookings or specific owner usage patterns.
- For booked days, the 31-90 days range is most frequent in Rojales (36.2%), reflecting common guest stay durations or potential owner blocking patterns.
- A notable 12.9% of properties secure long booking periods (181+ days booked per year), highlighting successful long-term rental strategies or significant owner usage.
Rojales Airbnb Minimum Stay Requirements Analysis
Distribution of Listings by Minimum Night Requirement
1 Night
24 listings
8.5% of total
2 Nights
26 listings
9.3% of total
3 Nights
61 listings
21.7% of total
4-6 Nights
94 listings
33.5% of total
7-29 Nights
32 listings
11.4% of total
30+ Nights
44 listings
15.7% of total
Key Insights
- The most prevalent minimum stay requirement in Rojales is 4-6 Nights, adopted by 33.5% of listings. This highlights the market's preference for longer commitments.
- Very short stays (1-2 nights) are less common (17.8%), suggesting hosts prefer slightly longer bookings to optimize turnover.
- A significant segment (15.7%) caters to monthly stays (30+ nights) in Rojales, pointing to opportunities in the extended-stay market.
Recommendations
- Align with the market by considering a 4-6 Nights minimum stay, as 33.5% of Rojales hosts use this setting.
- If feasible, allowing 1-night stays, especially midweek or during low season, could capture last-minute bookings, as only 8.5% currently do.
- Explore offering discounts for stays of 30+ nights to attract the 15.7% of the market seeking extended stays.
- Adjust minimum nights based on seasonality – potentially shorter during low season and longer during peak demand periods in Rojales.
Rojales Airbnb Cancellation Policy Trends Analysis (2025)
Super Strict 30 Days
2 listings
0.9% of total
Super Strict 60 Days
20 listings
8.6% of total
Flexible
27 listings
11.6% of total
Moderate
39 listings
16.7% of total
Firm
96 listings
41.2% of total
Strict
49 listings
21% of total
Cancellation Policy Insights for Rojales
- The prevailing Airbnb cancellation policy trend in Rojales is Firm, used by 41.2% of listings.
- A majority (62.2%) of hosts in Rojales utilize Firm or Strict policies, indicating a market where hosts prioritize booking security.
Recommendations for Hosts
- Consider adopting a Firm policy to align with the 41.2% market standard in Rojales.
- Regularly review your cancellation policy against competitors and market demand shifts in Rojales.
Rojales STR Booking Lead Time Analysis (2025)
Average Booking Lead Time by Month
Booking Lead Time Insights for Rojales
- The overall average booking lead time for vacation rentals in Rojales is 75 days.
- Guests book furthest in advance for stays during July (average 134 days), likely coinciding with peak travel demand or local events.
- The shortest booking windows occur for stays in March (average 52 days), indicating more last-minute travel plans during this time.
- Seasonally, Summer (120 days avg.) sees the longest lead times, while Winter (67 days avg.) has the shortest, reflecting typical travel planning cycles.
Recommendations for Hosts
- Use the overall average lead time (75 days) as a baseline for your pricing and availability strategy in Rojales.
- For July stays, consider implementing length-of-stay discounts or slightly higher rates for bookings made less than 134 days out to capitalize on advance planning.
- Target marketing efforts for the Summer season well in advance (at least 120 days) to capture early planners.
- Monitor your own booking lead times against these Rojales averages to identify opportunities for dynamic pricing adjustments.
Popular & Essential Airbnb Amenities in Rojales (2025)
Amenity Prevalence
Amenity Insights for Rojales
- Essential amenities in Rojales that guests expect include: TV, Kitchen, Wifi, Air conditioning, Washer. Lacking these (any) could significantly impact bookings.
- Popular amenities like Pool, Refrigerator, Hot water are common but not universal. Offering these can provide a competitive edge.
- A pool is a highly desired but not standard amenity, making it a key feature for attracting guests seeking leisure in Rojales.
Recommendations for Hosts
- Ensure your listing includes all essential amenities for Rojales: TV, Kitchen, Wifi, Air conditioning, Washer.
- Prioritize adding missing essentials: TV, Kitchen, Wifi, Air conditioning, Washer.
- Consider adding popular differentiators like Pool or Refrigerator to increase appeal.
- Highlight unique or less common amenities you offer (e.g., hot tub, dedicated workspace, EV charger) in your listing description and photos.
- Regularly check competitor amenities in Rojales to stay competitive.
Rojales Airbnb Guest Demographics & Profile Analysis (2025)
Guest Profile Summary for Rojales
- The typical guest profile for Airbnb in Rojales consists of predominantly international visitors (84%), with top international origins including France, typically belonging to the Post-2000s (Gen Z/Alpha) group (50%), primarily speaking English or French.
- Domestic travelers account for 15.6% of guests.
- Key international markets include United Kingdom (35.3%) and France (15.9%).
- Top languages spoken are English (40.5%) followed by French (15.3%).
- A significant demographic segment is the Post-2000s (Gen Z/Alpha) group, representing 50% of guests.
Recommendations for Hosts
- Focus marketing internationally, particularly towards travelers from France.
- Tailor amenities and listing descriptions to appeal to the dominant Post-2000s (Gen Z/Alpha) demographic (e.g., highlight fast WiFi, smart home features, local guides).
- Highlight unique local experiences or amenities relevant to the primary guest profile.
- Consider seasonal promotions aligned with peak travel times for key origin markets.
Nearby Short-Term Rental Market Comparison
How does the Rojales Airbnb market stack up against its neighbors? Compare key performance metrics like average monthly revenue, ADR, and occupancy rates in surrounding areas to understand the broader regional STR landscape.
| Market | Active Properties | Monthly Revenue | Daily Rate | Avg. Occupancy |
|---|---|---|---|---|
| Macastre | 13 | $2,924 | $296.93 | 42% |
| Corbera | 13 | $2,721 | $206.87 | 41% |
| Bétera | 31 | $2,711 | $222.77 | 46% |
| l'Eliana | 33 | $2,510 | $298.45 | 43% |
| San Antonio de Benagéber | 11 | $2,374 | $335.55 | 40% |
| Manises | 25 | $2,352 | $175.71 | 38% |
| Olocau | 11 | $2,245 | $308.22 | 36% |
| Alboraia / Alboraya | 272 | $2,220 | $186.05 | 49% |
| la Pobla de Vallbona | 27 | $2,163 | $193.69 | 49% |
| Riba-roja de Túria | 21 | $2,132 | $221.03 | 41% |