Polop Airbnb Market Analysis 2025: Short Term Rental Data & Vacation Rental Statistics in Valencian Community, Spain
Is Airbnb profitable in Polop in 2025? Explore comprehensive Airbnb analytics for Polop, Valencian Community, Spain to uncover income potential. This 2025 STR market report for Polop, based on AirROI data from April 2024 to March 2025, reveals key trends in the niche market of 55 active listings.
Whether you're considering an Airbnb investment in Polop, optimizing your existing vacation rental, or exploring rental arbitrage opportunities, understanding the Polop Airbnb data is crucial. Understanding the local regulations is key to maximizing your short term rental income potential. Let's dive into the specifics.
Key Polop Airbnb Performance Metrics Overview
Monthly Airbnb Revenue Variations & Income Potential in Polop (2025)
Understanding the monthly revenue variations for Airbnb listings in Polop is key to maximizing your short term rental income potential. Seasonality significantly impacts earnings. Our analysis, based on data from the past 12 months, shows that the peak revenue month for STRs in Polop is typically July, while January often presents the lowest earnings, highlighting opportunities for strategic pricing adjustments during shoulder and low seasons. Explore the typical Airbnb income in Polop across different performance tiers:
- Best-in-class properties (Top 10%) achieve $5,094+ monthly, often utilizing dynamic pricing and superior guest experiences.
- Strong performing properties (Top 25%) earn $3,200 or more, indicating effective management and desirable locations/amenities.
- Typical properties (Median) generate around $1,792 per month, representing the average market performance.
- Entry-level properties (Bottom 25%) see earnings around $831, often with potential for optimization.
Average Monthly Airbnb Earnings Trend in Polop
Polop Airbnb Occupancy Rate Trends (2025)
Maximize your bookings by understanding the Polop STR occupancy trends. Seasonal demand shifts significantly influence how often properties are booked. Typically, Augustsees the highest demand (peak season occupancy), while January experiences the lowest (low season). Effective strategies, like adjusting minimum stays or offering promotions, can boost occupancy during slower periods. Here's how different property tiers perform in Polop:
- Best-in-class properties (Top 10%) achieve 72%+ occupancy, indicating high desirability and potentially optimized availability.
- Strong performing properties (Top 25%) maintain 57% or higher occupancy, suggesting good market fit and guest satisfaction.
- Typical properties (Median) have an occupancy rate around 34%.
- Entry-level properties (Bottom 25%) average 15% occupancy, potentially facing higher vacancy.
Average Monthly Occupancy Rate Trend in Polop
Average Daily Rate (ADR) Airbnb Trends in Polop (2025)
Effective short term rental pricing strategy in Polop involves understanding monthly ADR fluctuations. The Average Daily Rate (ADR) for Airbnb in Polop typically peaks in July and dips lowest during February. Leveraging Airbnb dynamic pricing tools or strategies based on this seasonality can significantly boost revenue. Here's a look at the typical nightly rates achieved:
- Best-in-class properties (Top 10%) command rates of $497+ per night, often due to premium features or locations.
- Strong performing properties (Top 25%) achieve nightly rates of $276 or more.
- Typical properties (Median) charge around $161 per night.
- Entry-level properties (Bottom 25%) earn around $97 per night.
Average Daily Rate (ADR) Trend by Month in Polop
Get Live Polop Market Intelligence 👇

Explore Real-time Analytics
Airbnb Seasonality Analysis & Trends in Polop (2025)
Peak Season (July, August, June)
- Revenue averages $3,739 per month
- Occupancy rates average 50.0%
- Daily rates average $239
Shoulder Season
- Revenue averages $2,312 per month
- Occupancy maintains around 36.7%
- Daily rates hold near $224
Low Season (January, February, March)
- Revenue drops to average $1,431 per month
- Occupancy decreases to average 27.6%
- Daily rates adjust to average $219
Seasonality Insights for Polop
- The Airbnb seasonality in Polop shows highly seasonal trends requiring careful strategy. While the sections above show seasonal averages, it's also insightful to look at the extremes:
- During the high season, the absolute peak month showcases Polop's highest earning potential, with monthly revenues capable of climbing to $4,065, occupancy reaching a high of 59.5%, and ADRs peaking at $244.
- Conversely, the slowest single month of the year, typically falling within the low season, marks the market's lowest point. In this month, revenue might dip to $1,391, occupancy could drop to 25.9%, and ADRs may adjust down to $216.
- Understanding both the seasonal averages and these monthly peaks and troughs in revenue, occupancy, and ADR is crucial for maximizing your Airbnb profit potential in Polop.
Seasonal Strategies for Maximizing Profit
- Peak Season: Maximize revenue through premium pricing and potentially longer minimum stays. Ensure high availability.
- Low Season: Offer competitive pricing, special promotions (e.g., extended stay discounts), and flexible cancellation policies. Target off-season travelers like remote workers or budget-conscious guests.
- Shoulder Seasons: Implement dynamic pricing that balances peak and low rates. Target weekend travelers or specific events. Offer slightly more flexible terms than peak season.
- Regularly analyze your own performance against these Polop seasonality benchmarks and adjust your pricing and availability strategy accordingly.
Best Areas for Airbnb Investment in Polop (2025)
Exploring the top neighborhoods for short-term rentals in Polop? This section highlights key areas, outlining why they are attractive for hosts and guests, along with notable local attractions. Consider these locations based on your target guest profile and investment strategy.
| Neighborhood / Area | Why Host Here? (Target Guests & Appeal) | Key Attractions & Landmarks |
|---|---|---|
| Centro de Polop | The heart of Polop, where visitors can experience the local culture, charming streets, and traditional Spanish ambiance. Close to key attractions and restaurants, it’s perfect for tourists. | Polop Castle, Church of Our Lady of the Assumption, Fuente de los Chorros, Mirador de la Font- Llavanera, Local markets |
| Natural Park of Puig Campana | A stunning natural area ideal for hiking and outdoor activities, attracting nature lovers and adventure seekers. An excellent spot for hosting eco-tourists and those looking to escape the city. | Puig Campana peak, Hiking trails, Flora and fauna, Scenic viewpoints, Outdoor picnic areas |
| La Nucia | Adjacent to Polop, La Nucia offers a variety of entertainment options, including theme parks and cultural activities. It's a popular choice for families and groups of friends. | Aqualandia, Mundomar, La Nucia Soccer Field, Cultural Center, Local festivals |
| Benidorm | A short drive from Polop, Benidorm is famous for its beaches and vibrant nightlife. Ideal for tourists looking for a lively atmosphere and beach activities. | Levante Beach, Poniente Beach, Benidorm Palace, Old Town, Skyline views |
| Altea | Known for its picturesque old town and beautiful coastline, Altea attracts visitors interested in art, culture, and stunning views. A perfect place for those seeking a relaxed atmosphere. | Church of Our Lady of Consolation, Art galleries, Altea Beach, Old town cobblestone streets, Mediterranean restaurants |
| Finestrat | A quaint village offering breathtaking views and proximity to the coast. It appeals to visitors looking for a peaceful retreat close to lively beach areas. | Finestrat Castle, Theme parks nearby, Beach access, Local wine tours, Scenic walks |
| Polop de la Marina | A scenic and less touristy area compared to nearby locations, offering authentic Spanish living. Great for guests looking to immerse themselves in local culture. | Local pottery shops, Viscaya Cascade, Traditional Spanish cuisine, Quiet walking paths, Cultural workshops |
| La Villa Joyosa | Famous for its colorful beachfront and historic buildings, it provides a relaxed coastal vibe. Attractive to families and those seeking beautiful beaches and historical sites. | La Vila Joiosa beach, Chocolate Museum, Old town with colorful houses, Local seafood restaurants, Historical site visits |
Understanding Airbnb License Requirements & STR Laws in Polop (2025)
With 29% of listings showing registration in 2025, understanding potential Airbnb license requirements is crucial in Polop. Always verify the latest short term rental regulations and Airbnb license requirements directly with local government authorities for Polop to ensure full compliance before hosting.
(Source: AirROI data, 2025, based on 29% licensed listings)
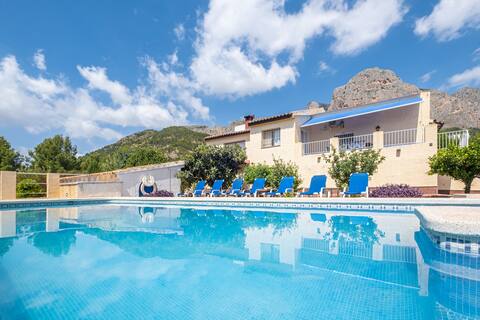
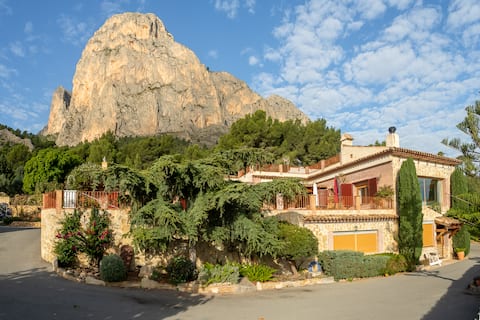
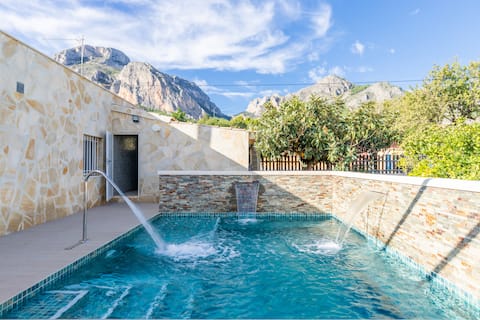
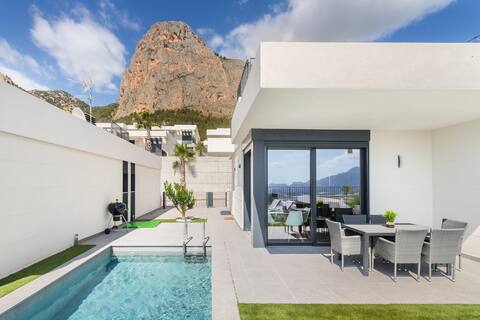
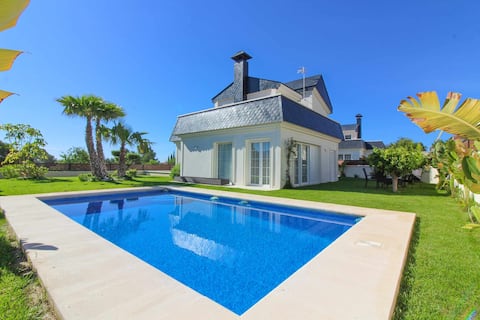
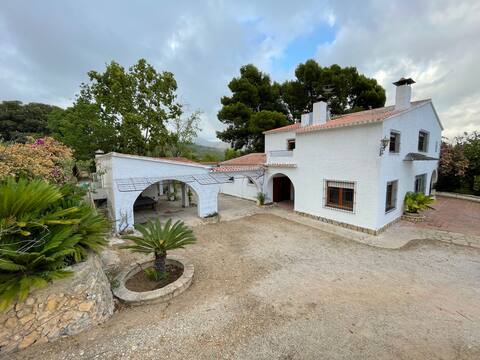
Top Performing Airbnb Properties in Polop (2025)
Benchmark your potential! Explore examples of top-performing Airbnb properties in Polopbased on Trailing Twelve Month (TTM) revenue. Analyze their characteristics, revenue, occupancy rate, and ADR to understand what drives success in this market.
Large villa la nucia polop
Entire Place • 6 bedrooms
Casa El Flare. Costa Blanca country villa.
Entire Place • 5 bedrooms
Esperanza
Entire Place • 2 bedrooms
Lovely house with private pool
Entire Place • 3 bedrooms
Villa with private pool and WiFi - Polop
Entire Place • 3 bedrooms
Large rural house with pool and barbecue
Entire Place • 8 bedrooms
Note: Performance varies based on location, size, amenities, seasonality, and management quality. Data reflects the past 12 months.
Top Performing Airbnb Hosts in Polop (2025)
Learn from the best! This table showcases top-performing Airbnb hosts in Polop based on the number of properties managed and estimated total revenue over the past year. Analyze their scale and performance metrics.
| Host Name | Properties | Grossing Revenue | Stay Reviews | Avg Rating |
|---|---|---|---|---|
| Francisco Javier | 1 | $84,499 | 49 | 4.14/5.0 |
| Angela | 1 | $70,519 | 8 | 4.88/5.0 |
| Host #491995504 | 1 | $63,678 | 0 | 0.00/5.0 |
| Roxane | 2 | $62,430 | 54 | 4.92/5.0 |
| El Niu | 2 | $60,101 | 35 | 2.42/5.0 |
| Elodie | 2 | $48,923 | 16 | 4.72/5.0 |
| Paulo Sosta | 1 | $48,804 | 17 | 4.94/5.0 |
| Francisco | 1 | $46,334 | 17 | 4.71/5.0 |
| Jumate Rentals | 1 | $45,002 | 10 | 5.00/5.0 |
| Unni | 1 | $39,373 | 102 | 4.75/5.0 |
Analyzing the strategies of top hosts, such as their property selection, pricing, and guest communication, can offer valuable lessons for optimizing your own Airbnb operations in Polop.
Dive Deeper: Advanced Polop STR Market Data (2025)
Ready to unlock more insights? AirROI provides access to advanced metrics and comprehensive Airbnb data for Polop. Explore detailed analytics beyond this report to refine your investment strategy, optimize pricing, and maximize your vacation rental profits.
Explore Advanced MetricsPolop Short-Term Rental Market Composition (2025): Property & Room Types
Room Type Distribution
Property Type Distribution
Market Composition Insights for Polop
- The Polop Airbnb market composition is heavily skewed towards Entire Home/Apt listings, which make up 96.4% of the 55 active rentals. This indicates strong guest preference for privacy and space.
- Looking at the property type distribution in Polop, House properties are the most common (85.5%), reflecting the local real estate landscape.
- Houses represent a significant 85.5% portion, catering likely to families or larger groups.
- Smaller segments like hotel/boutique, outdoor/unique (combined 3.6%) offer potential for unique stay experiences.
Polop Airbnb Room Capacity Analysis (2025): Bedroom Distribution
Distribution of Listings by Number of Bedrooms
Room Capacity Insights for Polop
- The dominant room capacity in Polop is 3 bedrooms listings, making up 36.4% of the market. This suggests a strong demand for properties suitable for families or small groups.
- Together, 3 bedrooms and 2 bedrooms properties represent 58.2% of the active Airbnb listings in Polop, indicating a high concentration in these sizes.
- A significant 61.8% of listings offer 3+ bedrooms, catering to larger groups and families seeking more space in Polop.
Polop Vacation Rental Guest Capacity Trends (2025)
Distribution of Listings by Guest Capacity
Guest Capacity Insights for Polop
- The most common guest capacity trend in Polop vacation rentals is listings accommodating 6 guests (29.1%). This suggests the primary traveler segment is likely larger groups.
- Properties designed for 6 guests and 8+ guests dominate the Polop STR market, accounting for 56.4% of listings.
- 60.0% of properties accommodate 6+ guests, serving the market segment for larger families or group travel in Polop.
- On average, properties in Polop are equipped to host 5.5 guests.
Polop Airbnb Booking Patterns (2025): Available vs. Booked Days
Available Days Distribution
Booked Days Distribution
Booking Pattern Insights for Polop
- The most common availability pattern in Polop falls within the 271-366 days range, representing 52.7% of listings. This suggests many properties have significant open periods on their calendars.
- Approximately 81.8% of listings show high availability (181+ days open annually), indicating potential for increased bookings or specific owner usage patterns.
- For booked days, the 31-90 days range is most frequent in Polop (32.7%), reflecting common guest stay durations or potential owner blocking patterns.
- A notable 18.2% of properties secure long booking periods (181+ days booked per year), highlighting successful long-term rental strategies or significant owner usage.
Polop Airbnb Minimum Stay Requirements Analysis
Distribution of Listings by Minimum Night Requirement
1 Night
7 listings
14% of total
2 Nights
12 listings
24% of total
3 Nights
8 listings
16% of total
4-6 Nights
12 listings
24% of total
7-29 Nights
4 listings
8% of total
30+ Nights
7 listings
14% of total
Key Insights
- The most prevalent minimum stay requirement in Polop is 2 Nights, adopted by 24% of listings. This highlights the market's preference for shorter, flexible bookings.
- A significant segment (14%) caters to monthly stays (30+ nights) in Polop, pointing to opportunities in the extended-stay market.
Recommendations
- Align with the market by considering a 2 Nights minimum stay, as 24% of Polop hosts use this setting.
- If feasible, allowing 1-night stays, especially midweek or during low season, could capture last-minute bookings, as only 14% currently do.
- Explore offering discounts for stays of 30+ nights to attract the 14% of the market seeking extended stays.
- Adjust minimum nights based on seasonality – potentially shorter during low season and longer during peak demand periods in Polop.
Polop Airbnb Cancellation Policy Trends Analysis (2025)
Super Strict 30 Days
2 listings
4.9% of total
Super Strict 60 Days
6 listings
14.6% of total
Flexible
6 listings
14.6% of total
Moderate
10 listings
24.4% of total
Firm
7 listings
17.1% of total
Strict
10 listings
24.4% of total
Cancellation Policy Insights for Polop
- The prevailing Airbnb cancellation policy trend in Polop is Moderate, used by 24.4% of listings.
- There's a relatively balanced mix between guest-friendly (39.0%) and stricter (41.5%) policies, offering choices for different guest needs.
Recommendations for Hosts
- Consider adopting a Moderate policy to align with the 24.4% market standard in Polop.
- Regularly review your cancellation policy against competitors and market demand shifts in Polop.
Polop STR Booking Lead Time Analysis (2025)
Average Booking Lead Time by Month
Booking Lead Time Insights for Polop
- The overall average booking lead time for vacation rentals in Polop is 66 days.
- Guests book furthest in advance for stays during May (average 108 days), likely coinciding with peak travel demand or local events.
- The shortest booking windows occur for stays in January (average 56 days), indicating more last-minute travel plans during this time.
- Seasonally, Summer (88 days avg.) sees the longest lead times, while Winter (63 days avg.) has the shortest, reflecting typical travel planning cycles.
Recommendations for Hosts
- Use the overall average lead time (66 days) as a baseline for your pricing and availability strategy in Polop.
- For May stays, consider implementing length-of-stay discounts or slightly higher rates for bookings made less than 108 days out to capitalize on advance planning.
- Target marketing efforts for the Summer season well in advance (at least 88 days) to capture early planners.
- Monitor your own booking lead times against these Polop averages to identify opportunities for dynamic pricing adjustments.
Popular & Essential Airbnb Amenities in Polop (2025)
Amenity Prevalence
Amenity Insights for Polop
- Essential amenities in Polop that guests expect include: Kitchen, Washer, TV, Wifi. Lacking these (any) could significantly impact bookings.
- Popular amenities like Air conditioning, Heating, Dishes and silverware are common but not universal. Offering these can provide a competitive edge.
Recommendations for Hosts
- Ensure your listing includes all essential amenities for Polop: Kitchen, Washer, TV, Wifi.
- Prioritize adding missing essentials: Washer, TV, Wifi.
- Consider adding popular differentiators like Air conditioning or Heating to increase appeal.
- Highlight unique or less common amenities you offer (e.g., hot tub, dedicated workspace, EV charger) in your listing description and photos.
- Regularly check competitor amenities in Polop to stay competitive.
Polop Airbnb Guest Demographics & Profile Analysis (2025)
Guest Profile Summary for Polop
- The typical guest profile for Airbnb in Polop consists of predominantly international visitors (68%), with top international origins including France, typically belonging to the Post-2000s (Gen Z/Alpha) group (50%), primarily speaking English or Spanish.
- Domestic travelers account for 31.7% of guests.
- Key international markets include Spain (31.7%) and France (13.7%).
- Top languages spoken are English (36.3%) followed by Spanish (20.7%).
- A significant demographic segment is the Post-2000s (Gen Z/Alpha) group, representing 50% of guests.
Recommendations for Hosts
- Focus marketing internationally, particularly towards travelers from France.
- Tailor amenities and listing descriptions to appeal to the dominant Post-2000s (Gen Z/Alpha) demographic (e.g., highlight fast WiFi, smart home features, local guides).
- Highlight unique local experiences or amenities relevant to the primary guest profile.
- Consider seasonal promotions aligned with peak travel times for key origin markets.
Nearby Short-Term Rental Market Comparison
How does the Polop Airbnb market stack up against its neighbors? Compare key performance metrics like average monthly revenue, ADR, and occupancy rates in surrounding areas to understand the broader regional STR landscape.
| Market | Active Properties | Monthly Revenue | Daily Rate | Avg. Occupancy |
|---|---|---|---|---|
| Macastre | 13 | $2,924 | $296.93 | 42% |
| Corbera | 13 | $2,721 | $206.87 | 41% |
| Bétera | 31 | $2,711 | $222.77 | 46% |
| l'Eliana | 33 | $2,510 | $298.45 | 43% |
| San Antonio de Benagéber | 11 | $2,374 | $335.55 | 40% |
| Manises | 25 | $2,352 | $175.71 | 38% |
| Olocau | 11 | $2,245 | $308.22 | 36% |
| Alboraia / Alboraya | 272 | $2,220 | $186.05 | 49% |
| la Pobla de Vallbona | 27 | $2,163 | $193.69 | 49% |
| Riba-roja de Túria | 21 | $2,132 | $221.03 | 41% |