Picassent Airbnb Market Analysis 2025: Short Term Rental Data & Vacation Rental Statistics in Valencian Community, Spain
Is Airbnb profitable in Picassent in 2025? Explore comprehensive Airbnb analytics for Picassent, Valencian Community, Spain to uncover income potential. This 2025 STR market report for Picassent, based on AirROI data from April 2024 to March 2025, reveals key trends in the niche market of 20 active listings.
Whether you're considering an Airbnb investment in Picassent, optimizing your existing vacation rental, or exploring rental arbitrage opportunities, understanding the Picassent Airbnb data is crucial. Understanding the local regulations is key to maximizing your short term rental income potential. Let's dive into the specifics.
Key Picassent Airbnb Performance Metrics Overview
Monthly Airbnb Revenue Variations & Income Potential in Picassent (2025)
Understanding the monthly revenue variations for Airbnb listings in Picassent is key to maximizing your short term rental income potential. Seasonality significantly impacts earnings. Our analysis, based on data from the past 12 months, shows that the peak revenue month for STRs in Picassent is typically August, while January often presents the lowest earnings, highlighting opportunities for strategic pricing adjustments during shoulder and low seasons. Explore the typical Airbnb income in Picassent across different performance tiers:
- Best-in-class properties (Top 10%) achieve $6,162+ monthly, often utilizing dynamic pricing and superior guest experiences.
- Strong performing properties (Top 25%) earn $3,593 or more, indicating effective management and desirable locations/amenities.
- Typical properties (Median) generate around $1,581 per month, representing the average market performance.
- Entry-level properties (Bottom 25%) see earnings around $751, often with potential for optimization.
Average Monthly Airbnb Earnings Trend in Picassent
Picassent Airbnb Occupancy Rate Trends (2025)
Maximize your bookings by understanding the Picassent STR occupancy trends. Seasonal demand shifts significantly influence how often properties are booked. Typically, Augustsees the highest demand (peak season occupancy), while January experiences the lowest (low season). Effective strategies, like adjusting minimum stays or offering promotions, can boost occupancy during slower periods. Here's how different property tiers perform in Picassent:
- Best-in-class properties (Top 10%) achieve 71%+ occupancy, indicating high desirability and potentially optimized availability.
- Strong performing properties (Top 25%) maintain 51% or higher occupancy, suggesting good market fit and guest satisfaction.
- Typical properties (Median) have an occupancy rate around 30%.
- Entry-level properties (Bottom 25%) average 16% occupancy, potentially facing higher vacancy.
Average Monthly Occupancy Rate Trend in Picassent
Average Daily Rate (ADR) Airbnb Trends in Picassent (2025)
Effective short term rental pricing strategy in Picassent involves understanding monthly ADR fluctuations. The Average Daily Rate (ADR) for Airbnb in Picassent typically peaks in December and dips lowest during May. Leveraging Airbnb dynamic pricing tools or strategies based on this seasonality can significantly boost revenue. Here's a look at the typical nightly rates achieved:
- Best-in-class properties (Top 10%) command rates of $432+ per night, often due to premium features or locations.
- Strong performing properties (Top 25%) achieve nightly rates of $300 or more.
- Typical properties (Median) charge around $143 per night.
- Entry-level properties (Bottom 25%) earn around $62 per night.
Average Daily Rate (ADR) Trend by Month in Picassent
Get Live Picassent Market Intelligence 👇

Explore Real-time Analytics
Airbnb Seasonality Analysis & Trends in Picassent (2025)
Peak Season (August, July, September)
- Revenue averages $4,178 per month
- Occupancy rates average 49.5%
- Daily rates average $179
Shoulder Season
- Revenue averages $2,221 per month
- Occupancy maintains around 34.7%
- Daily rates hold near $190
Low Season (January, March, November)
- Revenue drops to average $1,195 per month
- Occupancy decreases to average 22.2%
- Daily rates adjust to average $228
Seasonality Insights for Picassent
- The Airbnb seasonality in Picassent shows highly seasonal trends requiring careful strategy. While the sections above show seasonal averages, it's also insightful to look at the extremes:
- During the high season, the absolute peak month showcases Picassent's highest earning potential, with monthly revenues capable of climbing to $4,966, occupancy reaching a high of 57.0%, and ADRs peaking at $243.
- Conversely, the slowest single month of the year, typically falling within the low season, marks the market's lowest point. In this month, revenue might dip to $686, occupancy could drop to 17.0%, and ADRs may adjust down to $164.
- Understanding both the seasonal averages and these monthly peaks and troughs in revenue, occupancy, and ADR is crucial for maximizing your Airbnb profit potential in Picassent.
Seasonal Strategies for Maximizing Profit
- Peak Season: Maximize revenue through premium pricing and potentially longer minimum stays. Ensure high availability.
- Low Season: Offer competitive pricing, special promotions (e.g., extended stay discounts), and flexible cancellation policies. Target off-season travelers like remote workers or budget-conscious guests.
- Shoulder Seasons: Implement dynamic pricing that balances peak and low rates. Target weekend travelers or specific events. Offer slightly more flexible terms than peak season.
- Regularly analyze your own performance against these Picassent seasonality benchmarks and adjust your pricing and availability strategy accordingly.
Best Areas for Airbnb Investment in Picassent (2025)
Exploring the top neighborhoods for short-term rentals in Picassent? This section highlights key areas, outlining why they are attractive for hosts and guests, along with notable local attractions. Consider these locations based on your target guest profile and investment strategy.
| Neighborhood / Area | Why Host Here? (Target Guests & Appeal) | Key Attractions & Landmarks |
|---|---|---|
| Picassent City Center | The heart of Picassent offers easy access to local shops, restaurants, and cultural sites. Ideal for tourists wanting to experience authentic Spanish life. | Picassent Church, Central Park, Cultural Center of Picassent, Local Market, Picassent Castle |
| La Bega | A peaceful residential area perfect for families or travelers looking for a quiet stay with good access to nature and local amenities. | Natural Park of La Bega, Local hiking trails, Cafes and family-run restaurants |
| Ribera del Xúquer | Scenic riverside area with beautiful views and outdoor activities. Popular for those who enjoy cycling and river sports. | Xúquer River, Cycle routes, Water sports facilities, Picnicking areas |
| Picassent Golf Course | Great for golf enthusiasts. Offers green views and a tranquil setting for a relaxing stay near the golf course. | Local Golf Course, Driving range, Clubhouse dining |
| Camp de Túria | Lively neighborhood with a blend of urban and rural, providing a unique stay experience with local festivals and events. | Camp de Túria Waterfall, Local festivities, Parks and outdoor spaces |
| Pinedo Beach | Close proximity to the beach, great for summer travelers looking to enjoy sun and sea while being near Picassent. | Pinedo Beach, Boardwalk, Restaurants with beach views |
| Cerro de les Creus | A mountainous area providing stunning views and hiking opportunities, perfect for nature lovers and adventure seekers. | Hiking trails, Scenic lookout points, Nature reserves |
| Valencia City Access | Proximity to Valencia makes it attractive for travelers wanting an urban experience and access to the vibrant city life. | Valencia Cathedral, City of Arts and Sciences, Valencia Central Market, Beachfront Promenade |
Understanding Airbnb License Requirements & STR Laws in Picassent (2025)
With 25% of listings showing registration in 2025, understanding potential Airbnb license requirements is crucial in Picassent. Always verify the latest short term rental regulations and Airbnb license requirements directly with local government authorities for Picassent to ensure full compliance before hosting.
(Source: AirROI data, 2025, based on 25% licensed listings)
Top Performing Airbnb Properties in Picassent (2025)
Benchmark your potential! Explore examples of top-performing Airbnb properties in Picassentbased on Trailing Twelve Month (TTM) revenue. Analyze their characteristics, revenue, occupancy rate, and ADR to understand what drives success in this market.
Villaentrenaranjos
Entire Place • 5 bedrooms
Villa Cali in Picassent
Entire Place • 6 bedrooms

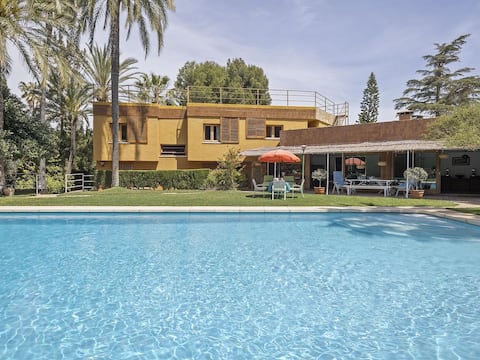
Beautiful villa near Valencia
Entire Place • 4 bedrooms
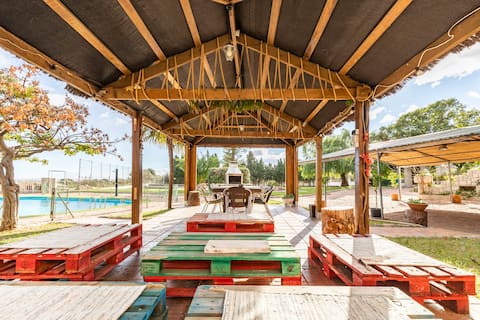
Mountain & quiet at home +Pool & BBQ
Entire Place • 3 bedrooms
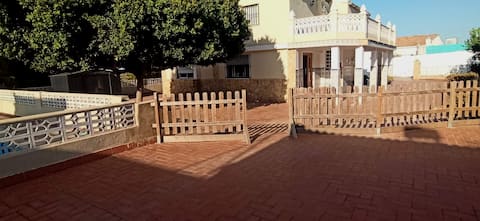
Chalet with private pool1 - Picassent (Valencia)
Entire Place • 4 bedrooms
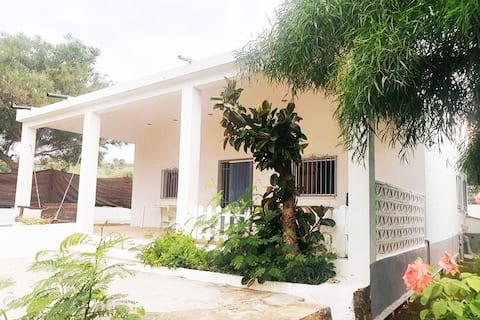
Village house with the most modern comforts
Entire Place • 2 bedrooms
Note: Performance varies based on location, size, amenities, seasonality, and management quality. Data reflects the past 12 months.
Top Performing Airbnb Hosts in Picassent (2025)
Learn from the best! This table showcases top-performing Airbnb hosts in Picassent based on the number of properties managed and estimated total revenue over the past year. Analyze their scale and performance metrics.
| Host Name | Properties | Grossing Revenue | Stay Reviews | Avg Rating |
|---|---|---|---|---|
| Margarita | 1 | $92,271 | 26 | 4.54/5.0 |
| Régine | 2 | $64,054 | 23 | 4.75/5.0 |
| Winahost | 1 | $46,118 | 4 | 4.50/5.0 |
| Edgar | 1 | $36,800 | 38 | 4.47/5.0 |
| Ángeles | 1 | $35,596 | 17 | 4.94/5.0 |
| Juan | 1 | $29,109 | 70 | 4.87/5.0 |
| Pilar | 1 | $26,719 | 9 | 4.89/5.0 |
| Host #189526611 | 1 | $22,656 | 0 | 0.00/5.0 |
| Noa | 2 | $22,243 | 76 | 4.48/5.0 |
| Juan | 1 | $13,782 | 36 | 4.64/5.0 |
Analyzing the strategies of top hosts, such as their property selection, pricing, and guest communication, can offer valuable lessons for optimizing your own Airbnb operations in Picassent.
Dive Deeper: Advanced Picassent STR Market Data (2025)
Ready to unlock more insights? AirROI provides access to advanced metrics and comprehensive Airbnb data for Picassent. Explore detailed analytics beyond this report to refine your investment strategy, optimize pricing, and maximize your vacation rental profits.
Explore Advanced MetricsPicassent Short-Term Rental Market Composition (2025): Property & Room Types
Room Type Distribution
Property Type Distribution
Market Composition Insights for Picassent
- The Picassent Airbnb market composition is heavily skewed towards Entire Home/Apt listings, which make up 80% of the 20 active rentals. This indicates strong guest preference for privacy and space.
- Looking at the property type distribution in Picassent, House properties are the most common (75%), reflecting the local real estate landscape.
- Houses represent a significant 75% portion, catering likely to families or larger groups.
Picassent Airbnb Room Capacity Analysis (2025): Bedroom Distribution
Distribution of Listings by Number of Bedrooms
Room Capacity Insights for Picassent
- The dominant room capacity in Picassent is 2 bedrooms listings, making up 25% of the market. This suggests a strong demand for properties suitable for couples or solo travelers.
- Together, 2 bedrooms and 1 bedroom properties represent 45.0% of the active Airbnb listings in Picassent, indicating a high concentration in these sizes.
- A significant 50.0% of listings offer 3+ bedrooms, catering to larger groups and families seeking more space in Picassent.
Picassent Vacation Rental Guest Capacity Trends (2025)
Distribution of Listings by Guest Capacity
Guest Capacity Insights for Picassent
- The most common guest capacity trend in Picassent vacation rentals is listings accommodating 8+ guests (45%). This suggests the primary traveler segment is likely larger groups.
- Properties designed for 8+ guests and 2 guests dominate the Picassent STR market, accounting for 60.0% of listings.
- 55.0% of properties accommodate 6+ guests, serving the market segment for larger families or group travel in Picassent.
- On average, properties in Picassent are equipped to host 5.2 guests.
Picassent Airbnb Booking Patterns (2025): Available vs. Booked Days
Available Days Distribution
Booked Days Distribution
Booking Pattern Insights for Picassent
- The most common availability pattern in Picassent falls within the 181-270 days range, representing 45% of listings. This suggests many properties have significant open periods on their calendars.
- Approximately 85.0% of listings show high availability (181+ days open annually), indicating potential for increased bookings or specific owner usage patterns.
- For booked days, the 91-180 days range is most frequent in Picassent (45%), reflecting common guest stay durations or potential owner blocking patterns.
- A notable 15.0% of properties secure long booking periods (181+ days booked per year), highlighting successful long-term rental strategies or significant owner usage.
Picassent Airbnb Minimum Stay Requirements Analysis
Distribution of Listings by Minimum Night Requirement
1 Night
5 listings
27.8% of total
2 Nights
6 listings
33.3% of total
4-6 Nights
1 listings
5.6% of total
7-29 Nights
2 listings
11.1% of total
30+ Nights
4 listings
22.2% of total
Key Insights
- The most prevalent minimum stay requirement in Picassent is 2 Nights, adopted by 33.3% of listings. This highlights the market's preference for shorter, flexible bookings.
- A strong majority (61.1%) of the Picassent Airbnb data shows acceptance of very short stays (1-2 nights), indicating a dynamic, high-turnover market.
- A significant segment (22.2%) caters to monthly stays (30+ nights) in Picassent, pointing to opportunities in the extended-stay market.
Recommendations
- Align with the market by considering a 2 Nights minimum stay, as 33.3% of Picassent hosts use this setting.
- If feasible, allowing 1-night stays, especially midweek or during low season, could capture last-minute bookings, as only 27.8% currently do.
- Explore offering discounts for stays of 30+ nights to attract the 22.2% of the market seeking extended stays.
- Adjust minimum nights based on seasonality – potentially shorter during low season and longer during peak demand periods in Picassent.
Picassent Airbnb Cancellation Policy Trends Analysis (2025)
Flexible
6 listings
37.5% of total
Moderate
6 listings
37.5% of total
Firm
2 listings
12.5% of total
Strict
2 listings
12.5% of total
Cancellation Policy Insights for Picassent
- The prevailing Airbnb cancellation policy trend in Picassent is Flexible, used by 37.5% of listings.
- The market strongly favors guest-friendly terms, with 75.0% of listings offering Flexible or Moderate policies. This suggests guests in Picassent may expect booking flexibility.
Recommendations for Hosts
- Consider adopting a Flexible policy to align with the 37.5% market standard in Picassent.
- Using a Strict policy might deter some guests, as only 12.5% of listings use it. Evaluate if potential revenue protection outweighs possible lower booking rates.
- Regularly review your cancellation policy against competitors and market demand shifts in Picassent.
Picassent STR Booking Lead Time Analysis (2025)
Average Booking Lead Time by Month
Booking Lead Time Insights for Picassent
- The overall average booking lead time for vacation rentals in Picassent is 47 days.
- Guests book furthest in advance for stays during July (average 76 days), likely coinciding with peak travel demand or local events.
- The shortest booking windows occur for stays in December (average 36 days), indicating more last-minute travel plans during this time.
- Seasonally, Summer (67 days avg.) sees the longest lead times, while Spring (42 days avg.) has the shortest, reflecting typical travel planning cycles.
Recommendations for Hosts
- Use the overall average lead time (47 days) as a baseline for your pricing and availability strategy in Picassent.
- For July stays, consider implementing length-of-stay discounts or slightly higher rates for bookings made less than 76 days out to capitalize on advance planning.
- Target marketing efforts for the Summer season well in advance (at least 67 days) to capture early planners.
- Monitor your own booking lead times against these Picassent averages to identify opportunities for dynamic pricing adjustments.
Popular & Essential Airbnb Amenities in Picassent (2025)
Amenity Prevalence
Amenity Insights for Picassent
- Essential amenities in Picassent that guests expect include: Kitchen, TV, Wifi, Hot water, Washer. Lacking these (any) could significantly impact bookings.
- Popular amenities like Essentials, Heating, Hangers are common but not universal. Offering these can provide a competitive edge.
Recommendations for Hosts
- Ensure your listing includes all essential amenities for Picassent: Kitchen, TV, Wifi, Hot water, Washer.
- Prioritize adding missing essentials: Hot water, Washer.
- Consider adding popular differentiators like Essentials or Heating to increase appeal.
- Highlight unique or less common amenities you offer (e.g., hot tub, dedicated workspace, EV charger) in your listing description and photos.
- Regularly check competitor amenities in Picassent to stay competitive.
Picassent Airbnb Guest Demographics & Profile Analysis (2025)
Guest Profile Summary for Picassent
- The typical guest profile for Airbnb in Picassent consists of a mix of domestic (53%) and international guests, often arriving from nearby Madrid, typically belonging to the Post-2000s (Gen Z/Alpha) group (50%), primarily speaking English or Spanish.
- Domestic travelers account for 53.4% of guests.
- Key international markets include Spain (53.4%) and France (13.7%).
- Top languages spoken are English (38.6%) followed by Spanish (31.3%).
- A significant demographic segment is the Post-2000s (Gen Z/Alpha) group, representing 50% of guests.
Recommendations for Hosts
- Balance marketing efforts between domestic and international channels based on the guest mix.
- Tailor amenities and listing descriptions to appeal to the dominant Post-2000s (Gen Z/Alpha) demographic (e.g., highlight fast WiFi, smart home features, local guides).
- Highlight unique local experiences or amenities relevant to the primary guest profile.
- Consider seasonal promotions aligned with peak travel times for key origin markets.
Nearby Short-Term Rental Market Comparison
How does the Picassent Airbnb market stack up against its neighbors? Compare key performance metrics like average monthly revenue, ADR, and occupancy rates in surrounding areas to understand the broader regional STR landscape.
| Market | Active Properties | Monthly Revenue | Daily Rate | Avg. Occupancy |
|---|---|---|---|---|
| Macastre | 13 | $2,924 | $296.93 | 42% |
| Corbera | 13 | $2,721 | $206.87 | 41% |
| Bétera | 31 | $2,711 | $222.77 | 46% |
| l'Eliana | 33 | $2,510 | $298.45 | 43% |
| San Antonio de Benagéber | 11 | $2,374 | $335.55 | 40% |
| Manises | 25 | $2,352 | $175.71 | 38% |
| Olocau | 11 | $2,245 | $308.22 | 36% |
| Alboraia / Alboraya | 272 | $2,220 | $186.05 | 49% |
| la Pobla de Vallbona | 27 | $2,163 | $193.69 | 49% |
| Riba-roja de Túria | 21 | $2,132 | $221.03 | 41% |