Paiporta Airbnb Market Analysis 2025: Short Term Rental Data & Vacation Rental Statistics in Valencian Community, Spain
Is Airbnb profitable in Paiporta in 2025? Explore comprehensive Airbnb analytics for Paiporta, Valencian Community, Spain to uncover income potential. This 2025 STR market report for Paiporta, based on AirROI data from April 2024 to March 2025, reveals key trends in the niche market of 32 active listings.
Whether you're considering an Airbnb investment in Paiporta, optimizing your existing vacation rental, or exploring rental arbitrage opportunities, understanding the Paiporta Airbnb data is crucial. Leveraging the low regulation environment is key to maximizing your short term rental income potential. Let's dive into the specifics.
Key Paiporta Airbnb Performance Metrics Overview
Monthly Airbnb Revenue Variations & Income Potential in Paiporta (2025)
Understanding the monthly revenue variations for Airbnb listings in Paiporta is key to maximizing your short term rental income potential. Seasonality significantly impacts earnings. Our analysis, based on data from the past 12 months, shows that the peak revenue month for STRs in Paiporta is typically August, while November often presents the lowest earnings, highlighting opportunities for strategic pricing adjustments during shoulder and low seasons. Explore the typical Airbnb income in Paiporta across different performance tiers:
- Best-in-class properties (Top 10%) achieve $2,527+ monthly, often utilizing dynamic pricing and superior guest experiences.
- Strong performing properties (Top 25%) earn $1,938 or more, indicating effective management and desirable locations/amenities.
- Typical properties (Median) generate around $1,237 per month, representing the average market performance.
- Entry-level properties (Bottom 25%) see earnings around $562, often with potential for optimization.
Average Monthly Airbnb Earnings Trend in Paiporta
Paiporta Airbnb Occupancy Rate Trends (2025)
Maximize your bookings by understanding the Paiporta STR occupancy trends. Seasonal demand shifts significantly influence how often properties are booked. Typically, Augustsees the highest demand (peak season occupancy), while November experiences the lowest (low season). Effective strategies, like adjusting minimum stays or offering promotions, can boost occupancy during slower periods. Here's how different property tiers perform in Paiporta:
- Best-in-class properties (Top 10%) achieve 80%+ occupancy, indicating high desirability and potentially optimized availability.
- Strong performing properties (Top 25%) maintain 59% or higher occupancy, suggesting good market fit and guest satisfaction.
- Typical properties (Median) have an occupancy rate around 39%.
- Entry-level properties (Bottom 25%) average 18% occupancy, potentially facing higher vacancy.
Average Monthly Occupancy Rate Trend in Paiporta
Average Daily Rate (ADR) Airbnb Trends in Paiporta (2025)
Effective short term rental pricing strategy in Paiporta involves understanding monthly ADR fluctuations. The Average Daily Rate (ADR) for Airbnb in Paiporta typically peaks in July and dips lowest during November. Leveraging Airbnb dynamic pricing tools or strategies based on this seasonality can significantly boost revenue. Here's a look at the typical nightly rates achieved:
- Best-in-class properties (Top 10%) command rates of $129+ per night, often due to premium features or locations.
- Strong performing properties (Top 25%) achieve nightly rates of $108 or more.
- Typical properties (Median) charge around $91 per night.
- Entry-level properties (Bottom 25%) earn around $74 per night.
Average Daily Rate (ADR) Trend by Month in Paiporta
Get Live Paiporta Market Intelligence 👇

Explore Real-time Analytics
Airbnb Seasonality Analysis & Trends in Paiporta (2025)
Peak Season (August, April, December)
- Revenue averages $1,821 per month
- Occupancy rates average 53.9%
- Daily rates average $111
Shoulder Season
- Revenue averages $1,462 per month
- Occupancy maintains around 44.1%
- Daily rates hold near $117
Low Season (January, March, November)
- Revenue drops to average $724 per month
- Occupancy decreases to average 22.4%
- Daily rates adjust to average $100
Seasonality Insights for Paiporta
- The Airbnb seasonality in Paiporta shows highly seasonal trends requiring careful strategy. While the sections above show seasonal averages, it's also insightful to look at the extremes:
- During the high season, the absolute peak month showcases Paiporta's highest earning potential, with monthly revenues capable of climbing to $1,863, occupancy reaching a high of 66.7%, and ADRs peaking at $122.
- Conversely, the slowest single month of the year, typically falling within the low season, marks the market's lowest point. In this month, revenue might dip to $459, occupancy could drop to 17.6%, and ADRs may adjust down to $87.
- Understanding both the seasonal averages and these monthly peaks and troughs in revenue, occupancy, and ADR is crucial for maximizing your Airbnb profit potential in Paiporta.
Seasonal Strategies for Maximizing Profit
- Peak Season: Maximize revenue through premium pricing and potentially longer minimum stays. Ensure high availability.
- Low Season: Offer competitive pricing, special promotions (e.g., extended stay discounts), and flexible cancellation policies. Target off-season travelers like remote workers or budget-conscious guests.
- Shoulder Seasons: Implement dynamic pricing that balances peak and low rates. Target weekend travelers or specific events. Offer slightly more flexible terms than peak season.
- Regularly analyze your own performance against these Paiporta seasonality benchmarks and adjust your pricing and availability strategy accordingly.
Best Areas for Airbnb Investment in Paiporta (2025)
Exploring the top neighborhoods for short-term rentals in Paiporta? This section highlights key areas, outlining why they are attractive for hosts and guests, along with notable local attractions. Consider these locations based on your target guest profile and investment strategy.
| Neighborhood / Area | Why Host Here? (Target Guests & Appeal) | Key Attractions & Landmarks |
|---|---|---|
| Paseo de la Alameda | A scenic promenade in the heart of Valencia, popular for its views and proximity to parks. Ideal for visitors who enjoy walking and exploring local culture. | Turia Gardens, Valencia Fallas Museum, Palau de la Música, Valencia Bullring, City of Arts and Sciences |
| Historical Centre | The old town of Valencia brimming with history, architecture, and vibrant squares, attractive to tourists interested in culture and heritage. Great for those who want a traditional Spanish experience. | Valencia Cathedral, La Lonja de la Seda, Plaza de la Virgen, Turia Fountain, Central Market |
| Ruzafa | A trendy neighborhood known for its eclectic vibe, art galleries, and diverse restaurants. Appeals to young travelers and those looking for a lively atmosphere. | Mercado de Ruzafa, Ruzafa Market, Cafés and bars, Street art, Cultural events |
| Malvarrosa Beach | Popular beach area with a vibrant atmosphere, perfect for sun-seekers and families. Offers a mix of relaxation and fun activities. | Malvarrosa Beach, Las Fallas Festival, Beachfront restaurants, Water sports, Promenade |
| Benimaclet | A lively neighborhood known for its local markets and community feel, attracting visitors who seek an authentic Valencian experience. | Benimaclet Market, Local tapas bars, Cultural festivals, Art spaces, Public parks |
| Alameda | An important avenue lined with gardens, museums, and event spaces, attractive for tourists who love arts and beautiful greenery. | Museo de Bellas Artes, Jardín de Monforte, Cultural Center, Café and restaurants, Cultural events |
| Patacona | A quieter beach area away from the hustle and bustle of Valencia, great for families and those seeking a relaxing stay. | Patacona Beach, Beachfront promenade, Local ambiance, Parks nearby, Restaurants with sea views |
| La Zaidía | A charming district known for its local festivals and markets, perfect for visitors who want to connect with local culture. | Cultural festivals, Local markets, Parks, Street parties, Historic buildings |
Understanding Airbnb License Requirements & STR Laws in Paiporta (2025)
While Paiporta, Valencian Community, Spain currently shows low STR regulations, specific Airbnb license requirements might still exist or change. Always verify the latest short term rental regulations and Airbnb license requirements directly with local government authorities for Paiporta to ensure full compliance before hosting.
(Source: AirROI data, 2025, based on 6% licensed listings)
Top Performing Airbnb Properties in Paiporta (2025)
Benchmark your potential! Explore examples of top-performing Airbnb properties in Paiportabased on Trailing Twelve Month (TTM) revenue. Analyze their characteristics, revenue, occupancy rate, and ADR to understand what drives success in this market.
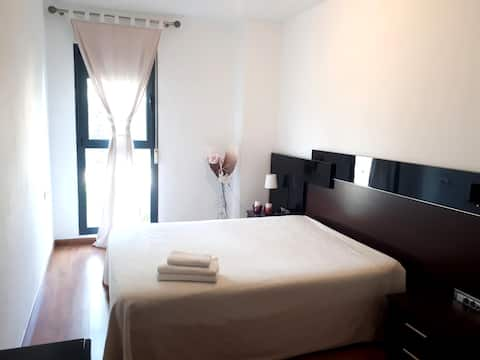
Paiporta 5 min. from Valencia by car.
Entire Place • 3 bedrooms

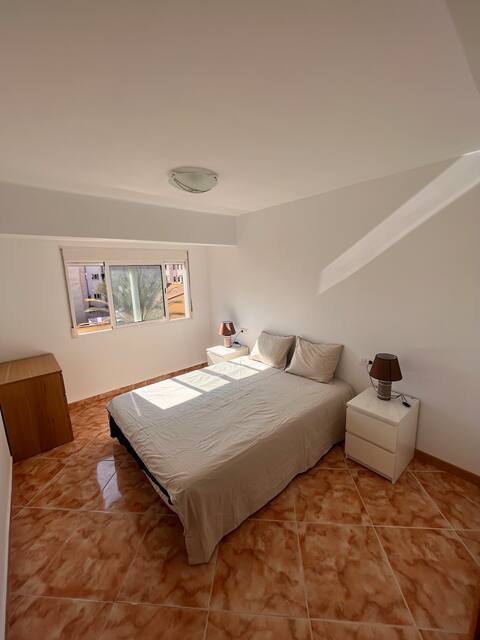
Apartment near Valencia. Good communication.
Entire Place • 2 bedrooms
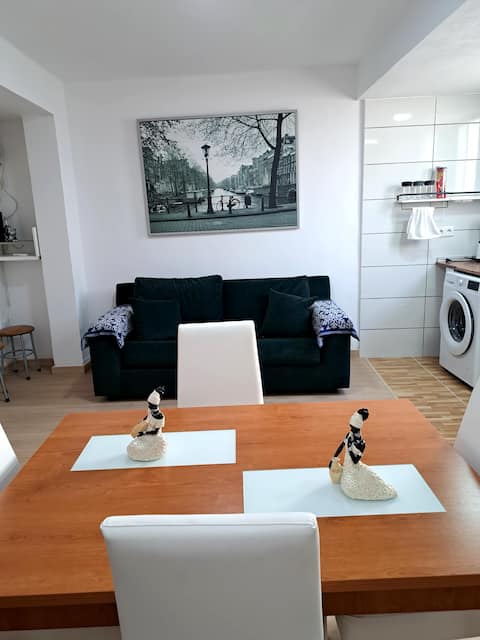
Apartamento en Paiporta
Entire Place • 2 bedrooms
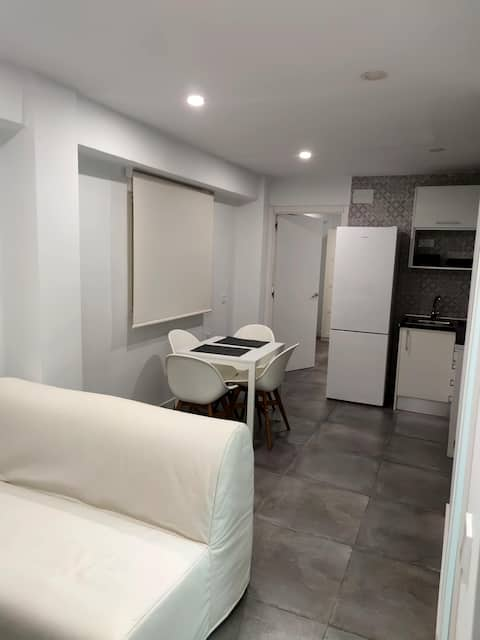
Encantador piso cerca a Valencia
Entire Place • 2 bedrooms

Piso Colon VT- 40927-V
Entire Place • 4 bedrooms
Wonderful Studio in Paiporta
Entire Place • 1 bedroom
Note: Performance varies based on location, size, amenities, seasonality, and management quality. Data reflects the past 12 months.
Top Performing Airbnb Hosts in Paiporta (2025)
Learn from the best! This table showcases top-performing Airbnb hosts in Paiporta based on the number of properties managed and estimated total revenue over the past year. Analyze their scale and performance metrics.
| Host Name | Properties | Grossing Revenue | Stay Reviews | Avg Rating |
|---|---|---|---|---|
| Rosario | 17 | $95,353 | 19 | 1.10/5.0 |
| Jorge | 2 | $32,489 | 186 | 4.43/5.0 |
| Shirlei | 1 | $29,226 | 116 | 4.81/5.0 |
| Host #19508658 | 2 | $28,879 | 95 | 4.92/5.0 |
| Amparo Belén | 1 | $24,625 | 33 | 4.76/5.0 |
| Danelia | 1 | $20,737 | 61 | 4.89/5.0 |
| Joaquín | 1 | $17,238 | 49 | 4.94/5.0 |
| Oscar | 1 | $17,222 | 22 | 4.45/5.0 |
| Host #24396833 | 1 | $16,906 | 0 | 0.00/5.0 |
| Claudia Y César | 3 | $4,017 | 86 | 4.90/5.0 |
Analyzing the strategies of top hosts, such as their property selection, pricing, and guest communication, can offer valuable lessons for optimizing your own Airbnb operations in Paiporta.
Dive Deeper: Advanced Paiporta STR Market Data (2025)
Ready to unlock more insights? AirROI provides access to advanced metrics and comprehensive Airbnb data for Paiporta. Explore detailed analytics beyond this report to refine your investment strategy, optimize pricing, and maximize your vacation rental profits.
Explore Advanced MetricsPaiporta Short-Term Rental Market Composition (2025): Property & Room Types
Room Type Distribution
Property Type Distribution
Market Composition Insights for Paiporta
- The Paiporta Airbnb market composition is heavily skewed towards Private Room listings, which make up 65.6% of the 32 active rentals. This indicates strong guest preference for privacy and space.
- Looking at the property type distribution in Paiporta, Hotel/Boutique properties are the most common (53.1%), reflecting the local real estate landscape.
- The presence of 53.1% Hotel/Boutique listings indicates integration with traditional hospitality.
Paiporta Airbnb Room Capacity Analysis (2025): Bedroom Distribution
Distribution of Listings by Number of Bedrooms
Room Capacity Insights for Paiporta
- The dominant room capacity in Paiporta is 1 bedroom listings, making up 65.6% of the market. This suggests a strong demand for properties suitable for couples or solo travelers.
- Together, 1 bedroom and 2 bedrooms properties represent 81.2% of the active Airbnb listings in Paiporta, indicating a high concentration in these sizes.
- With over half the market (65.6%) consisting of studios or 1-bedroom units, Paiporta is particularly well-suited for individuals or couples.
Paiporta Vacation Rental Guest Capacity Trends (2025)
Distribution of Listings by Guest Capacity
Guest Capacity Insights for Paiporta
- The most common guest capacity trend in Paiporta vacation rentals is listings accommodating 3 guests (31.3%). This suggests the primary traveler segment is likely small families or groups.
- Properties designed for 3 guests and 2 guests dominate the Paiporta STR market, accounting for 53.2% of listings.
- On average, properties in Paiporta are equipped to host 3.1 guests.
Paiporta Airbnb Booking Patterns (2025): Available vs. Booked Days
Available Days Distribution
Booked Days Distribution
Booking Pattern Insights for Paiporta
- The most common availability pattern in Paiporta falls within the 271-366 days range, representing 53.1% of listings. This suggests many properties have significant open periods on their calendars.
- Approximately 81.2% of listings show high availability (181+ days open annually), indicating potential for increased bookings or specific owner usage patterns.
- For booked days, the 91-180 days range is most frequent in Paiporta (28.1%), reflecting common guest stay durations or potential owner blocking patterns.
- A notable 18.8% of properties secure long booking periods (181+ days booked per year), highlighting successful long-term rental strategies or significant owner usage.
Paiporta Airbnb Minimum Stay Requirements Analysis
Distribution of Listings by Minimum Night Requirement
1 Night
17 listings
60.7% of total
2 Nights
3 listings
10.7% of total
3 Nights
5 listings
17.9% of total
7-29 Nights
1 listings
3.6% of total
30+ Nights
2 listings
7.1% of total
Key Insights
- The most prevalent minimum stay requirement in Paiporta is 1 Night, adopted by 60.7% of listings. This highlights the market's preference for shorter, flexible bookings.
- A strong majority (71.4%) of the Paiporta Airbnb data shows acceptance of very short stays (1-2 nights), indicating a dynamic, high-turnover market.
Recommendations
- Align with the market by considering a 1 Night minimum stay, as 60.7% of Paiporta hosts use this setting.
- Explore offering discounts for stays of 30+ nights to attract the 7.1% of the market seeking extended stays.
- Adjust minimum nights based on seasonality – potentially shorter during low season and longer during peak demand periods in Paiporta.
Paiporta Airbnb Cancellation Policy Trends Analysis (2025)
Flexible
4 listings
26.7% of total
Moderate
5 listings
33.3% of total
Firm
1 listings
6.7% of total
Strict
5 listings
33.3% of total
Cancellation Policy Insights for Paiporta
- The prevailing Airbnb cancellation policy trend in Paiporta is Moderate, used by 33.3% of listings.
- There's a relatively balanced mix between guest-friendly (60.0%) and stricter (40.0%) policies, offering choices for different guest needs.
Recommendations for Hosts
- Consider adopting a Moderate policy to align with the 33.3% market standard in Paiporta.
- With 33.3% using Strict terms, this is a viable option in Paiporta, particularly for high-value properties or during peak demand periods.
- Regularly review your cancellation policy against competitors and market demand shifts in Paiporta.
Paiporta STR Booking Lead Time Analysis (2025)
Average Booking Lead Time by Month
Booking Lead Time Insights for Paiporta
- The overall average booking lead time for vacation rentals in Paiporta is 26 days.
- Guests book furthest in advance for stays during May (average 78 days), likely coinciding with peak travel demand or local events.
- The shortest booking windows occur for stays in January (average 19 days), indicating more last-minute travel plans during this time.
- Seasonally, Spring (63 days avg.) sees the longest lead times, while Fall (29 days avg.) has the shortest, reflecting typical travel planning cycles.
Recommendations for Hosts
- Use the overall average lead time (26 days) as a baseline for your pricing and availability strategy in Paiporta.
- For May stays, consider implementing length-of-stay discounts or slightly higher rates for bookings made less than 78 days out to capitalize on advance planning.
- Target marketing efforts for the Spring season well in advance (at least 63 days) to capture early planners.
- Monitor your own booking lead times against these Paiporta averages to identify opportunities for dynamic pricing adjustments.
Popular & Essential Airbnb Amenities in Paiporta (2025)
Amenity Prevalence
Amenity Insights for Paiporta
- Essential amenities in Paiporta that guests expect include: TV, Hot water, Air conditioning, Wifi, Heating. Lacking these (any) could significantly impact bookings.
- Popular amenities like Essentials, Kitchen, Bed linens are common but not universal. Offering these can provide a competitive edge.
Recommendations for Hosts
- Ensure your listing includes all essential amenities for Paiporta: TV, Hot water, Air conditioning, Wifi, Heating.
- Prioritize adding missing essentials: Wifi, Heating.
- Consider adding popular differentiators like Essentials or Kitchen to increase appeal.
- Highlight unique or less common amenities you offer (e.g., hot tub, dedicated workspace, EV charger) in your listing description and photos.
- Regularly check competitor amenities in Paiporta to stay competitive.
Paiporta Airbnb Guest Demographics & Profile Analysis (2025)
Guest Profile Summary for Paiporta
- The typical guest profile for Airbnb in Paiporta consists of a mix of domestic (44%) and international guests, with top international origins including France, typically belonging to the Post-2000s (Gen Z/Alpha) group (50%), primarily speaking English or Spanish.
- Domestic travelers account for 44.2% of guests.
- Key international markets include Spain (44.2%) and France (8.3%).
- Top languages spoken are English (35.9%) followed by Spanish (32.3%).
- A significant demographic segment is the Post-2000s (Gen Z/Alpha) group, representing 50% of guests.
Recommendations for Hosts
- Balance marketing efforts between domestic and international channels based on the guest mix.
- Tailor amenities and listing descriptions to appeal to the dominant Post-2000s (Gen Z/Alpha) demographic (e.g., highlight fast WiFi, smart home features, local guides).
- Highlight unique local experiences or amenities relevant to the primary guest profile.
- Consider seasonal promotions aligned with peak travel times for key origin markets.
Nearby Short-Term Rental Market Comparison
How does the Paiporta Airbnb market stack up against its neighbors? Compare key performance metrics like average monthly revenue, ADR, and occupancy rates in surrounding areas to understand the broader regional STR landscape.
| Market | Active Properties | Monthly Revenue | Daily Rate | Avg. Occupancy |
|---|---|---|---|---|
| Macastre | 13 | $2,924 | $296.93 | 42% |
| Corbera | 13 | $2,721 | $206.87 | 41% |
| Bétera | 31 | $2,711 | $222.77 | 46% |
| l'Eliana | 33 | $2,510 | $298.45 | 43% |
| San Antonio de Benagéber | 11 | $2,374 | $335.55 | 40% |
| Manises | 25 | $2,352 | $175.71 | 38% |
| Olocau | 11 | $2,245 | $308.22 | 36% |
| Alboraia / Alboraya | 272 | $2,220 | $186.05 | 49% |
| la Pobla de Vallbona | 27 | $2,163 | $193.69 | 49% |
| Riba-roja de Túria | 21 | $2,132 | $221.03 | 41% |